All Figures and Data
| Figures | ||
|---|---|---|
| Global oil markets | ||
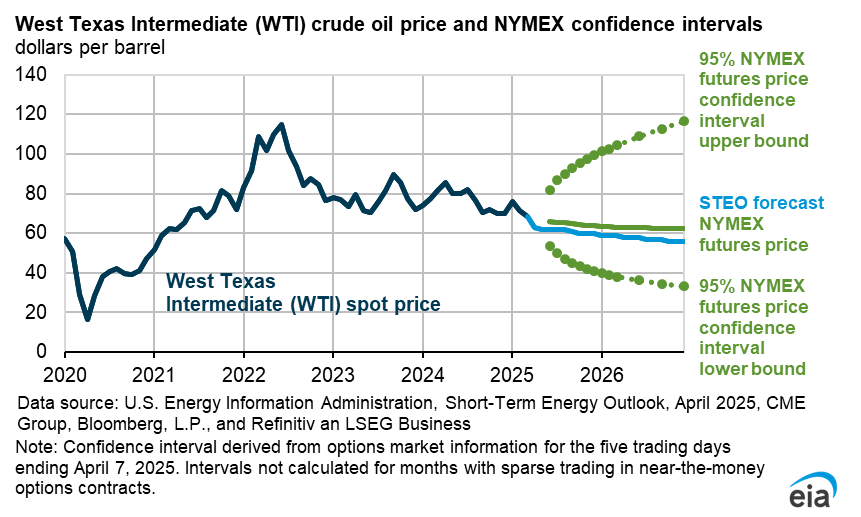
| West Texas Intermediate (WTI) crude oil price | XLSX | PNG |
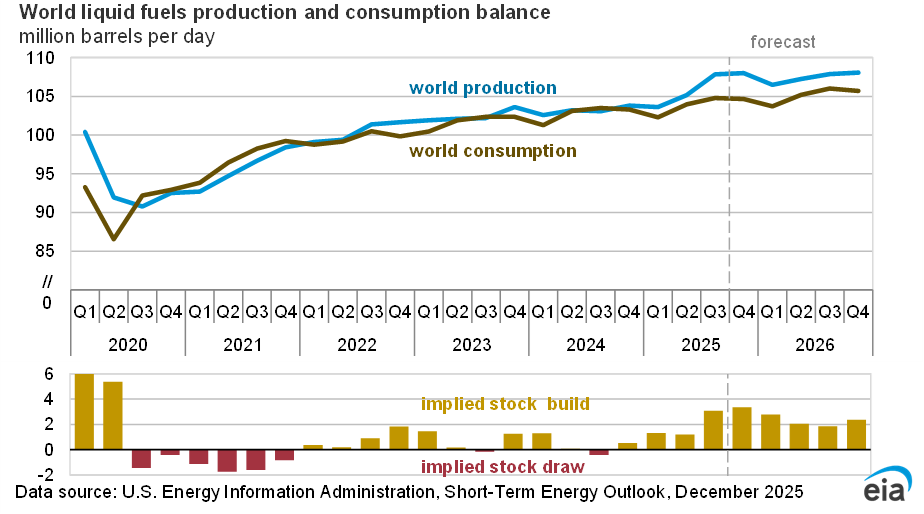
| World liquid fuels production and consumption balance | XLSX | PNG |
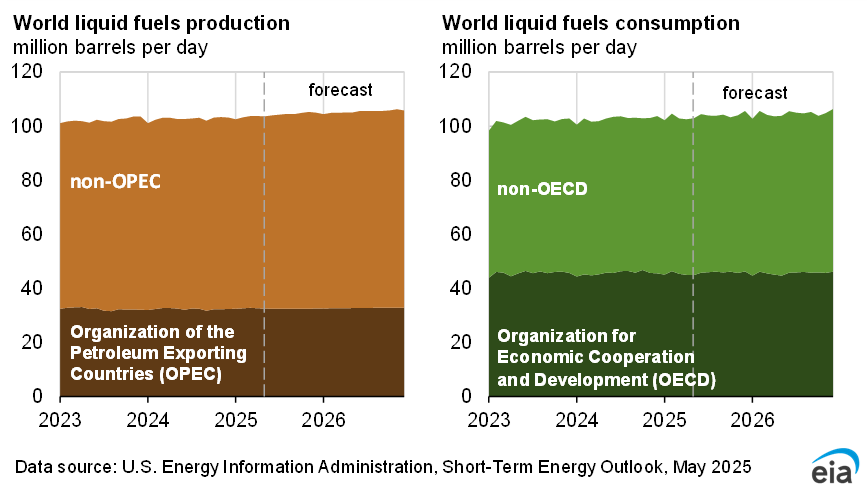
| World liquid fuels production and consumption | XLSX | PNG |
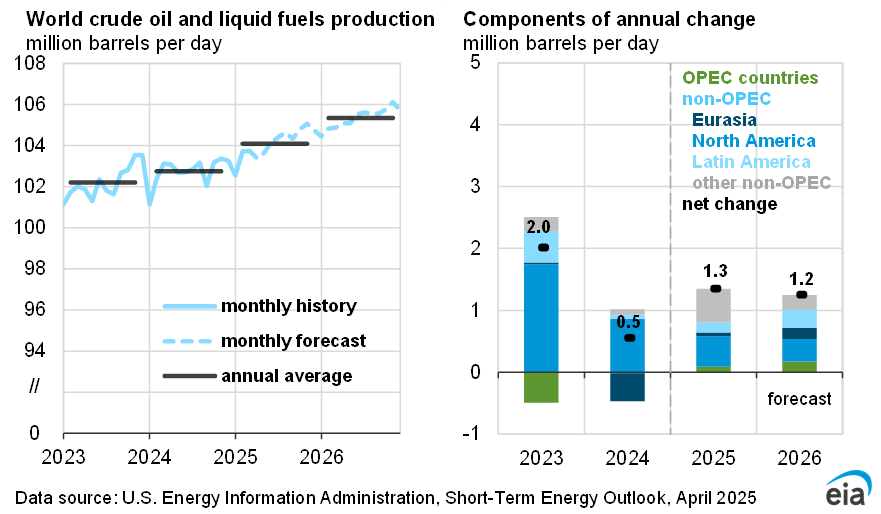
| World crude oil and liquid fuels production | XLSX | PNG |
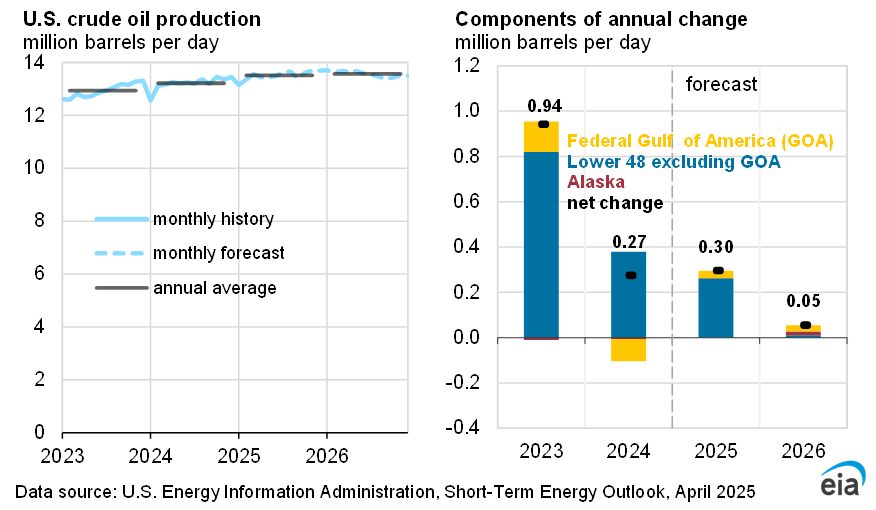
| U.S. crude oil production | XLSX | PNG |
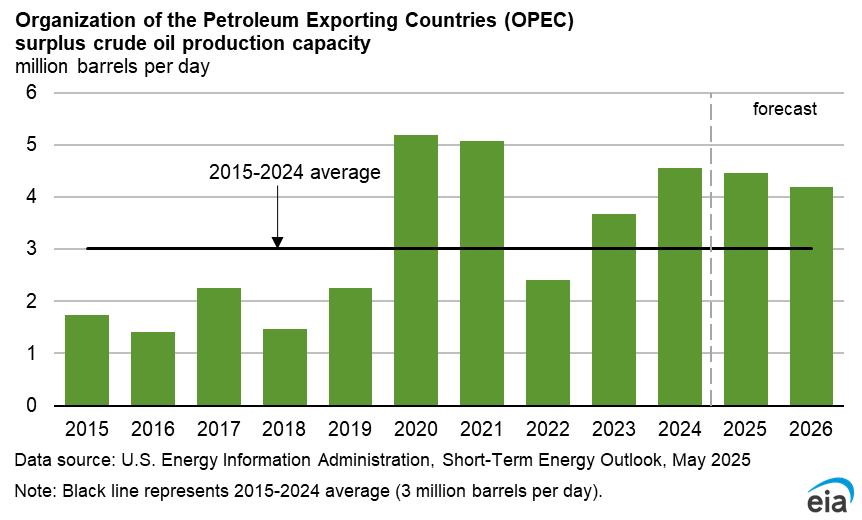
| OPEC surplus crude oil production capacity | XLSX | PNG |
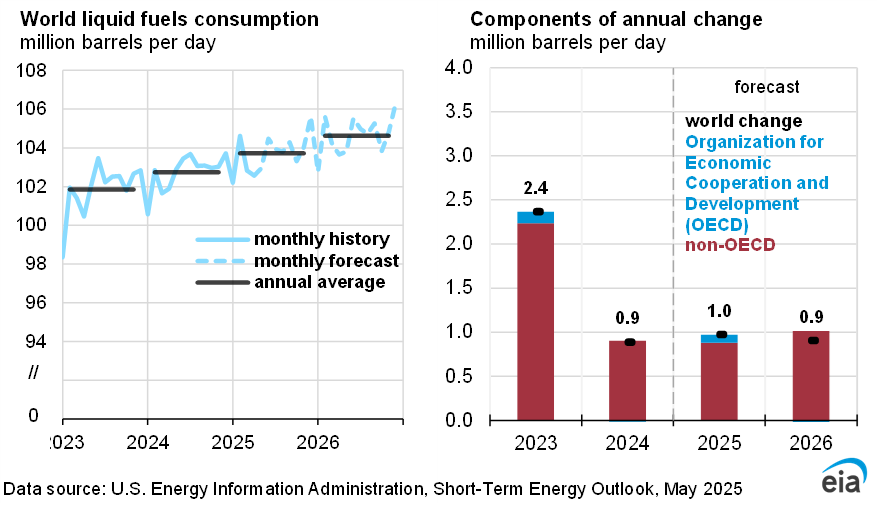
| World liquid fuels consumption | XLSX | PNG |
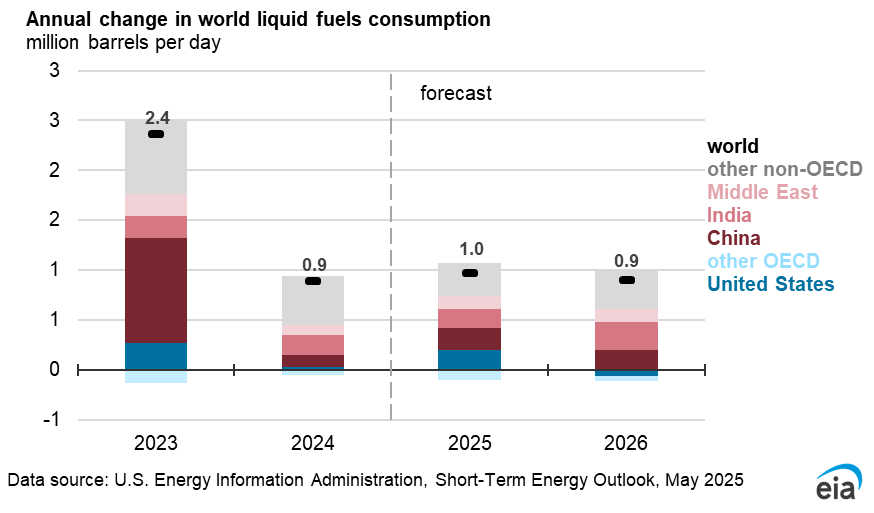
| World liquid fuels consumption growth | XLSX | PNG |
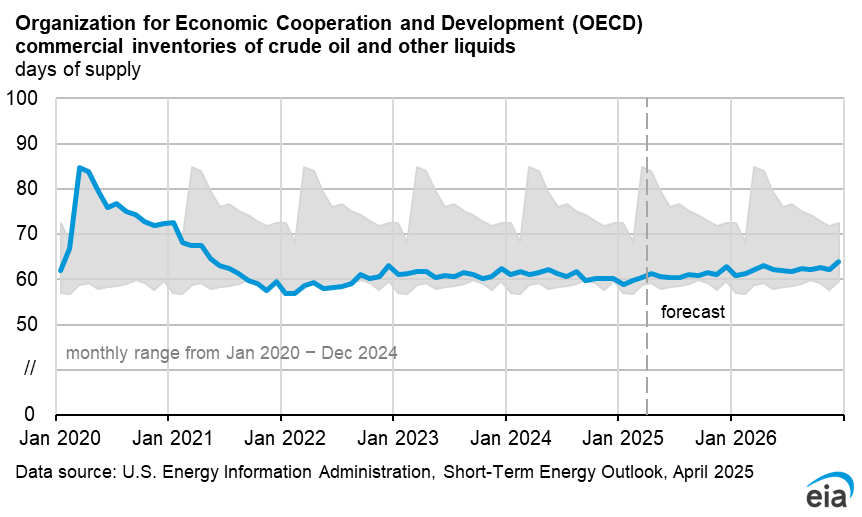
| OECD commercial inventories of crude oil and other liquids (days of supply) | XLSX | PNG |
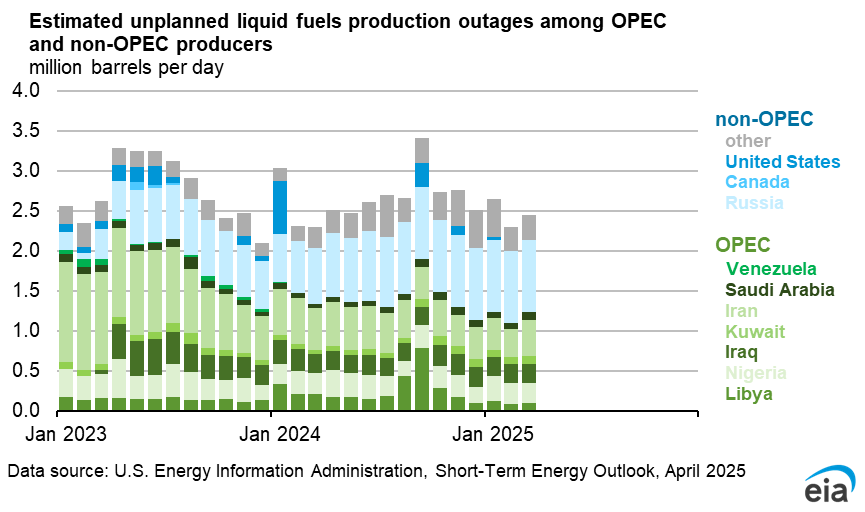
| Estimated unplanned crude oil production outages among OPEC and non-OPEC producers | XLSX | PNG |
| Petroleum products | ||
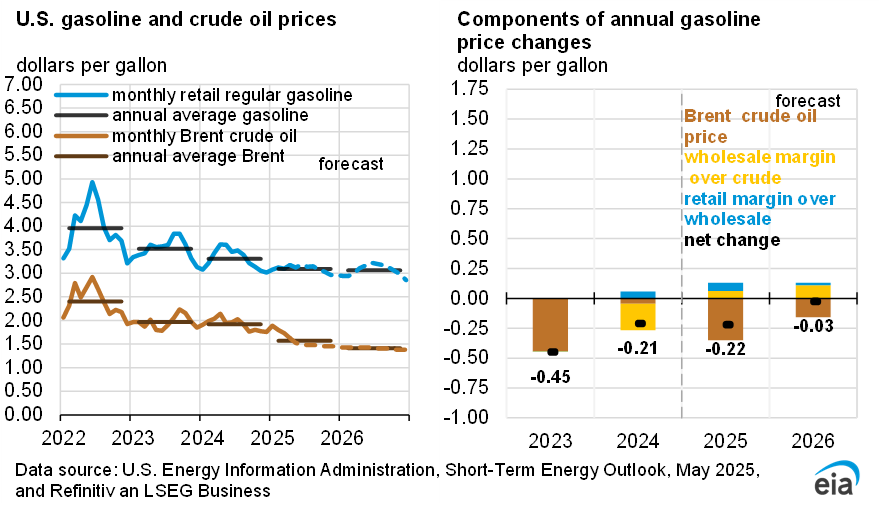
| U.S. gasoline and crude oil prices | XLSX | PNG |
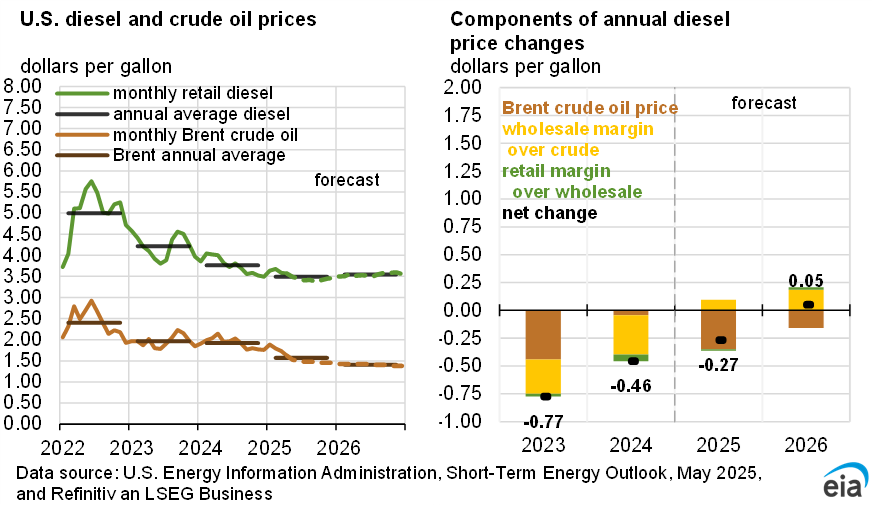
| U.S. diesel fuel and crude oil prices | XLSX | PNG |
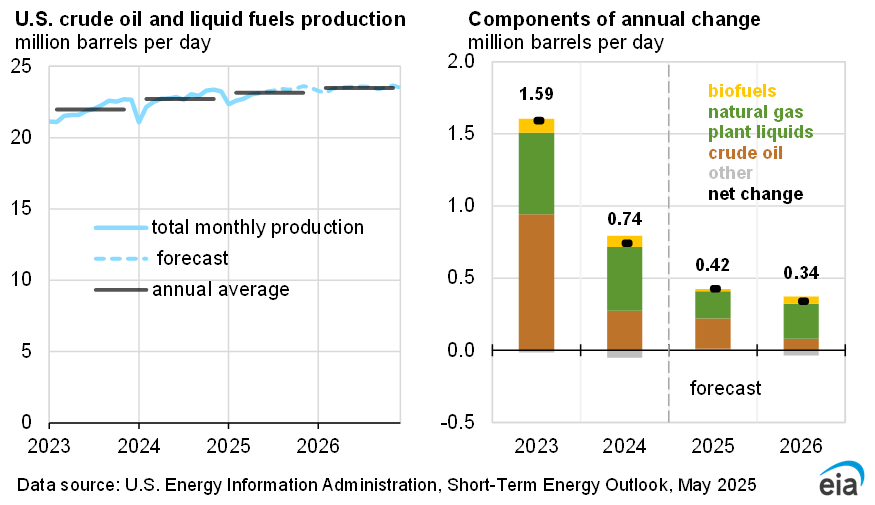
| U.S. liquid fuels production growth | XLSX | PNG |
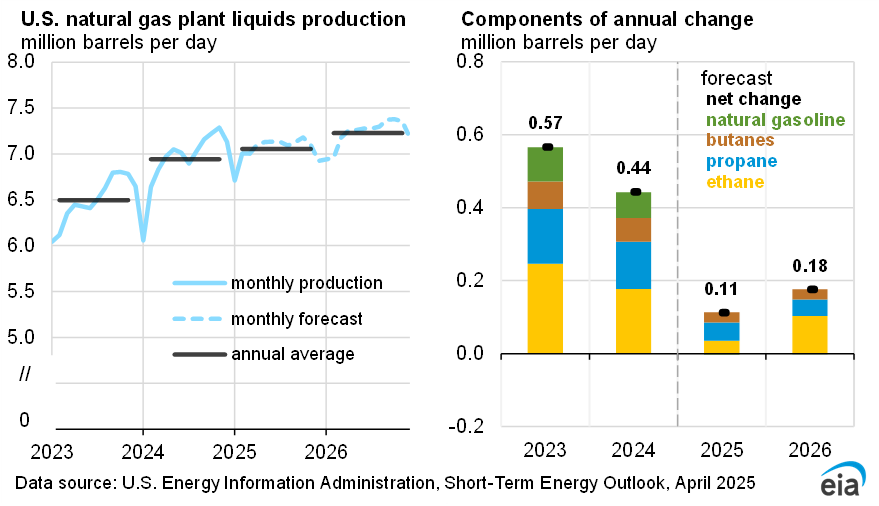
| U.S. natural gas plant liquids production | XLSX | PNG |
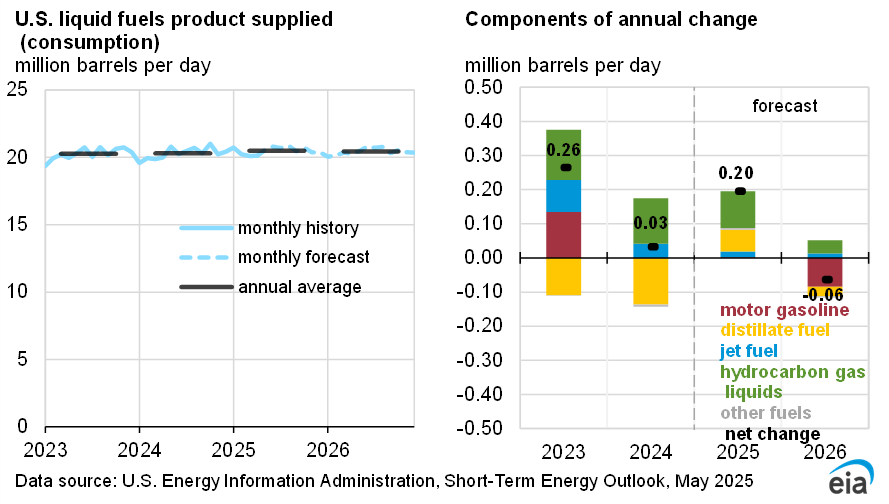
| U.S. liquid fuels product supplied growth | XLSX | PNG |
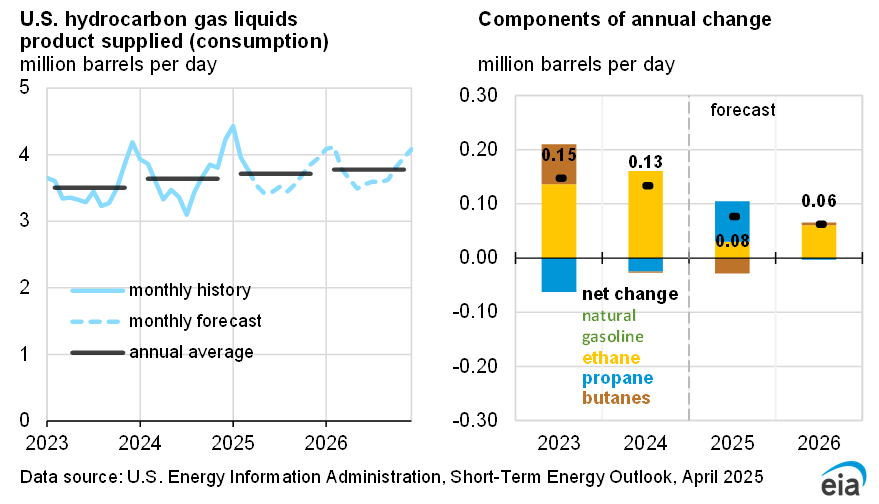
| U.S. hydrocarbon gas liquids consumption | XLSX | PNG |
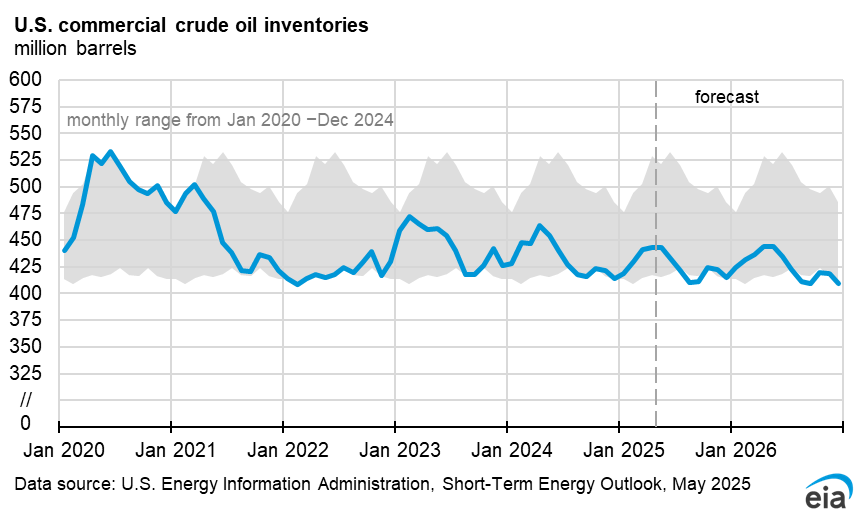
| U.S. commercial crude oil inventories | XLSX | PNG |
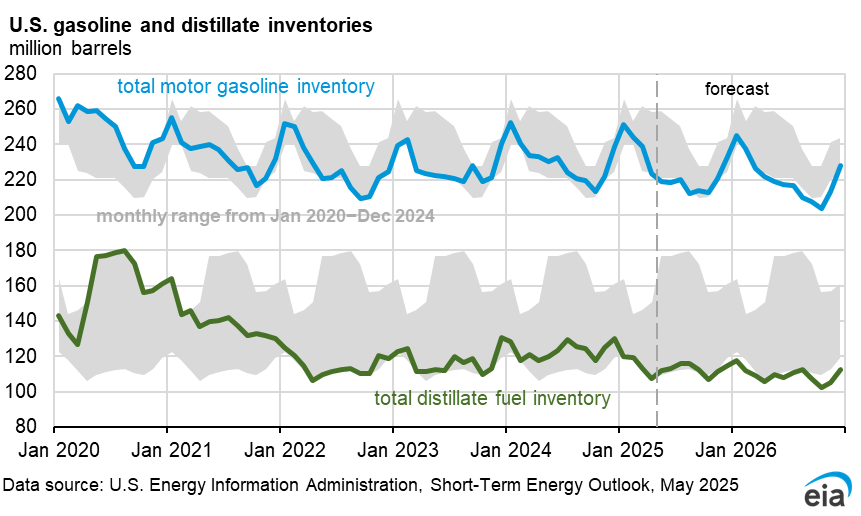
| U.S. gasoline and distillate inventories | XLSX | PNG |
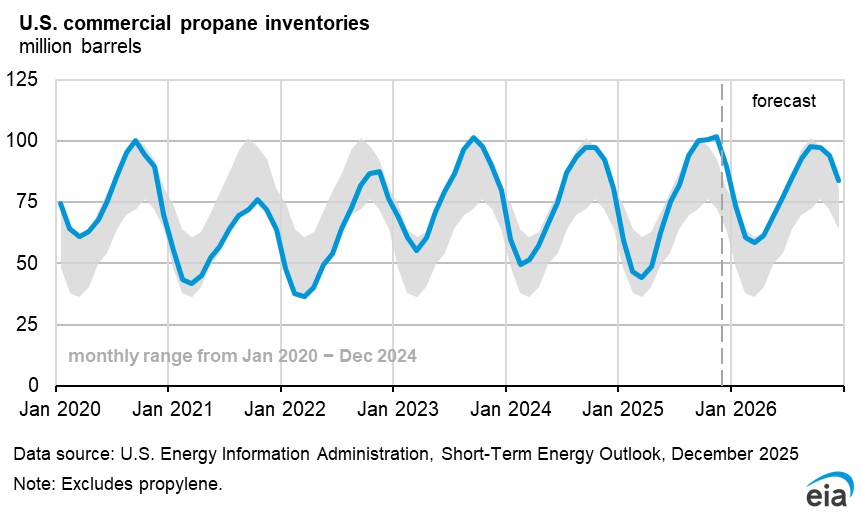
| U.S. commercial propane inventories | XLSX | PNG |
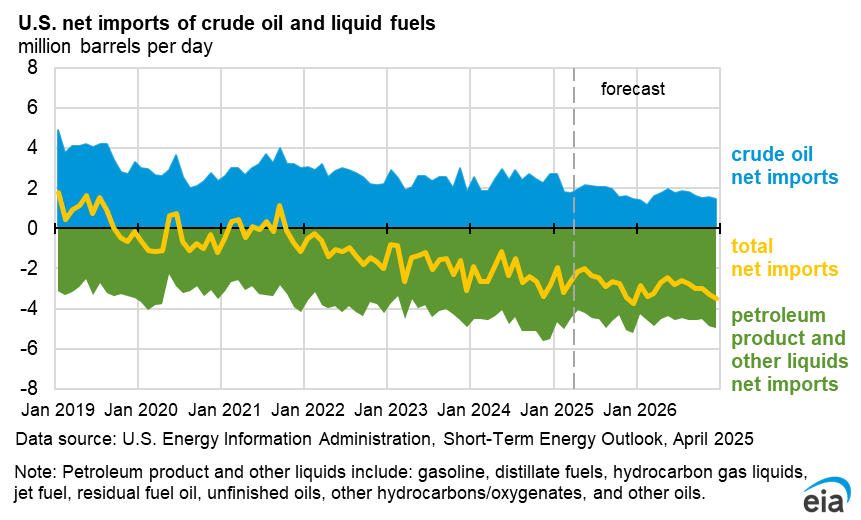
| U.S. net imports of crude oil and liquid fuels | XLSX | PNG |
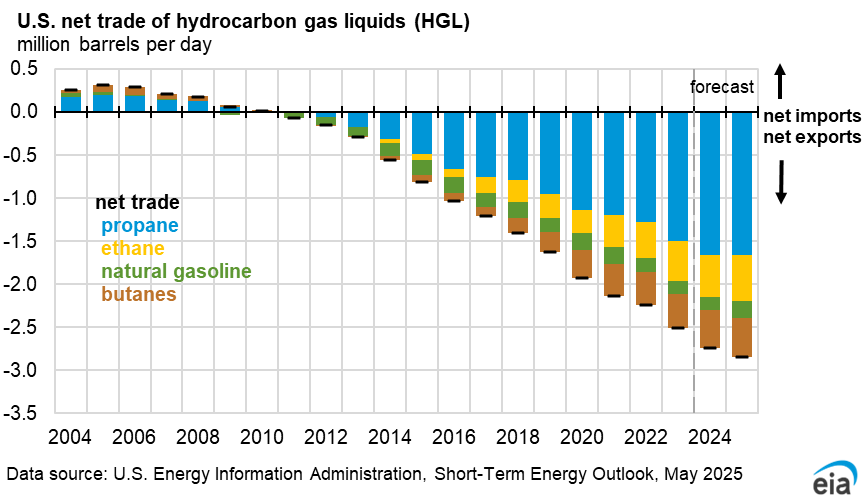
| U.S. net trade of hydrocarbon gas liquids | XLSX | PNG |
| Natural gas | ||
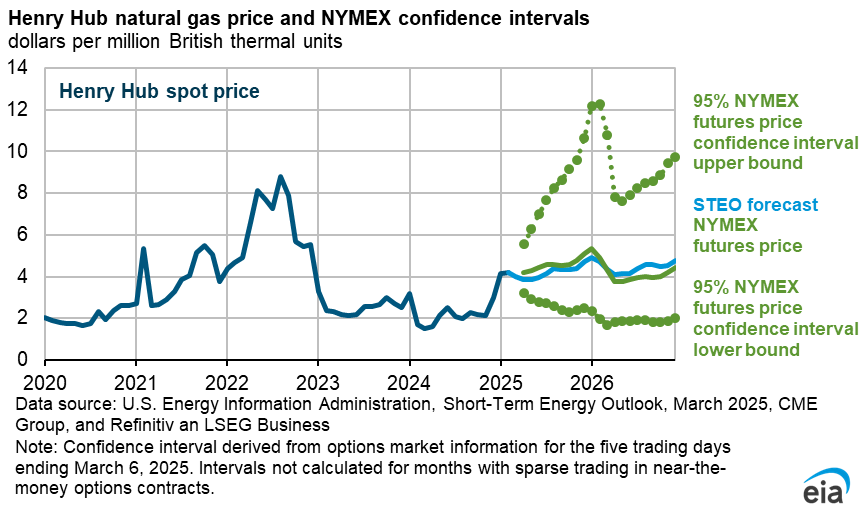
| Henry Hub natural gas price | XLSX | PNG |
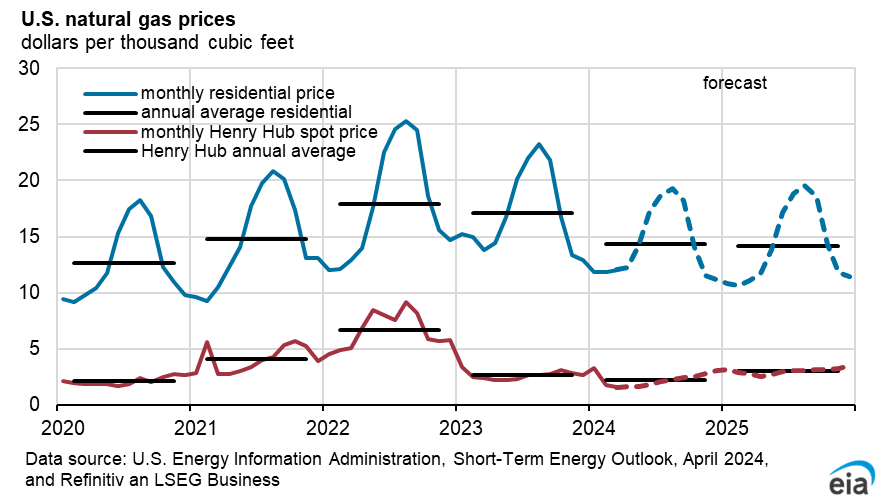
| U.S. natural gas prices | XLSX | PNG |
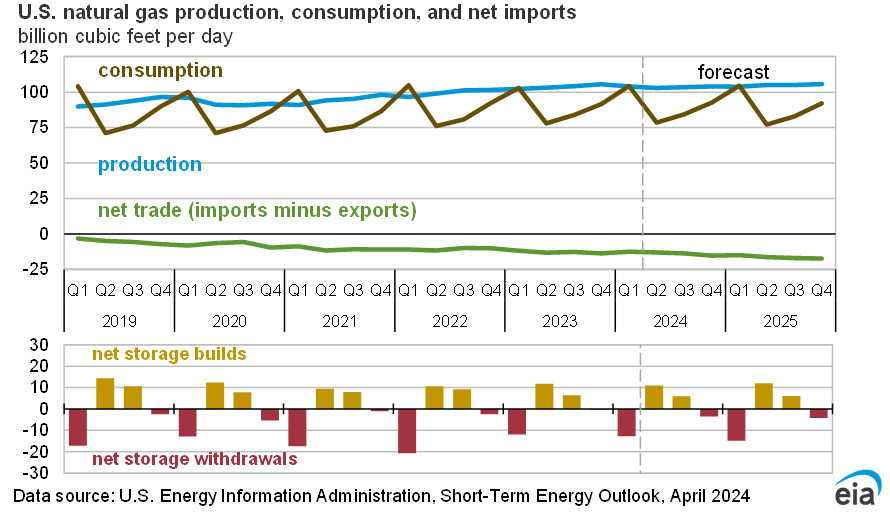
| U.S. natural gas balance | XLSX | PNG |
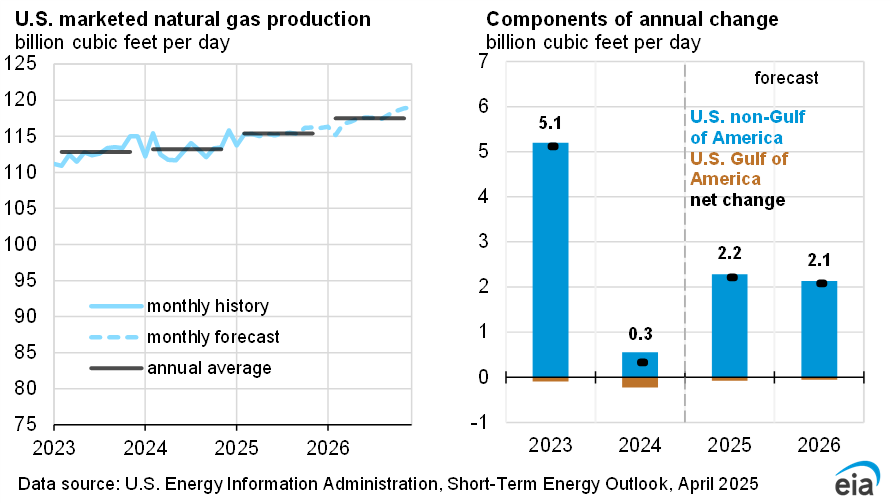
| U.S. marketed natural gas production | XLSX | PNG |
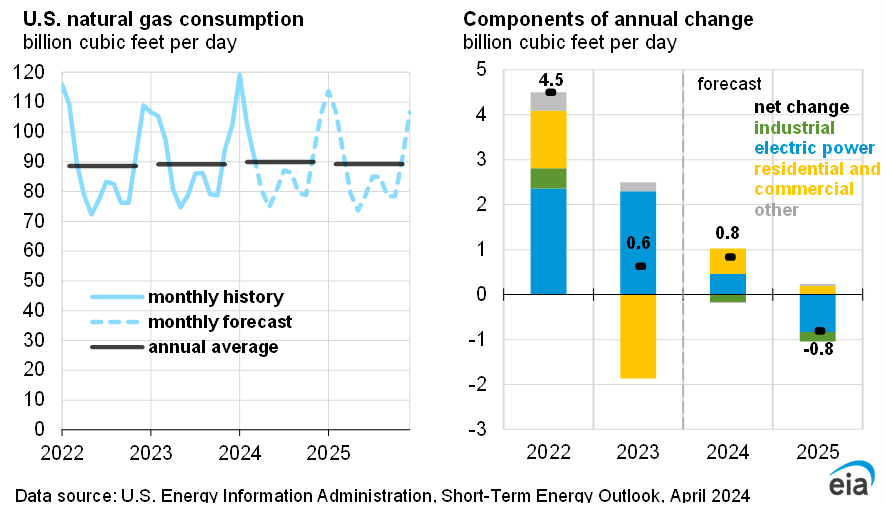
| U.S. natural gas consumption | XLSX | PNG |
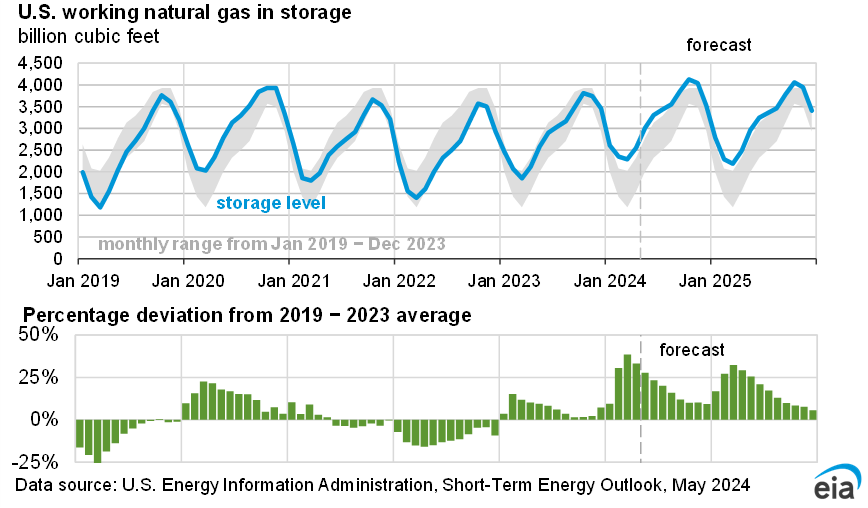
| U.S. working natural gas in storage | XLSX | PNG |
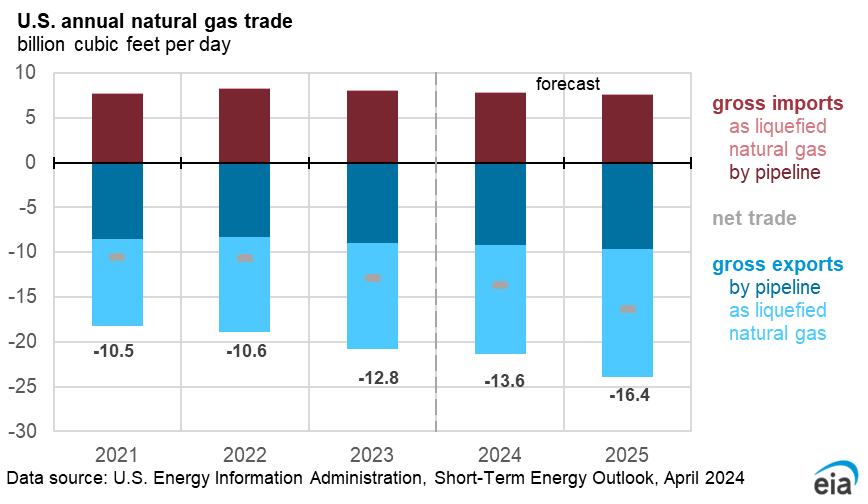
| U.S. natural gas trade | XLSX | PNG |
| Electricity, coal, and renewables | ||
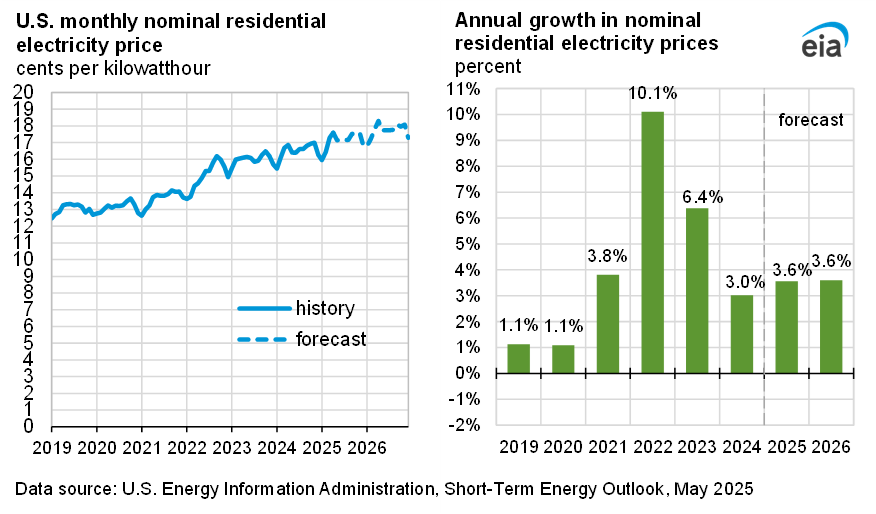
| U.S. residential electricity price | XLSX | PNG |
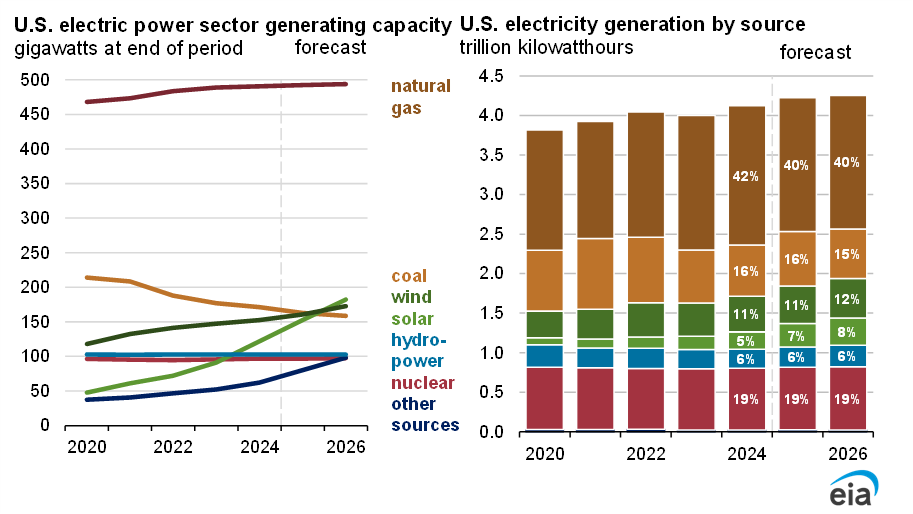
| U.S. electric power sector capacity and generation | XLSX | PNG |
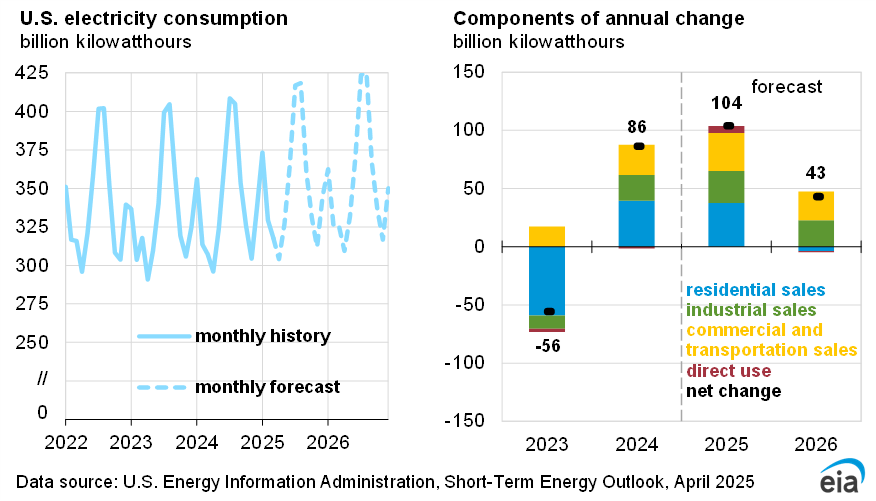
| U.S. electricity consumption | XLSX | PNG |
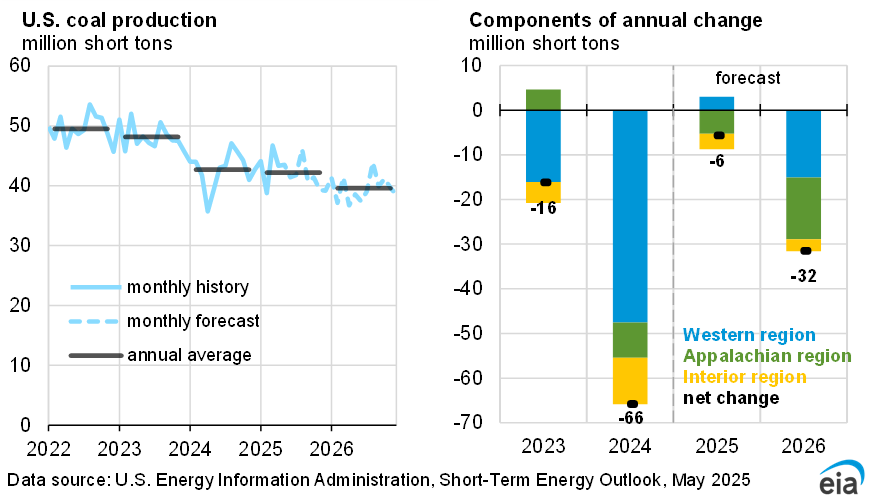
| U.S. coal production | XLSX | PNG |
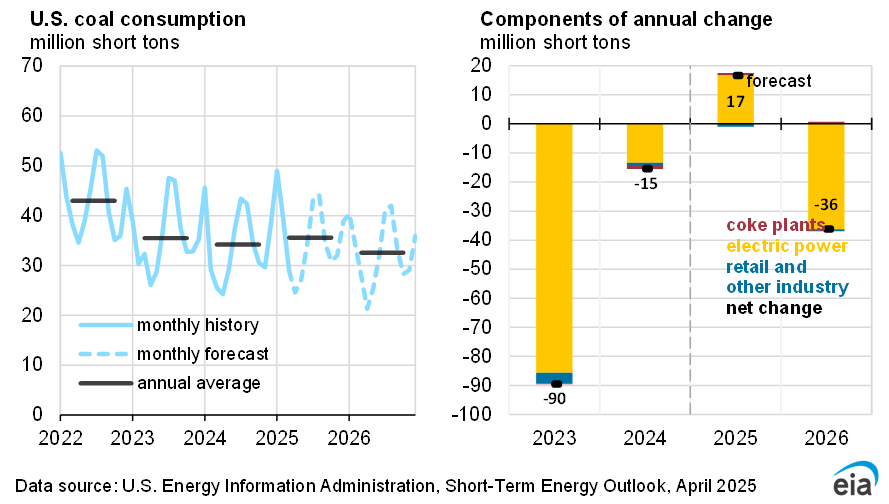
| U.S. coal consumption | XLSX | PNG |
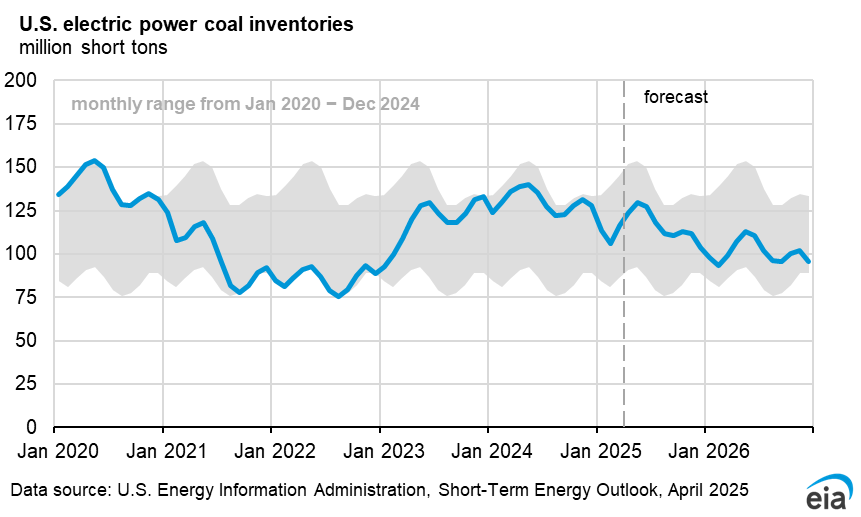
| U.S. electric power sector coal inventories | XLSX | PNG |
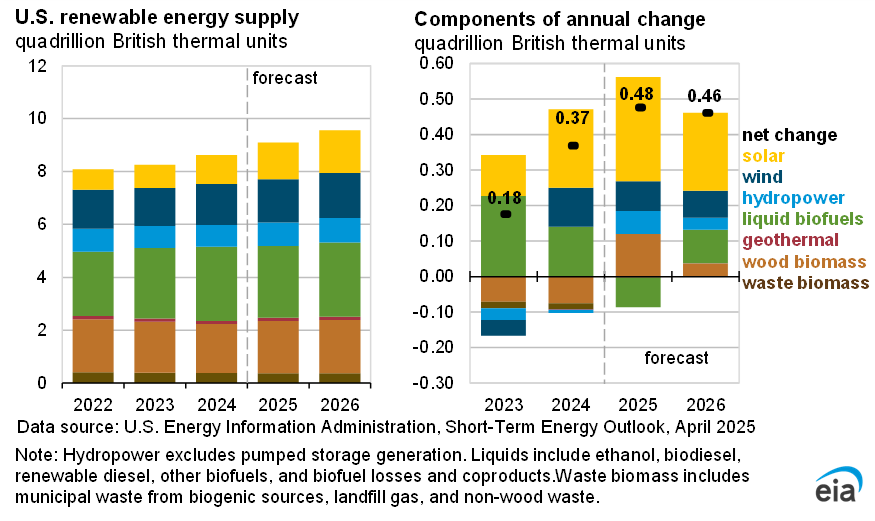
| U.S. renewable energy supply | XLSX | PNG |
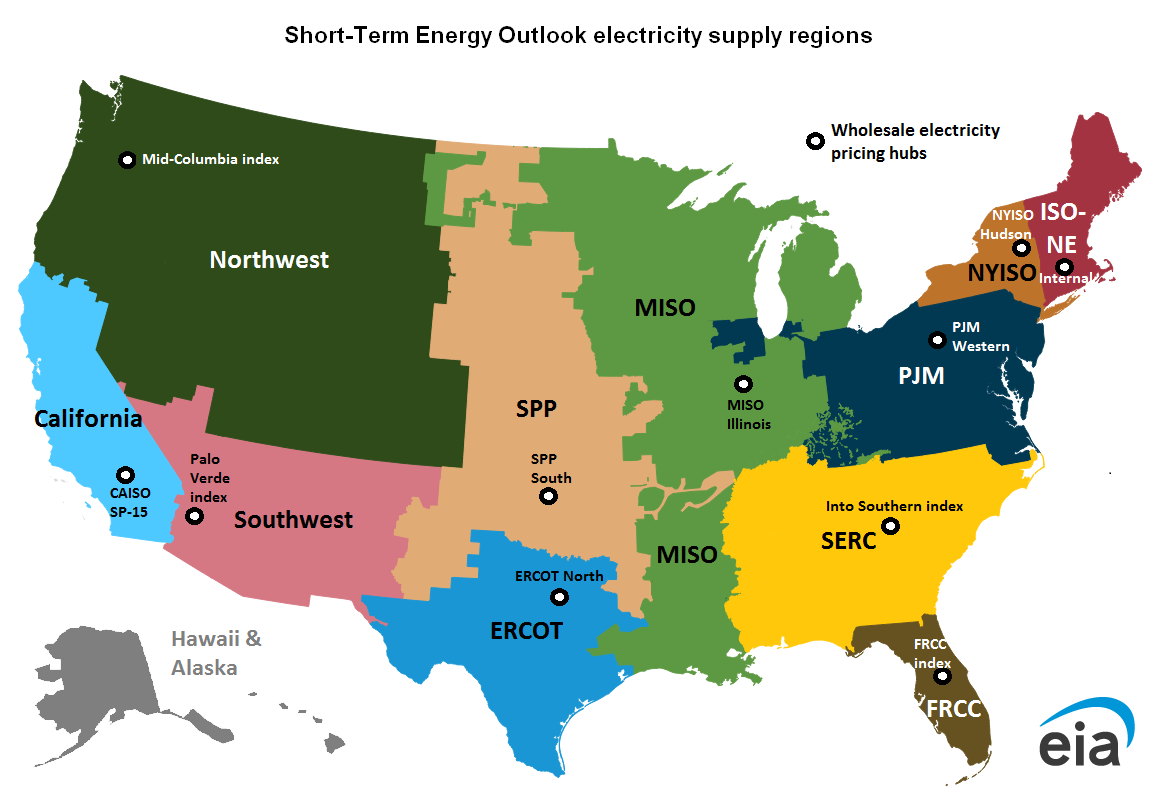
| U.S. STEO electricity supply regions | XLSX | PNG |
| Economy, weather, and CO2 | ||
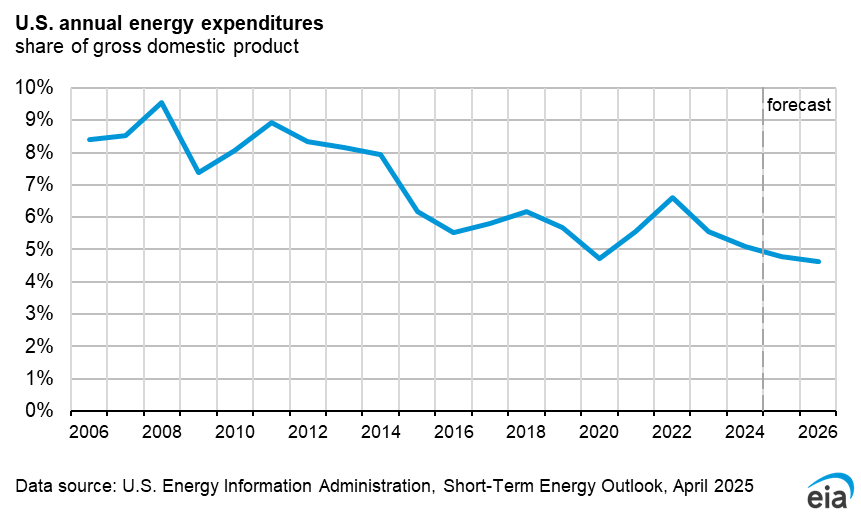
| U.S. annual energy expenditures share of gross domestic product | XLSX | PNG |
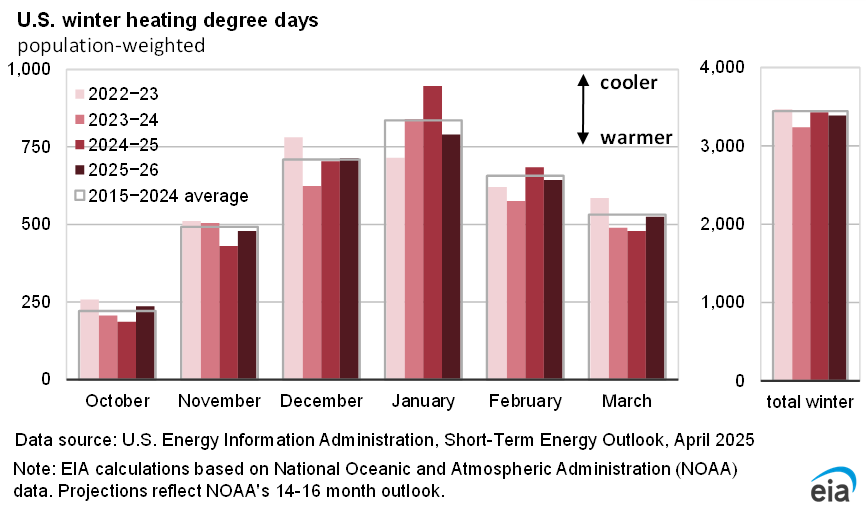
| U.S. winter heating degree days | XLSX | PNG |
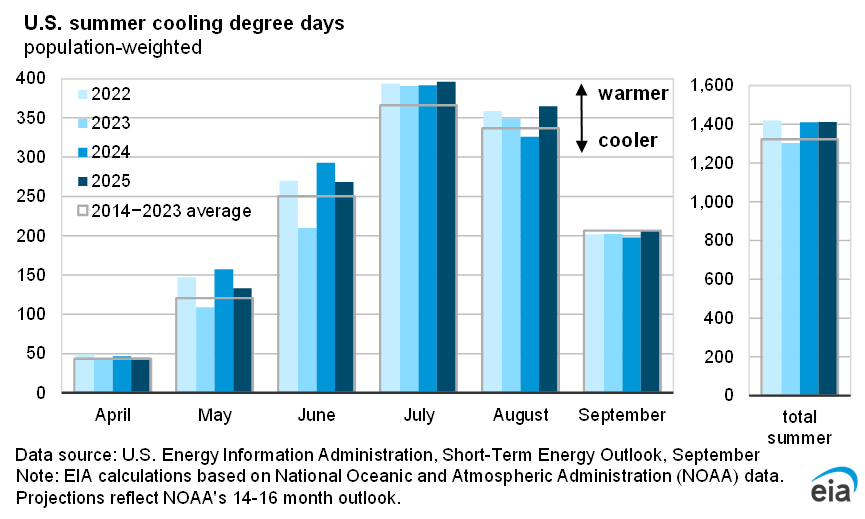
| U.S. summer cooling degree days | XLSX | PNG |
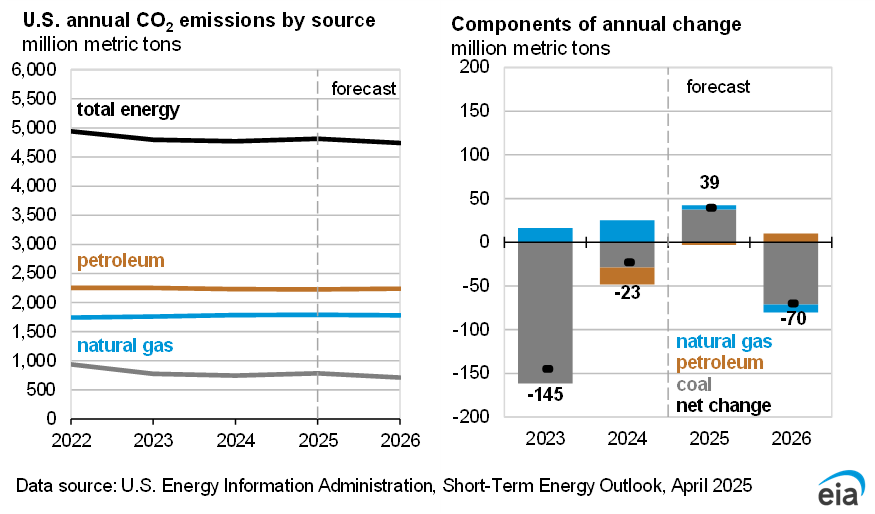
| U.S. carbon dioxide emissions growth | XLSX | PNG |
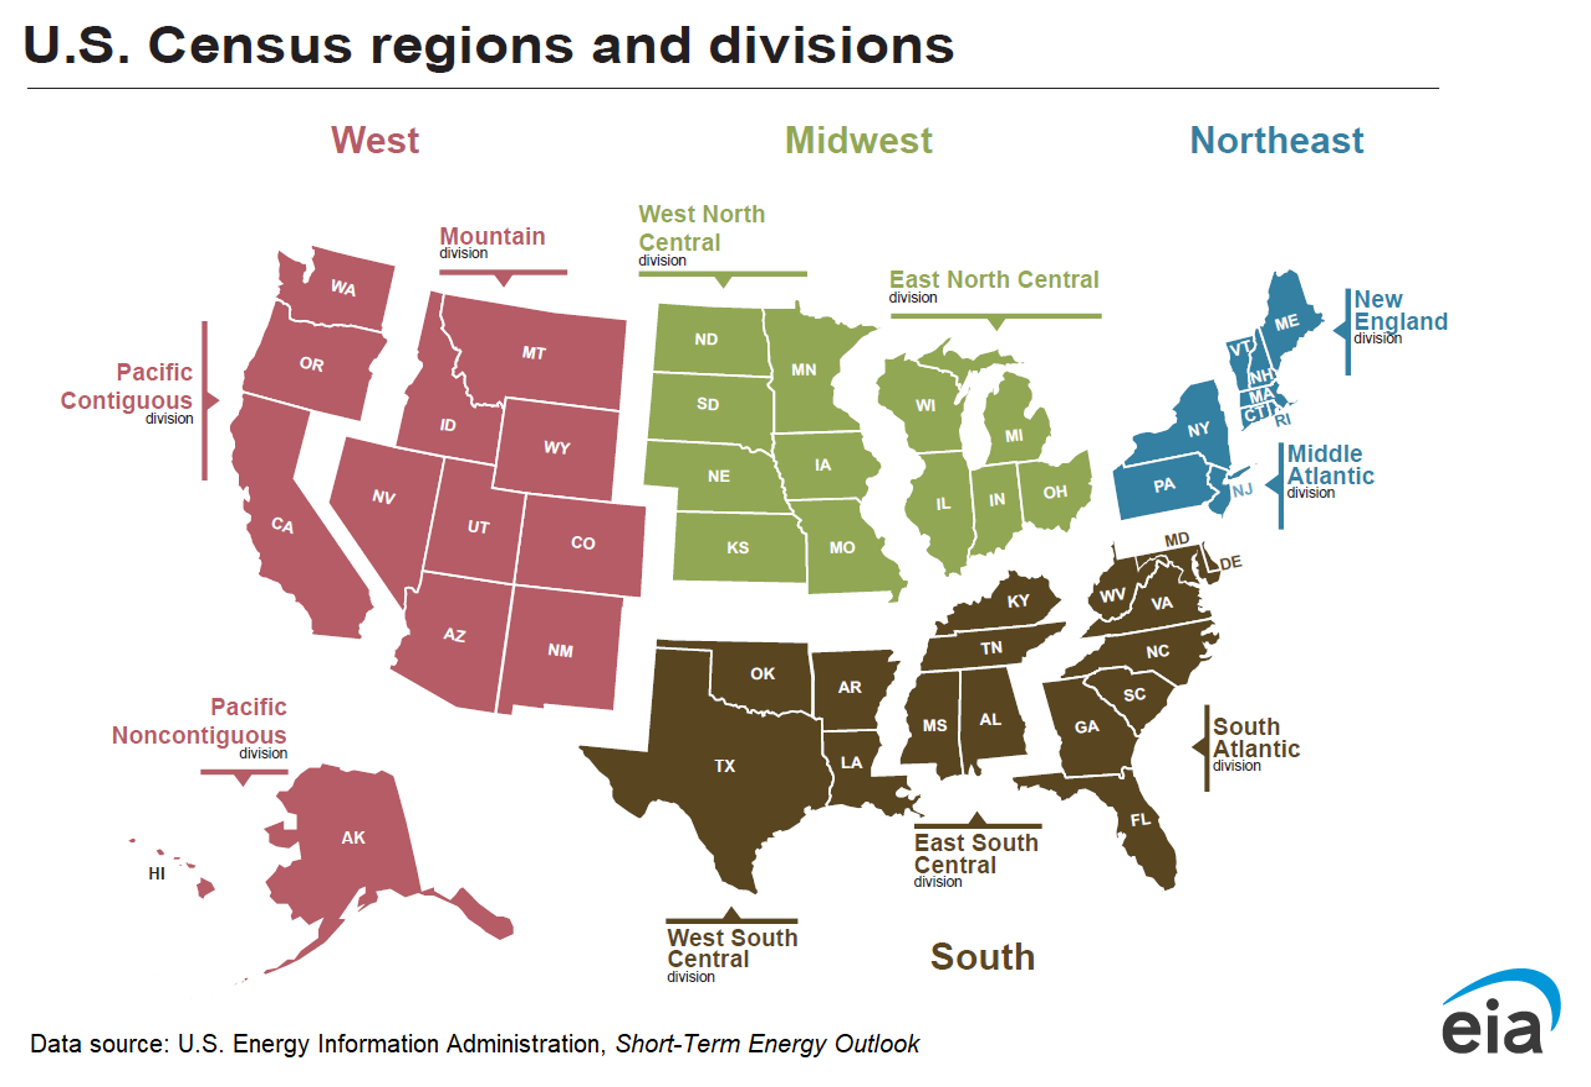
| U.S. Census regions and divisions | XLSX | PNG |