Economy, weather, and CO2
U.S. macroeconomics
To generate the macroeconomic assumptions in the Short-Term Energy Outlook (STEO), we input STEO energy price forecasts into S&P Global’s Short-Term U.S. Macroeconomic Model to produce a conditional macroeconomic forecast. For more details on the macroeconomic model, see our documentation.
Emissions
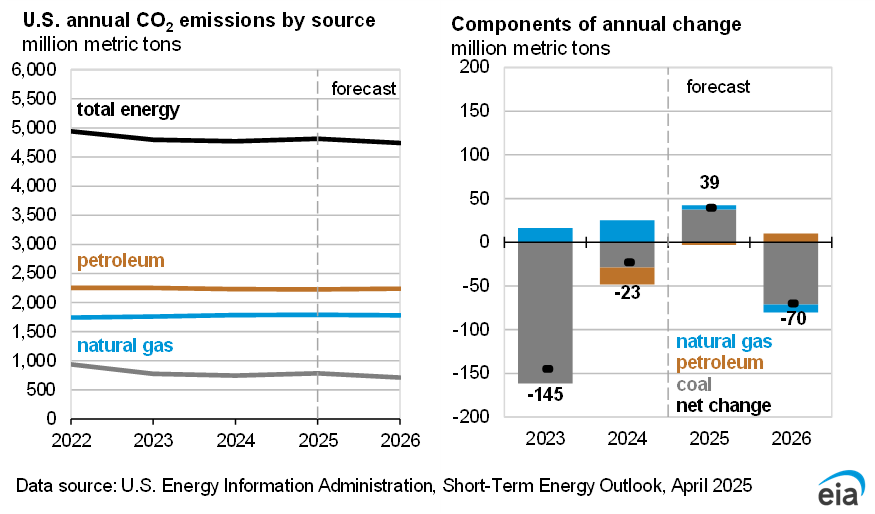
We forecast U.S. energy-related carbon dioxide (CO2) emissions to decrease by 1.7% in 2026 relative to 2025 and to increase by a 0.5% in 2027 relative to 2026. Our revised expectations for increasing natural gas consumption in both the electric power and industrial sectors are driving these changes.
Weather
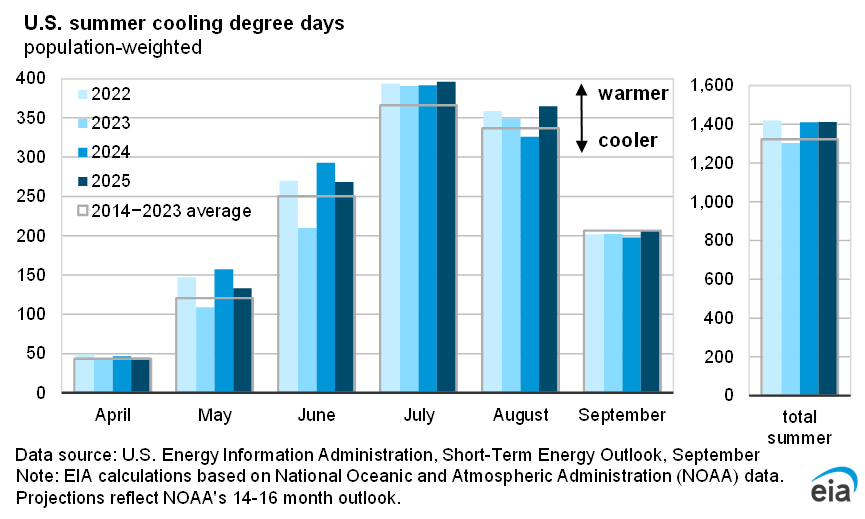
Our forecast assumes the United States will average 1,210 cooling degree days (CDDs) this summer (June–September), 2% more CDDs than both last summer and the 10-year average. Based on our current forecasts and most recent data from the National Oceanic and Atmospheric Administration, our forecast assumes the United States will average around 360 CDDs in July, 5% fewer CDDs than the 10-year average for the month. The East North Central and West North Central are set to have above-average temperatures in July while temperatures in the western part of the country are below normal in our forecast. As we finalized this month’s outlook, a heatwave was settling over the eastern United States, which has the potential to result in more CDDs in July than currently included in our forecast. We expect warmer weather in August and September, bringing the third-quarter average to around 940 CDDs, 4% more CDDs than in the same quarter a year ago.