U.S. Petroleum products
U.S. gasoline inventories
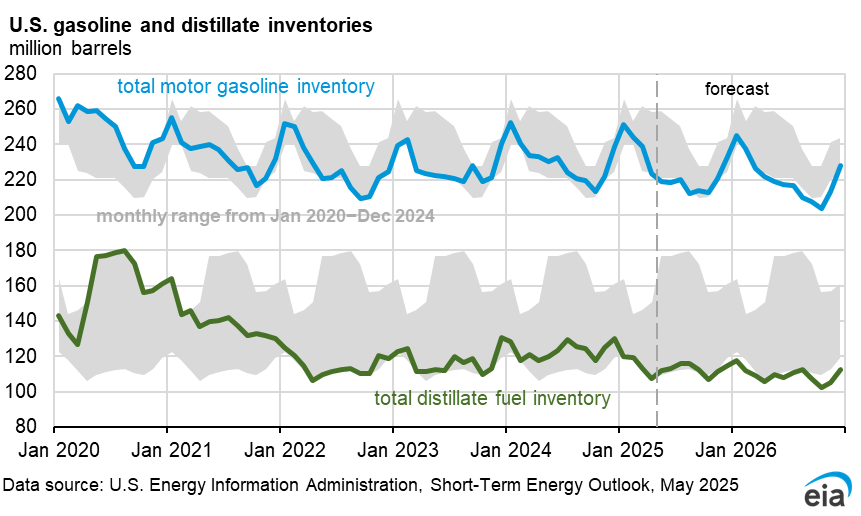
In April and May, gasoline inventories fell below the five-year (2021–2025) range as a result of lower gasoline production, fewer gasoline imports, and more gasoline exports. Refiners worked to maximize jet fuel production and maintain distillate production in response to high global demand. Net imports of gasoline also declined as U.S. exports out of the Gulf Coast rose sharply and imports into the East Coast from the Atlantic Basin fell after becoming more expensive.
We expect both increased production and increased net imports to contribute to greater availability of gasoline supplies, helping to stabilize inventories by the fourth quarter of this year, before reaching five-year averages early in 2027. In our forecast, this stabilization of inventory is enabled by refiners increasing gasoline yields in the second half of 2026 (2H26) and by greater gasoline supply from global markets.
We expect U.S. gasoline consumption in 2H26 to remain below the five-year average and fall below the five-year low during some months, as a result of higher gasoline prices and economic conditions. Relatively low consumption amid higher production and imports will all support growth in gasoline inventories through the end of the year.
U.S. gasoline prices
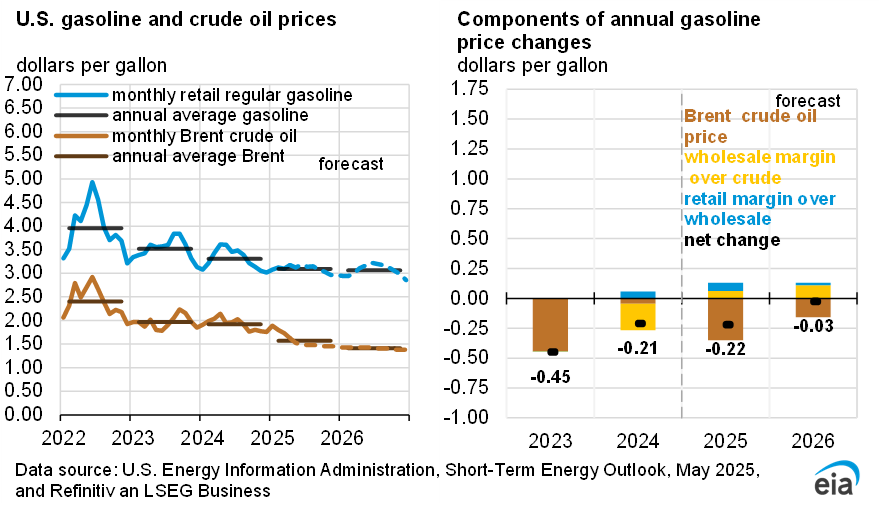
We expect lower crude oil prices will contribute to retail gasoline prices falling by about 41 cents/gal in the third quarter (3Q26) compared with 2Q26 and averaging just under $3.80 per gallon (gal). A decrease in crude oil prices contributes to a decrease of almost 50 cents/gal in quarter-on-quarter gasoline prices. However, this decrease is offset by increases in the wholesale and retail gasoline margins. Ongoing tightness in gasoline inventories will support the crack spread for gasoline—the difference between the wholesale price and the crude oil price—as we expect the wholesale price of gasoline will not fall as quickly as the price of crude oil. We estimate the gasoline crack spread will increase about 10 cents/gal on average in 3Q26.
We expect a similar increase in U.S. average regional retail and distribution margins—calculated as the difference between the retail and wholesale prices. Differences in the retail margin are likely to vary by region, depending on regional inventory levels and the relative access to imports or domestic transfers. Retail prices historically decrease more slowly than crude oil prices due to the more decentralized nature of retail markets, as well as ongoing uncertainty and the heightened risk environment of the global petroleum market. We expect competitive pressure will contribute to significantly narrower crack spreads in 4Q26 as inventories restock and the summer demand season comes to an end, bringing 4Q26 retail prices down to around $3.40/gal. We expect stable gasoline inventories, lower crude oil prices, and lower crack spreads to contribute to lower prices next year, with 2027 retail gasoline prices falling to an average close to $3.10/gal.