Wholesale Electricity and Natural Gas Market Data
The market data provided here are republished, with permission, from data collected by the Intercontinental Exchange (ICE) and are updated biweekly. Currently, electricity products can be traded at more than two dozen hubs and delivery points in North America, and natural gas products can be traded at more than 120 hubs. The data posted under EIA's agreement with ICE represent seven major electricity hubs and their corresponding natural gas trading hubs.
This market information includes daily volumes, high and low prices, and weighted-average prices. Natural gas historical data are available back to March 2014. The electricity historical data availability dates differ by hub. Mid–C, PJM West, SP15-1, Palo Verde, and Mass Hub have data from 2001. Indiana Hub has data from 2006. SP15-2 (SP15 Gen DA LMP) and NP15 have data from 2009. ERCOT North has data from 2014.
Electricity
- Current year (2026)
Electricity and Natural gas
- Historical (2014–2025)
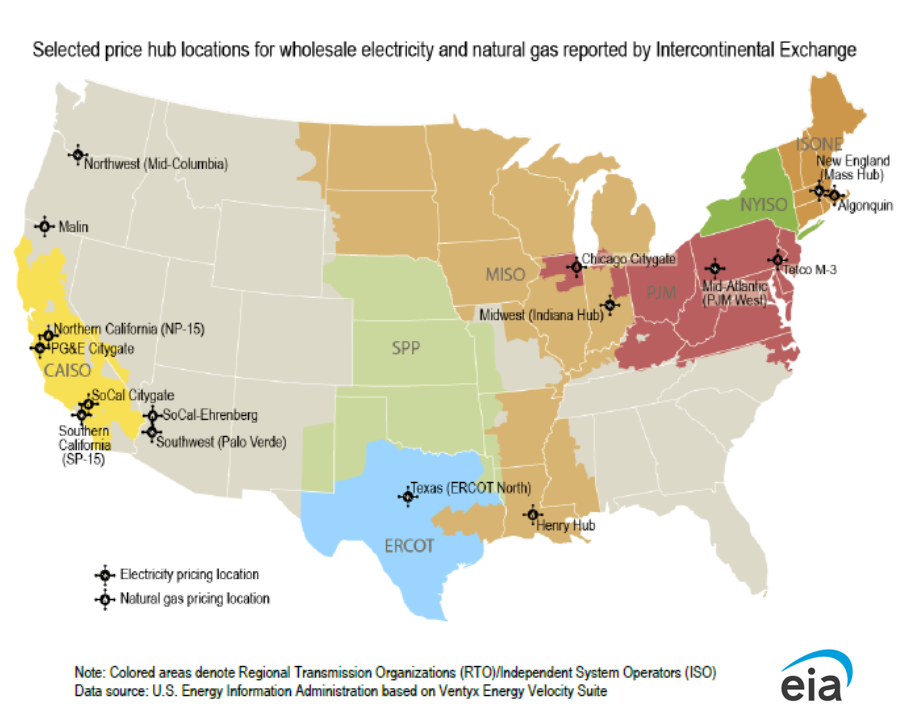
Selected hubs and wholesale daily spot price names
| Region | Electricity Hub Name | ICE Electricity Product Name | Natural Gas Hub Name | ICE Natural Gas Product Name | |
|---|---|---|---|---|---|
| New England | Mass Hub | Nepool MH DA LMP Peak (from 2001) | Algonquin | Algonquin Citygates | |
| PJM | PJM West | PJM WH Real Time Peak (from 2001) | TETCO-M3 | TETCO-M3 | |
| Midwest | Indiana Hub | Indiana Hub RT Peak (from 2006) | Chicago Citygates | Chicago Citygates | |
| Texas | ERCOT North | ERCOT North 345KV Peak (from 2014) | Henry Hub | Henry | |
| Northwest | Mid-C | Mid C Peak (from 2001) | Malin | Malin | |
| Northern California | NP-15 | NP15 EZ Gen DA LMP Peak (from 2009) | PG&E - Citygate | PG&E - Citygate | |
| Southwest | Palo Verde | Palo Verde Peak (from 2001) | Socal-Ehrenberg | Socal-Ehrenberg | |
| Southern California | SP-15 | SP15 Gen DA LMP Peak (from 2009) SP-15 Peak (2001 to 2009) |
Socal-Citygate | Socal-Citygate |
About the Intercontinental Exchange (ICE)
For prompt or "day ahead" markets in North American power, ICE is a major execution venue for over-the-counter (OTC) trading. These power indices are taken directly from transactions executed on the ICE platform. ICE's OTC participants are some of the world's largest energy companies, financial institutions, and other active members in the global commodity markets. Participants include refiners, power stations, utilities, chemical and transportation companies, banks and hedge funds, as well as other energy and financial industry professionals.
About the ICE data
For the power indices, all qualifying physical firm power contracts traded on ICE from 6:00 AM to 11:00 AM CST on the day of publication are included.
These data are published for each hub:
- Price hub: Location as defined in the ICE Product Guide
- Dates: Trade date and Delivery start and end dates
- High price: the absolute high price for the period
- Low price: the absolute low price for the period
- Wtd avg price: index of weighted average price
- Daily volume: total contracts traded for the period counting the sell side only
- Number of trades: number of trades confirmed through ICE and eConfirm that were used in the index calculation
- Number of counterparties: number of companies that participated in the index related transactions
Calculation of the weighted average prices (indices)
The power indices are developed using the following formula:
I = Σ (P • V) / T
where:
I = Volumetric Weighted Average Index Price,
P = price or premium of individual transaction,
V = volume of individual transaction,
∑(P • V) = sum of each transaction's price multiplied by its volume,
T = total volume of all qualifying transactions.
In addition to the price filters on the Intercontinental trading platform in accordance with their Fair Trading initiative, the following types of trades are considered "non-qualifying", and are not included in the indices:
- Trades done between two companies that are owned by the same parent company
- Price basis spread legs, i.e. spread trades that are executed on a trading platform that subsequently are converted into two outright prices for trade reporting purposes
- Deals that have been consummated but then cancelled or altered by the counterparties before confirmation
- Trades where counterparties reverse a trade within two minutes of the previous transaction
- Option Trades Deals that fall outside of the given time period for each index
| Year | Electricity | Natural gas |
|---|---|---|
| 2025 | xls | |
| 2024 | xls | |
| 2023 | xls | 2022 | xls |
| 2021 | xls | |
| 2020 | xls | |
| 2019 | xls | |
| 2018 | xls | |
| 2017 | xls | xls |
| 2016 | xls | xls |
| 2015 | xls | xls |
| 2014 | xls | (3/17 thru 12/31) |
| 2001 thru 12/31/2013 | zip | -- |