Overview
Energy-related carbon dioxide (CO2) emissions vary significantly across states, whether considered on an absolute basis (Figure 1) or on a per capita basis (Figure 2). Total state CO2 emissions include those from direct fuel use across all sectors, including residential, commercial, industrial, and transportation, as well as primary fuels consumed for electricity generation.
The physical size of a state, as well as the available fuels, types of businesses, climate, and population size and density, all play a role in determining the level of total and per capita emissions. In addition, each state’s energy system reflects circumstances specific to that state. For example, some states have abundant hydroelectric supplies, and others contain abundant coal resources.This paper examines the factors that contribute to a state’s CO2 profile. The analysis does not attempt to assess the effect of state policies on absolute emissions levels or on current and future trends, nor does it intend to imply that certain policies would be appropriate for a particular state.
The term energy-related CO2 emissions, as used in this analysis, refers to emissions released at the location where fossil fuels are consumed. To the extent that fuels are used in one state to generate electricity consumed in another state, emissions are attributed to the state in which the electricity is generated and fuels are combusted. Attributing emissions to the state consuming the electricity, rather than the state where it is generated, would yield different results. For feedstock uses of fossil fuels, carbon stored in products such as plastics is allocated to the states where the petrochemicals are produced.
The calculations presented in this paper also assume that biomass used by electricity generators, by industries, and by homes and commercial buildings is carbon neutral, with combustion emissions fully offset by land sinks in a sustainable biomass cycle. Emissions may be underestimated to the extent that actual use of biomass energy may not be carbon neutral.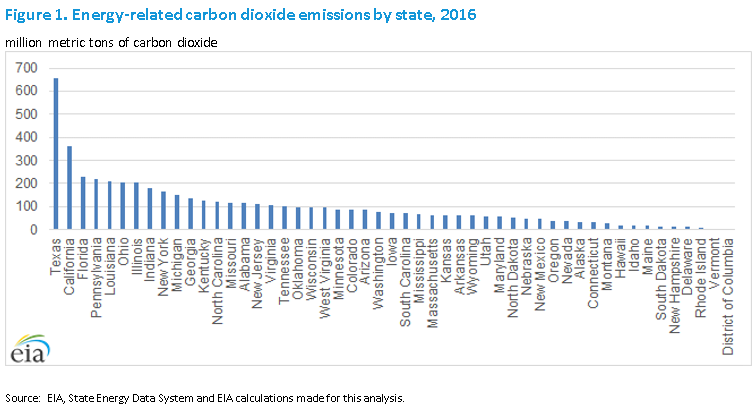
Total state emission levels
In the period from 2005 to 2016, energy-related CO2 emissions fell in 41 states and rose in 9 states (not including the District of Columbia) (Table 1). The largest percentage decrease during that period was Maryland’s 30%—a drop of 24 million metric tons (MMmt)—and the greatest absolute decline was 64 MMmt in Ohio (a 24% decrease). The largest percentage increase during that period was Idaho’s 16% (3 MMmt). Texas, however, experienced the largest absolute increase between 2005 and 2016—52 MMmt (9%). The factors that led to these trends vary by state. In Ohio, for example, during the same period, coal-related CO2 emissions from the electric power sector declined by about 62 MMmt. During this period, the Ohio economy grew in total by less than 8%. In Texas, coal emissions from the electric power sector declined by about 23 MMmt between 2005 and 2016, but the economy grew by almost 42% during that period—and much of this growth was from energy-intensive energy production and petroleum refining.
From 2015 to 2016, 36 states saw a decrease in energy-related CO2 emissions, while 14 experienced an increase. During that period, national emissions decreased by almost 2%. Because of differences in how the national and state data sets are calculated, the total for all states is not the same as the total for the United States. This year, an adjustment factor was introduced to match the total for the United States. This factor is distributed to the states in proportion to each state’s share of the total—see Table 2 for the adjusted values by state. See Appendix A for a comparison of the state- and national-level data used for this analysis. The analysis that appears in this report relied on the unadjusted valuesEmissions by fuel
States exhibit very different emissions profiles because of varying fuel types (Table 3). For example, in 2016, coal consumption accounted for 75% of energy-related CO2 emissions in West Virginia (71 MMmt) and 71% of Wyoming’s energy-related CO2 emissions (43 MMmt). In California, where less than 1% of CO2 emissions came from coal (3 MMmt), 66% came from petroleum (239 MMmt). In Rhode Island, which had no emissions from coal, 52% of CO2 emissions were from petroleum (5 MMmt). Hawaii’s and Vermont’s shares of CO2 emissions from petroleum in 2016 were 92% (17 MMmt) and 89% (5 MMmt), respectively. Maine’s petroleum share was 81% (13 MMmt).
In six states, coal emissions made up more than half of total emissions. These six states rely on coal for electric power generation. Petroleum accounted for more than half of emissions in 17 states. Many of these states are dominated by petroleum emissions from the transportation sector, although states such as Louisiana also have a sizable industrial component of their petroleum emissions. Natural gas accounted for more than half of emissions only in Alaska (mainly industrial) and the District of Columbia (buildings). Many states, Alabama for example, have energy-related CO2 emissions that are more or less evenly distributed across fuels.
Emissions by sector
CO2 emissions also vary across states significantly by sector (Tables 4 and 5), based on factors such as the use of different fuels for electricity generation, different climates, and different sources of economic outputs (e.g., commercial versus industrial activity). For example, in Vermont, the largest share of emissions in 2016 came from the transportation sector (57%, or 3 MMmt), predominantly from petroleum, while the electric power sector share rounded to 0.0% because Vermont had virtually no reported generation using fossil fuels. Vermont’s residential sector share of 22%, or slightly more than 1 MMmt, reflected its relatively cold climate where petroleum is the main heating fuel. On the other hand, Hawaii, where a dominant share of emissions is also from petroleum, had a residential share that rounds to zero, which was the lowest in the United States because of its minimal heating fuel requirements. The largest sector emissions share in Hawaii, like Vermont, was from the transportation sector (55%, or 10 MMmt). However, unlike Vermont, Hawaii’s electric power sector share was relatively high (36%, or 7 MMmt) because petroleum is the dominant fossil fuel for generating electricity in Hawaii.
Only in the District of Columbia do combined residential and commercial sector building emissions make up more than half of total emissions. Louisiana is the only state where industrial sector emissions make up more than half of the total—dominated by high energy consuming refineries and petrochemical plants. The states with other dominant sectors (greater than half of emissions) are about evenly split—seven of these states have the electric power as the dominant sector and eight of these states have the transportation sector dominating. Those states where the electric power sector has the largest share of CO2 emissions are coal-generating states, and those states where the transportation sector has the largest share of CO2 emissions tend to use noncarbon or low-carbon fuels for electricity generation and petroleum used in the transportation sector is the main producer of energy-related CO2.
Per capita carbon dioxide emissions
Another useful way to compare total CO2 emissions across states is to divide them by state population and examine them on a per capita basis (Table 6 and Figure 2). Many factors contribute to variation in the amount of emissions per capita, including climate, the structure of the state economy, population density, energy sources, building standards, and explicit state policies to reduce emissions. The 2016 CO2 emissions in Wyoming were 104 metric tons (mt) per capita, the highest in the United States. In 2016, Wyoming was the third-largest energy producer in the United States. Unlike the largest energy producer, Texas—with a population of 28 million—and the second-largest energy producer, Pennsylvania—with a population of 13 million—Wyoming has fewer than 600,000 people, giving Wyoming the lowest population density in the Lower 48 states.[1] Its winters are cold (the average low temperatures in January range between 5 degrees to 10 degrees Fahrenheit[2]). These factors raise Wyoming’s per capita energy-related CO2 emissions compared with other states. The second-highest state per capita CO2 emissions level was North Dakota at 72 mt per capita. West Virginia (52 mt per capita), Alaska (47 mt per capita), and Louisiana (45 mt per capita) round out the five states with the highest per capita CO2 emissions.
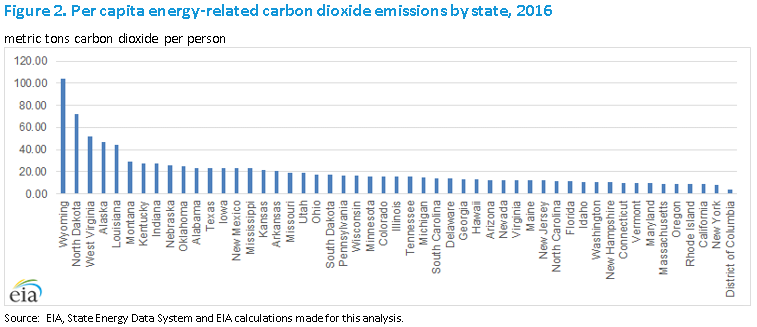
New York, with a population of almost 20 million people, had the lowest per capita CO2 emissions of any state—about 8 mt per capita. A large portion of the population is located in the New York City metropolitan area, where mass transit is readily available and most residences are multi-family units that provide efficiencies of scale in terms of energy used for heating and cooling. The New York economy is oriented toward low energy-consuming activities (e.g., financial markets). Consequently, New York accounted for about 6% of the U.S. population in 2016, but it consumed only 1% of the country’s industrial energy[3]. New York’s energy prices are relatively high (the average retail electricity price of 14.47 cents per kWh compared to a U.S. average of 10.27 cents per kWh in 2016), which, in turn, encourages energy efficiency. Other states with fewer than 9.5 mt per capita of energy-related CO2 emissions include California, Massachusetts, Oregon, and Rhode Island. The national average is 16 mt per capita.
Energy intensity
The energy intensity of a state, as measured by the amount of energy consumed per unit of economic output or, specifically, British thermal units (Btu) per dollar of a state’s gross domestic product (GDP), plays an important role in its overall emissions profile (Table 7). The states with relatively high energy intensities tend to be in cold climates and rural or have a large industrial base relative to their overall economy. The states with the highest rates of energy-related CO2 emissions per capita in 2016 also tended to have higher energy-intensity values: Wyoming (24,000 Btu per chained 2009 dollar of GDP), Louisiana and West Virginia (both 19,000 Btu per dollar), North Dakota (16,000 Btu per dollar), and Montana and Alabama (both about 14,000 Btu per dollar). California, Connecticut, Maryland, Massachusetts, and New York were the lowest—each at about 3,000 Btu per dollar.
Many of the states with the lowest energy intensities are clustered in the relatively densely populated New England and Middle Atlantic regions. The 2016 national average was 6,000 Btu per dollar of GDP.
Carbon intensity of the energy supply
The carbon intensity of energy supply (CO2/Btu) reflects the energy fuel mix within a state (Table 8). As with energy intensity, the states with a higher carbon-intensive energy supply tend to be the states with high per capita emissions. The states with the most carbon-intensive energy supply as measured in kilograms of CO2 per million Btu (kg CO2/MMBtu) were
- West Virginia (79 kg CO2/MMBtu)
- Wyoming (76 kg CO2/MMBtu)
- Kentucky (72 kg CO2/MMBtu)
- Utah (69 kg CO2/MMBtu)
- Indiana, Missouri, and North Dakota (all about 68 kg CO2/MMBtu)
In all of these states, coal was the dominant emissions source (Table 3). The national average carbon intensity of the energy supply in 2016 was 54 kg CO2/MMBtu. The states with a lower carbon-intensive energy supply tend to be those states with relatively substantial non-carbon electricity generation from sources such as nuclear or hydropower. These states included
- Washington and Oregon (both 35 kg CO2/MMBtu)
- New Hampshire (36 kgCO2/MMBtu)
- Vermont (39 kg CO2/MMBtu)
- Maine, South Carolina, and South Dakota (all 41 kg CO2/MMBtu)
Carbon intensity of the economy
Another measure, the overall carbon intensity of the economy (CO2/dollar of state GDP), combines energy intensity with the carbon intensity of that state’s energy supply. As expected, the states with the highest carbon intensity of their economies (Table 9) as measured in mt of CO2 per million dollars of state GDP (mt CO2/million chained 2009 dollars of GDP) are also the states with the highest values of energy intensity and carbon intensity of that energy supply. In 2016, these states included
- Wyoming (1,748 mt CO2/million dollars of GDP)
- West Virginia (1,430 mt CO2/million dollars of GDP)
- North Dakota (1,118 mt CO2/million dollars of GDP)
- Louisiana (1,004 mt CO2/million dollars of GDP)
- Alaska (744 mt CO2/million dollars of GDP)
The 2016 U.S. average was 309 mt CO2/million dollars of GDP. The states with the lowest carbon intensity of economic activity are also states that appear on the lower end of both energy intensity and the carbon intensity of that energy supply. These states included
- New York (128 mt CO2/million dollars of GDP)
- Massachusetts (144 mt CO2/million dollars of GDP)
- Connecticut (152 mt CO2/million dollars of GDP)
- California (156 mt CO2/million dollars of GDP)
- Maryland (171 mt CO2/million dollars of GDP)
Electricity trade
This analysis assigns all emissions related to the primary energy consumed for the production of electricity to the state where that electricity was produced rather than where it was consumed. As a result, the states that produce electricity from fossil fuels (especially coal) and sell that electricity across state lines tend to have higher per capita CO2 emissions than states that consume more electricity than they produce. If the emissions associated with the generation of electricity were allocated to the states where that electricity was consumed, the emissions profiles of both the producing and consuming states would be different in many cases.
In an index of net electricity trade, a value greater than 1.0 indicates a net interstate exporter of electricity, a value less than 1.0 indicates a net interstate importer of electricity, and a value equal to 1 indicates self-sufficient electricity generation on a statewide basis. For example Wyoming has had an index value of 2.5 or higher for most years since 2005 (Table 10). This rating means that one and a half times or more of the electricity generated and consumed in the state was sent across state lines. Idaho, on the other hand, only generated about 60% of its own electricity from 2012–16. Only 3 of the top 10 states for energy-related CO2 per capita emissions (Alaska, Louisiana, and Oklahoma) use natural gas as the primary source of electricity generation. The other seven states use coal as the primary fuel. None of the states with the lowest per capita emissions generate electricity with coal as the primary fuel. Half of those states generate electricity with a non-carbon source and the other half with natural gas as the primary fuel source. Of those states with the lowest per capita CO2, only Vermont has been a significant electricity exporter in recent years.
Non-carbon energy
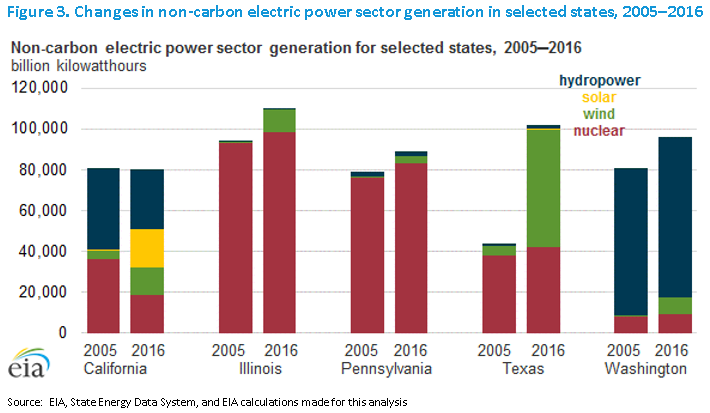
Traditionally, the primary non-carbon-producing energy forms have been nuclear and hydroelectric generation. Neither energy form has experienced significant capacity growth in the United States in recent years. More recently, nonhydropower renewable energy forms such as wind and solar have experienced significant growth during the past decade, which has changed the non-carbon generation profile of several states. These energy forms have been supported by state policies such as Renewable Portfolio Standards as well as federal policies such as production and investment tax credits. These policies have, in turn, subsidized these generation investments to make them more competitive with more established forms of electricity generation.
Although California increased its electricity generated by wind and solar between 2005 and 2016 (Figure 3), generation from hydropower and nuclear fell between 2005 and 2016. In total, California non-carbon electricity generation fell slightly from 81 billion kilowatthours (kWh) in 2005 to 80 billion kWh in 2016. Illinois increased its nuclear output from existing nuclear capacity while adding wind capacity and in 2016. Illinois produced 109 billion kWh from non-carbon generation sources. Pennsylvania experienced a pattern similar to that in Illinois. In contrast, Texas more than doubled its non-carbon generation output during that period, from 44 billion kWh in 2005 to 102 billion kWh in 2016. This doubling resulted from a stable level of nuclear generation and additions of wind capacity. Washington State has always relied heavily on hydropower generation and has added wind capacity to its generation mix, which helped it achieve 96 billion kWh of non-carbon electric generation in 2016.
See Appendix B for other EIA state-related energy and environmental products.
Footnotes
1. U.S. Energy Information Administration, State Profiles and Energy Estimates: https://www.eia.gov/state/.
2.https://wrcc.dri.edu/narratives/WYOMING.htm.
3. U.S. Energy Information Administration, State Energy Data 2016, state population and energy consumption by sector.https://www.eia.gov/state/seds/
4. U.S. Energy Information Administration, State Electricity Profiles, Table 1, 2016 Summary Statistics from archive. https://www.eia.gov/electricity/state/newyork/.