Underground Natural Gas Working Storage Capacity
Overview
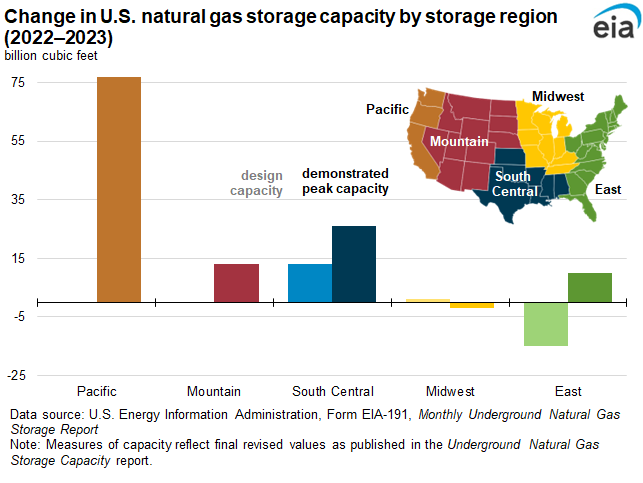
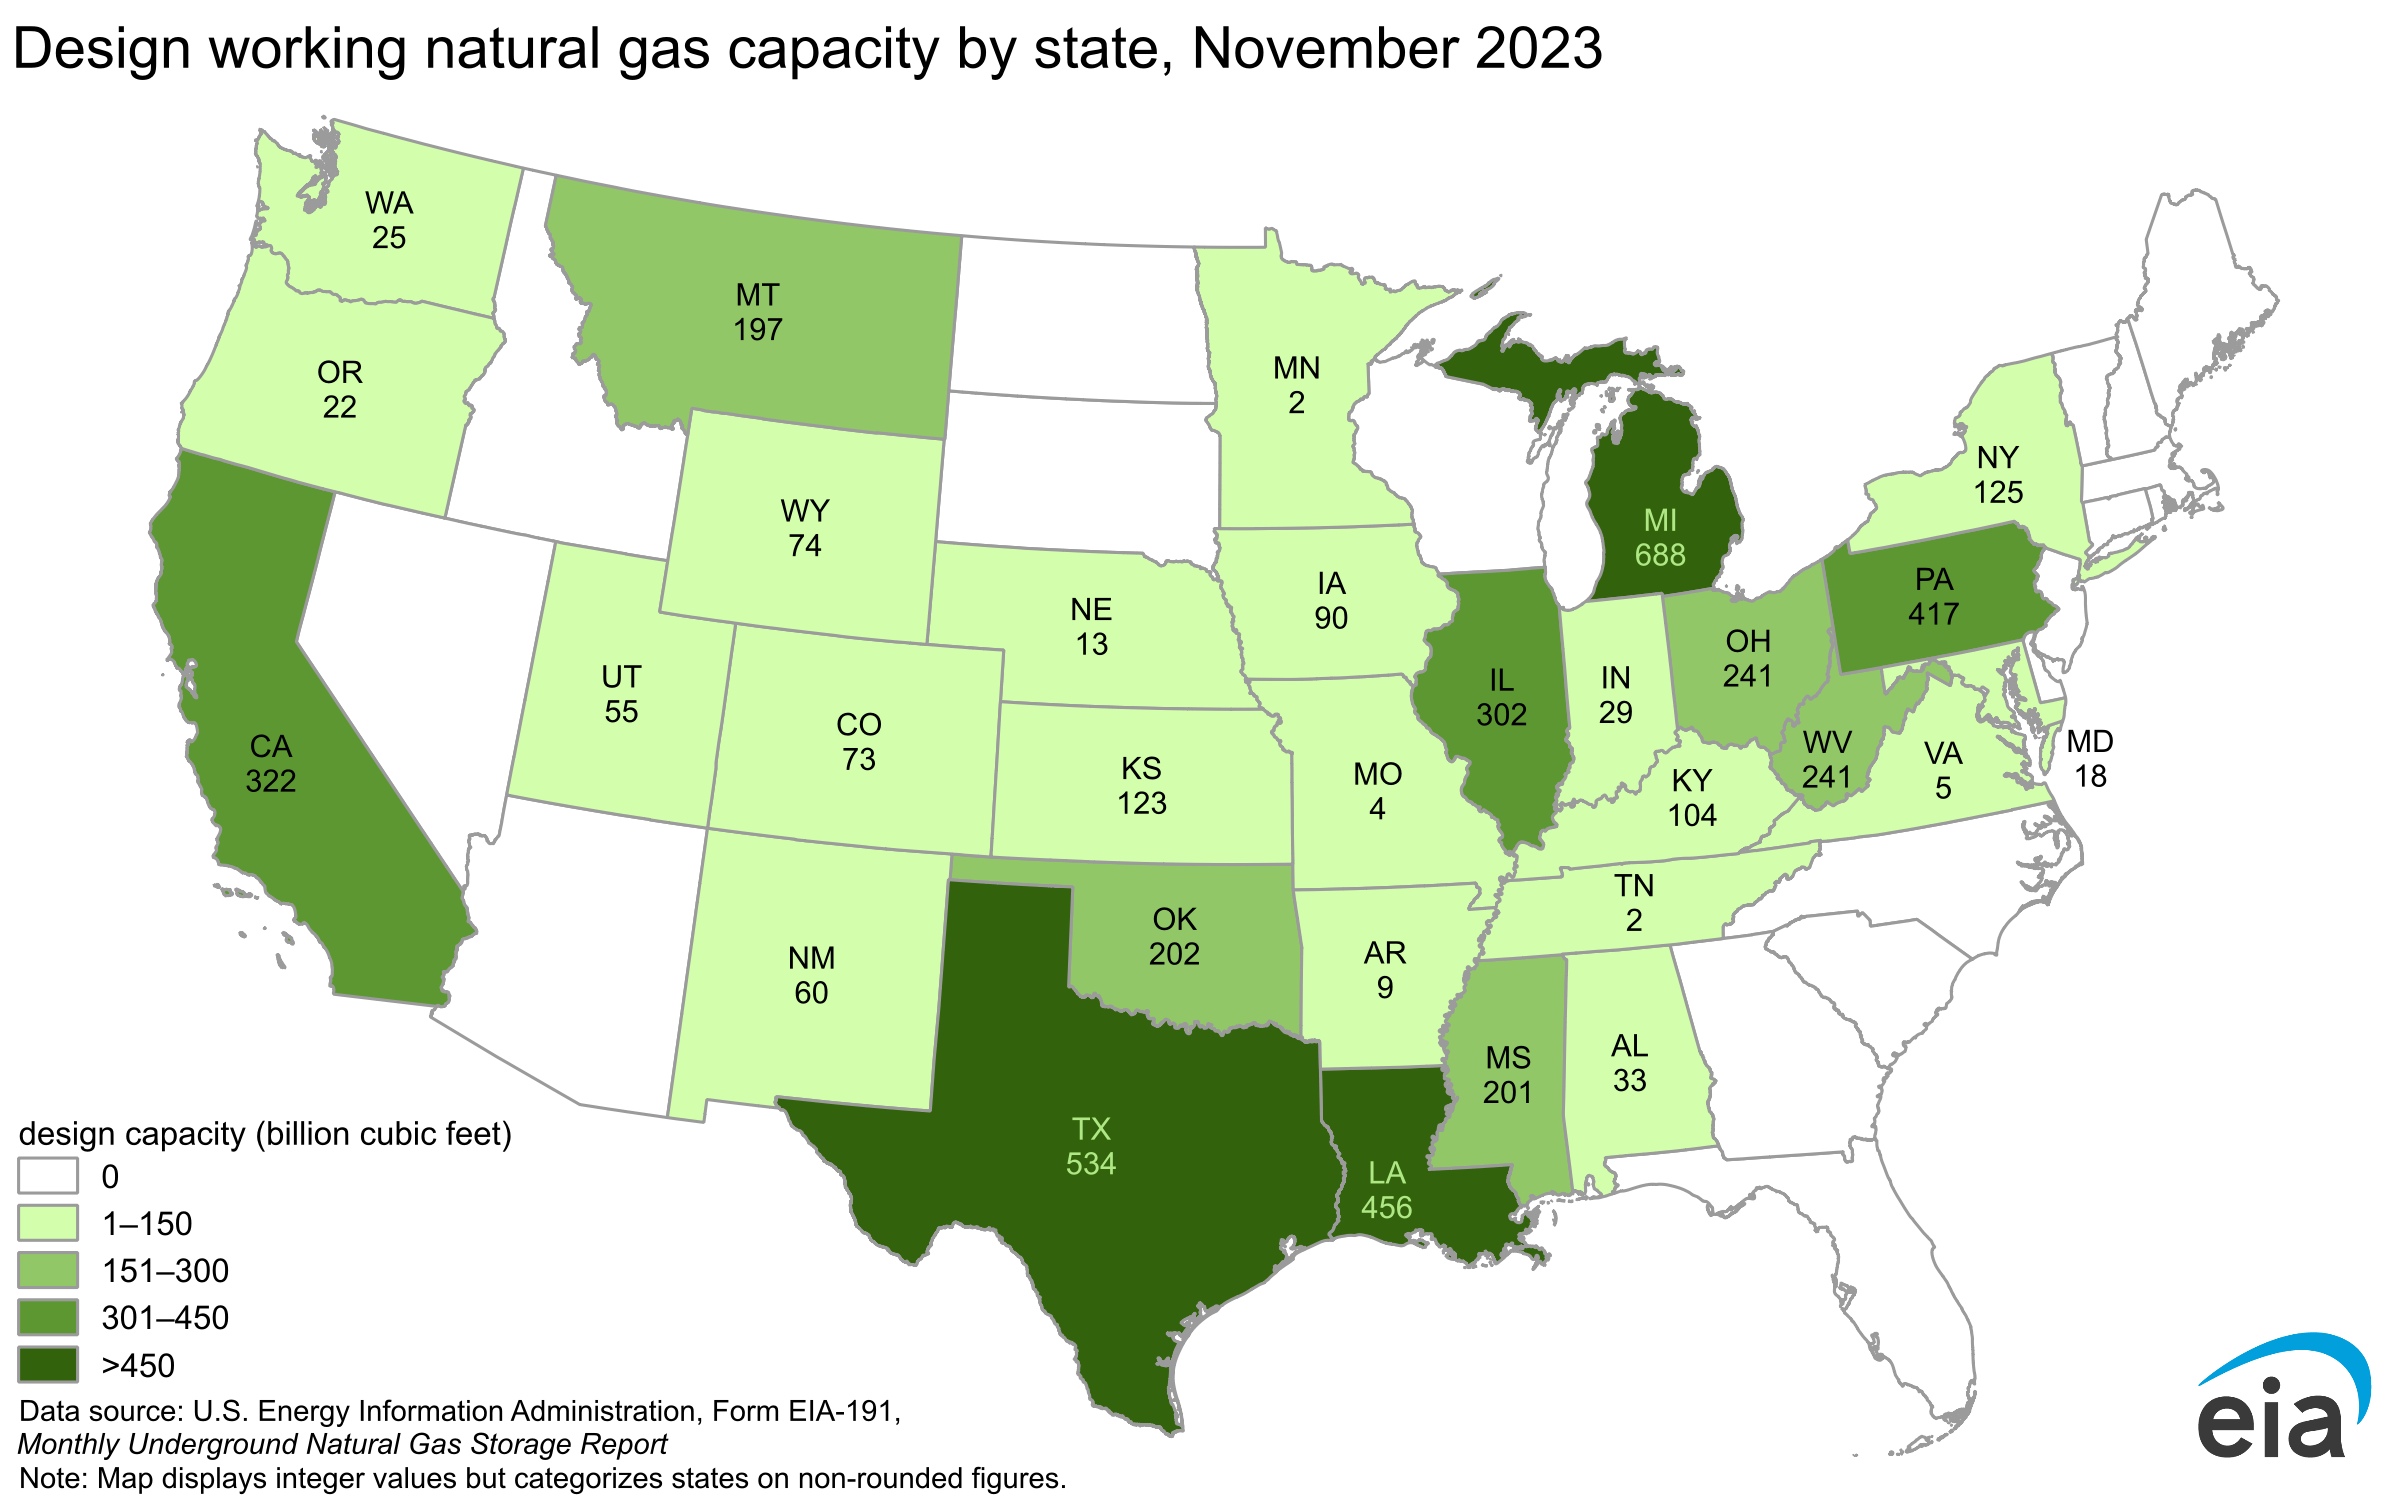
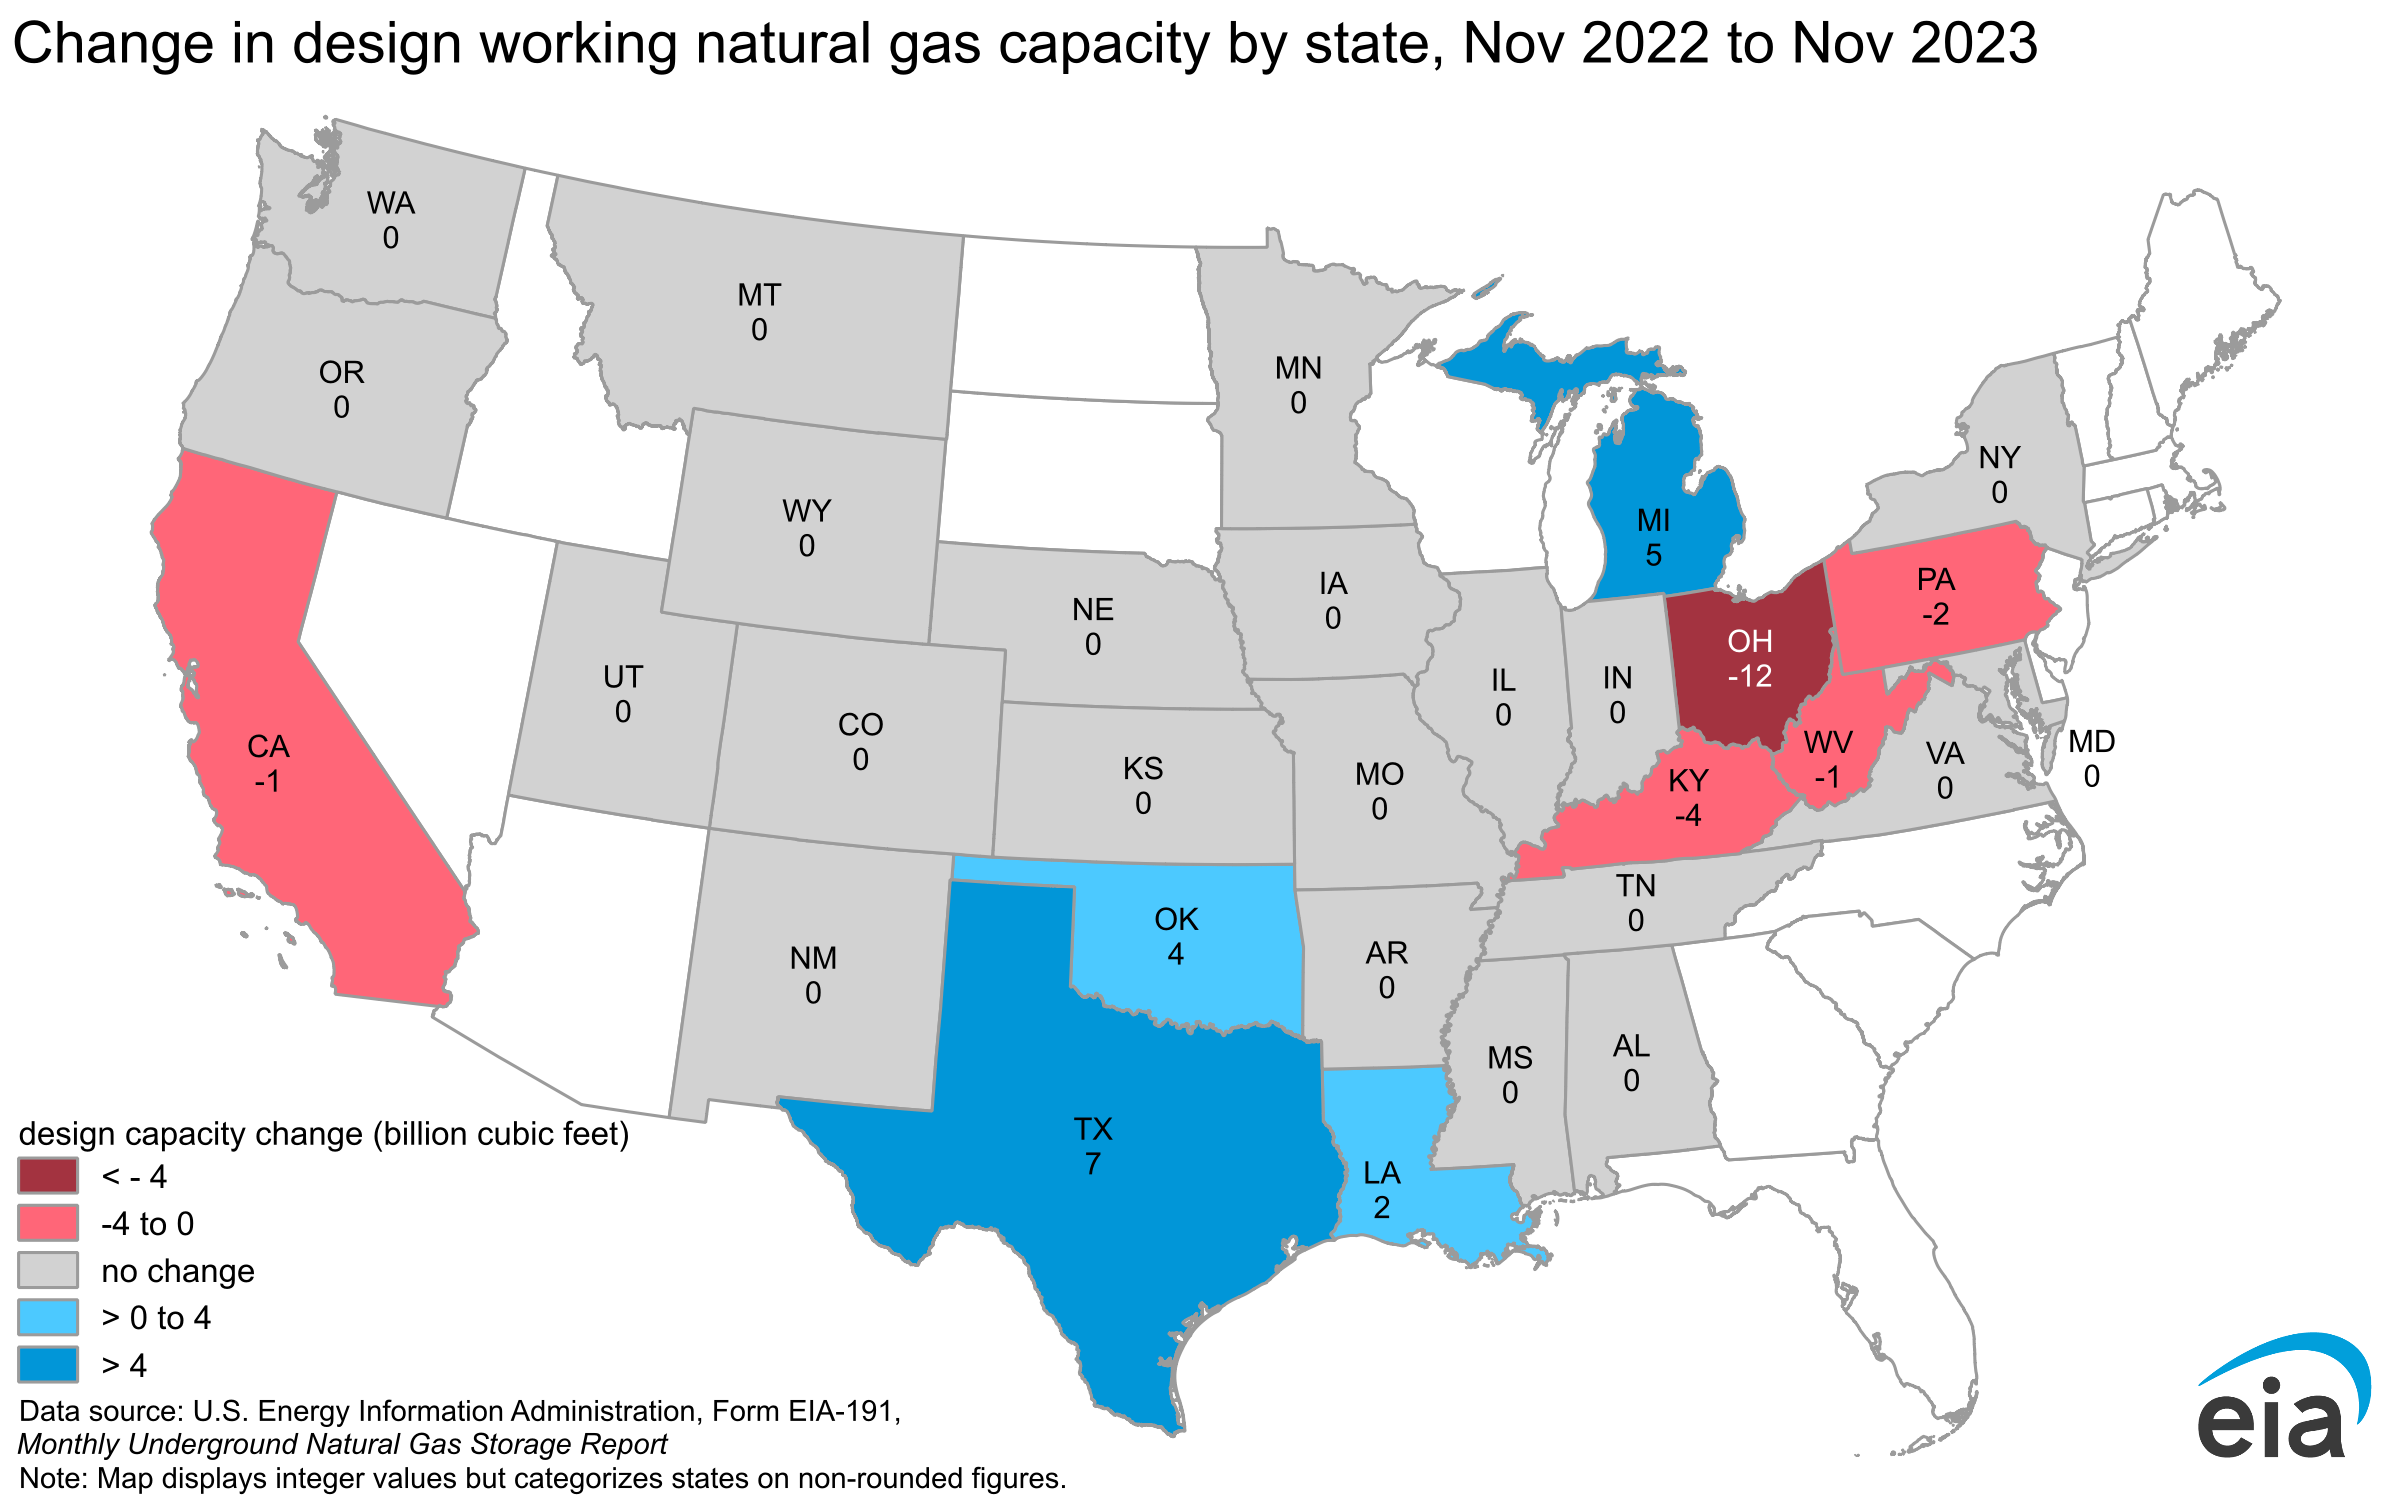
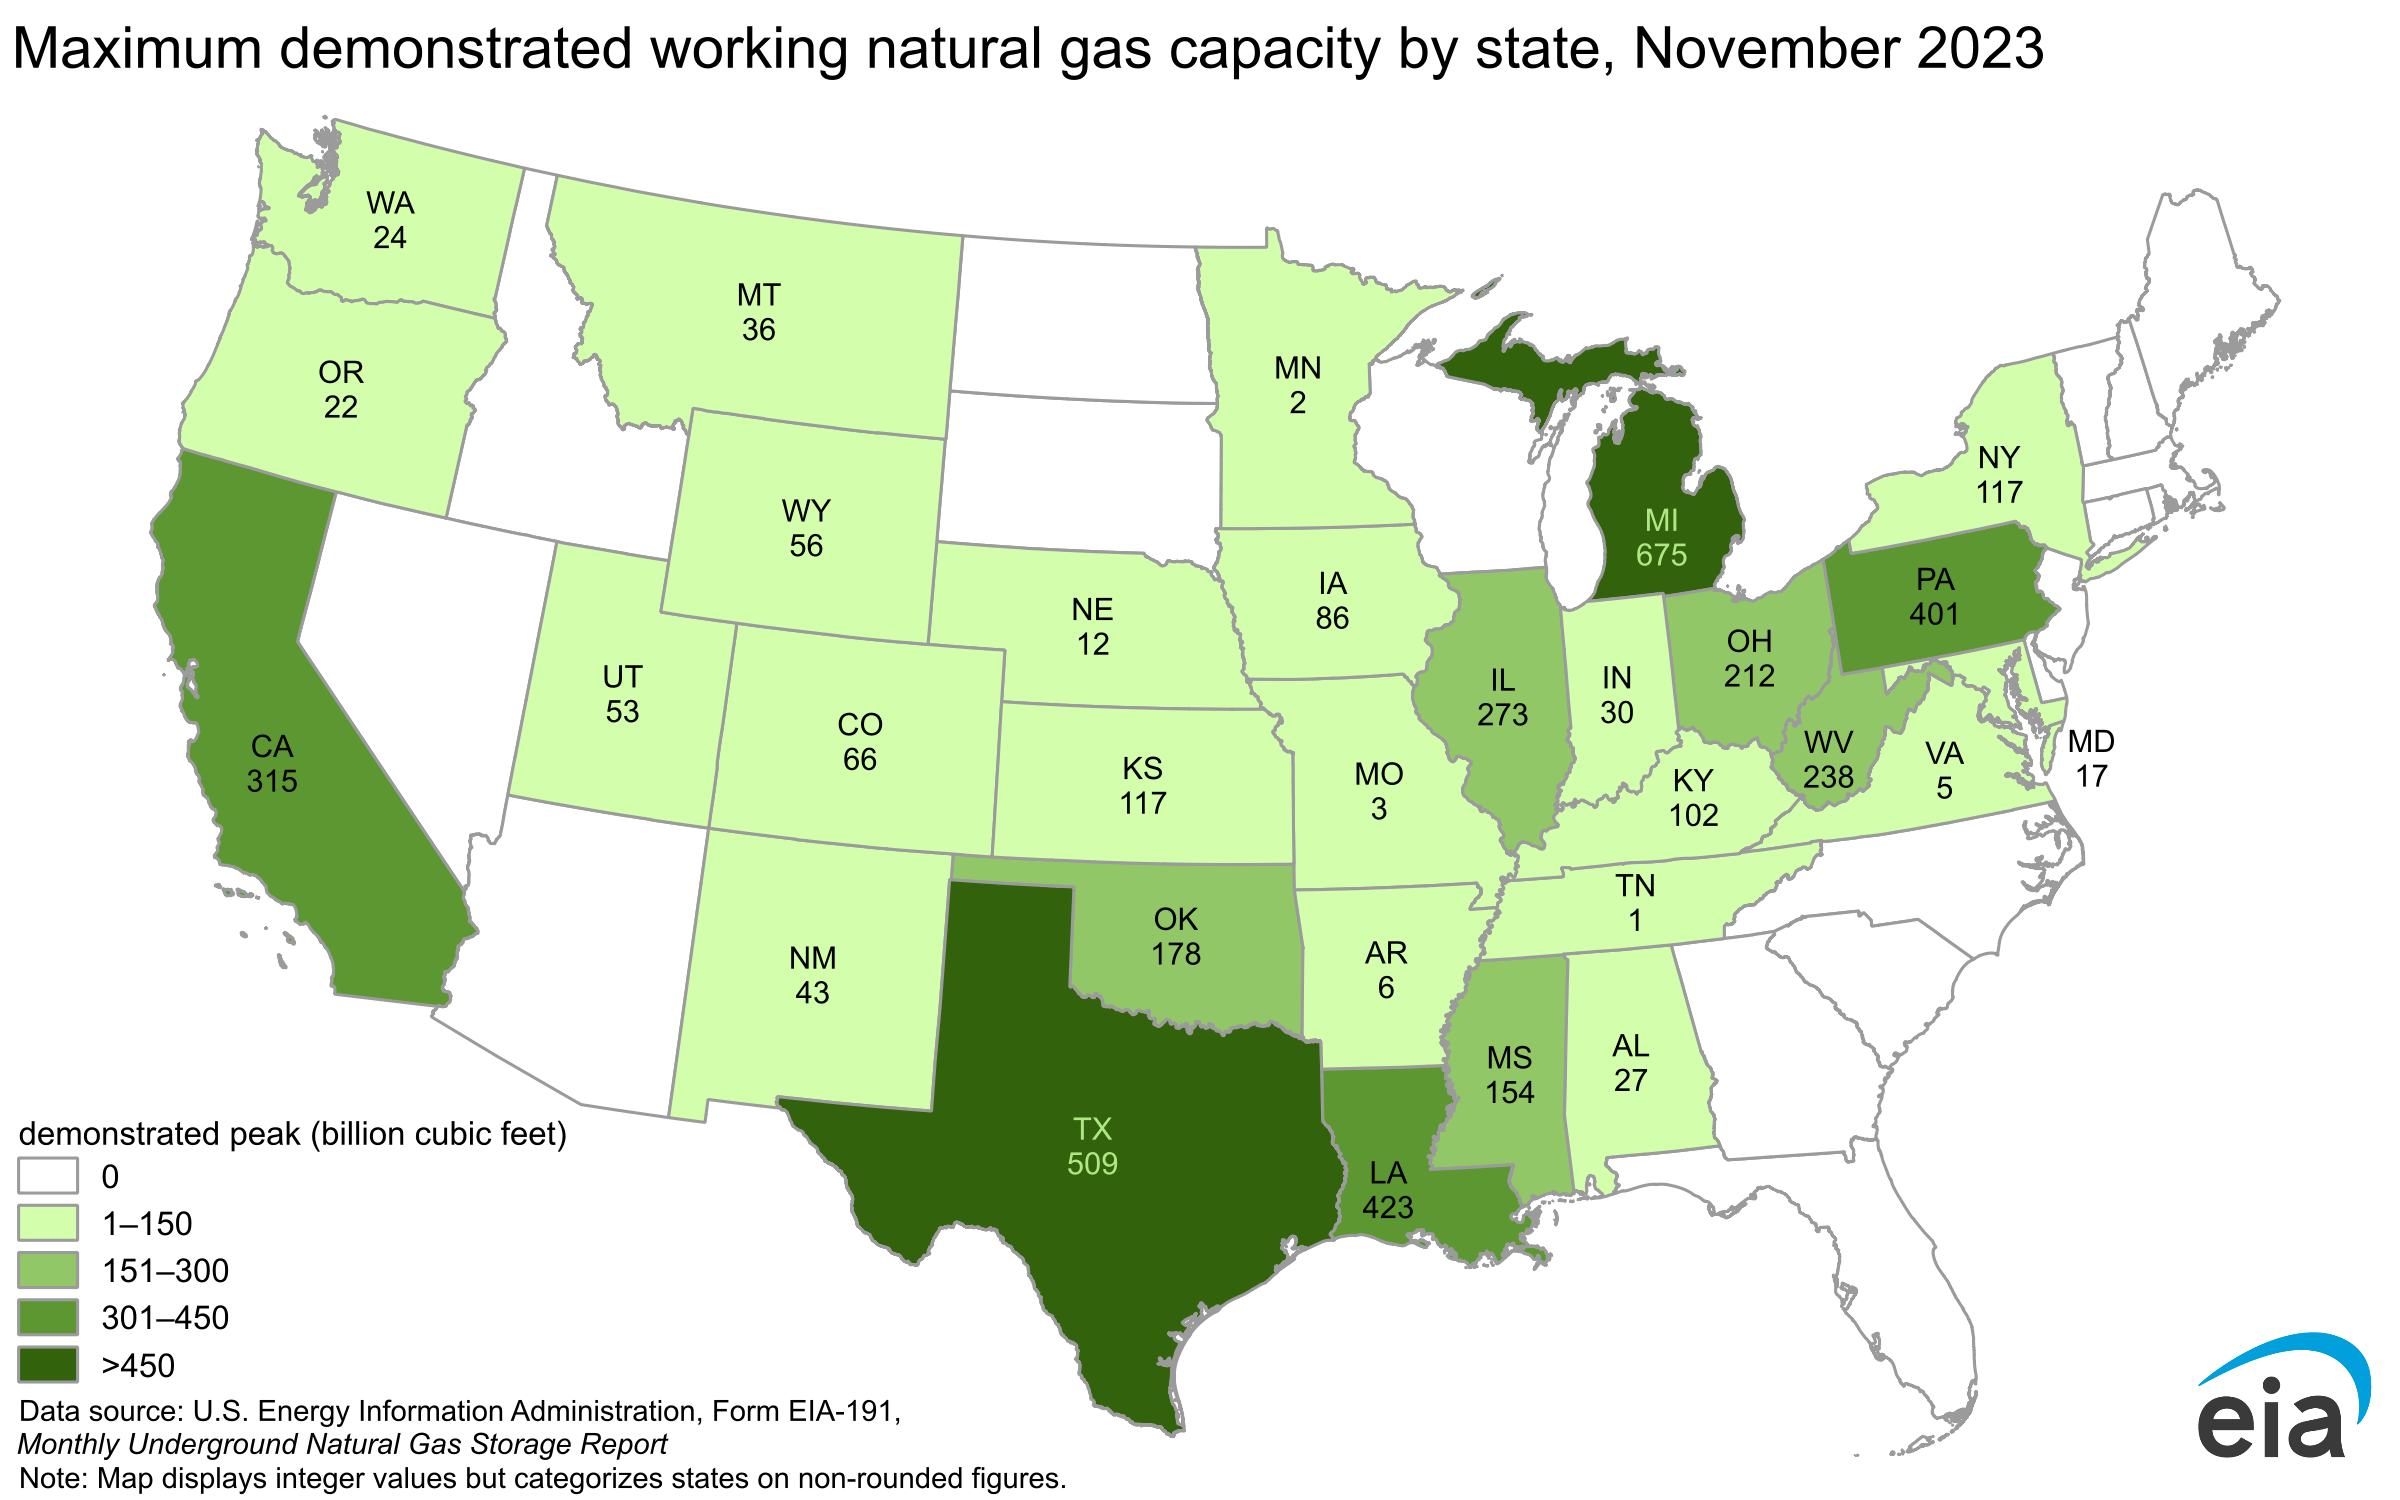
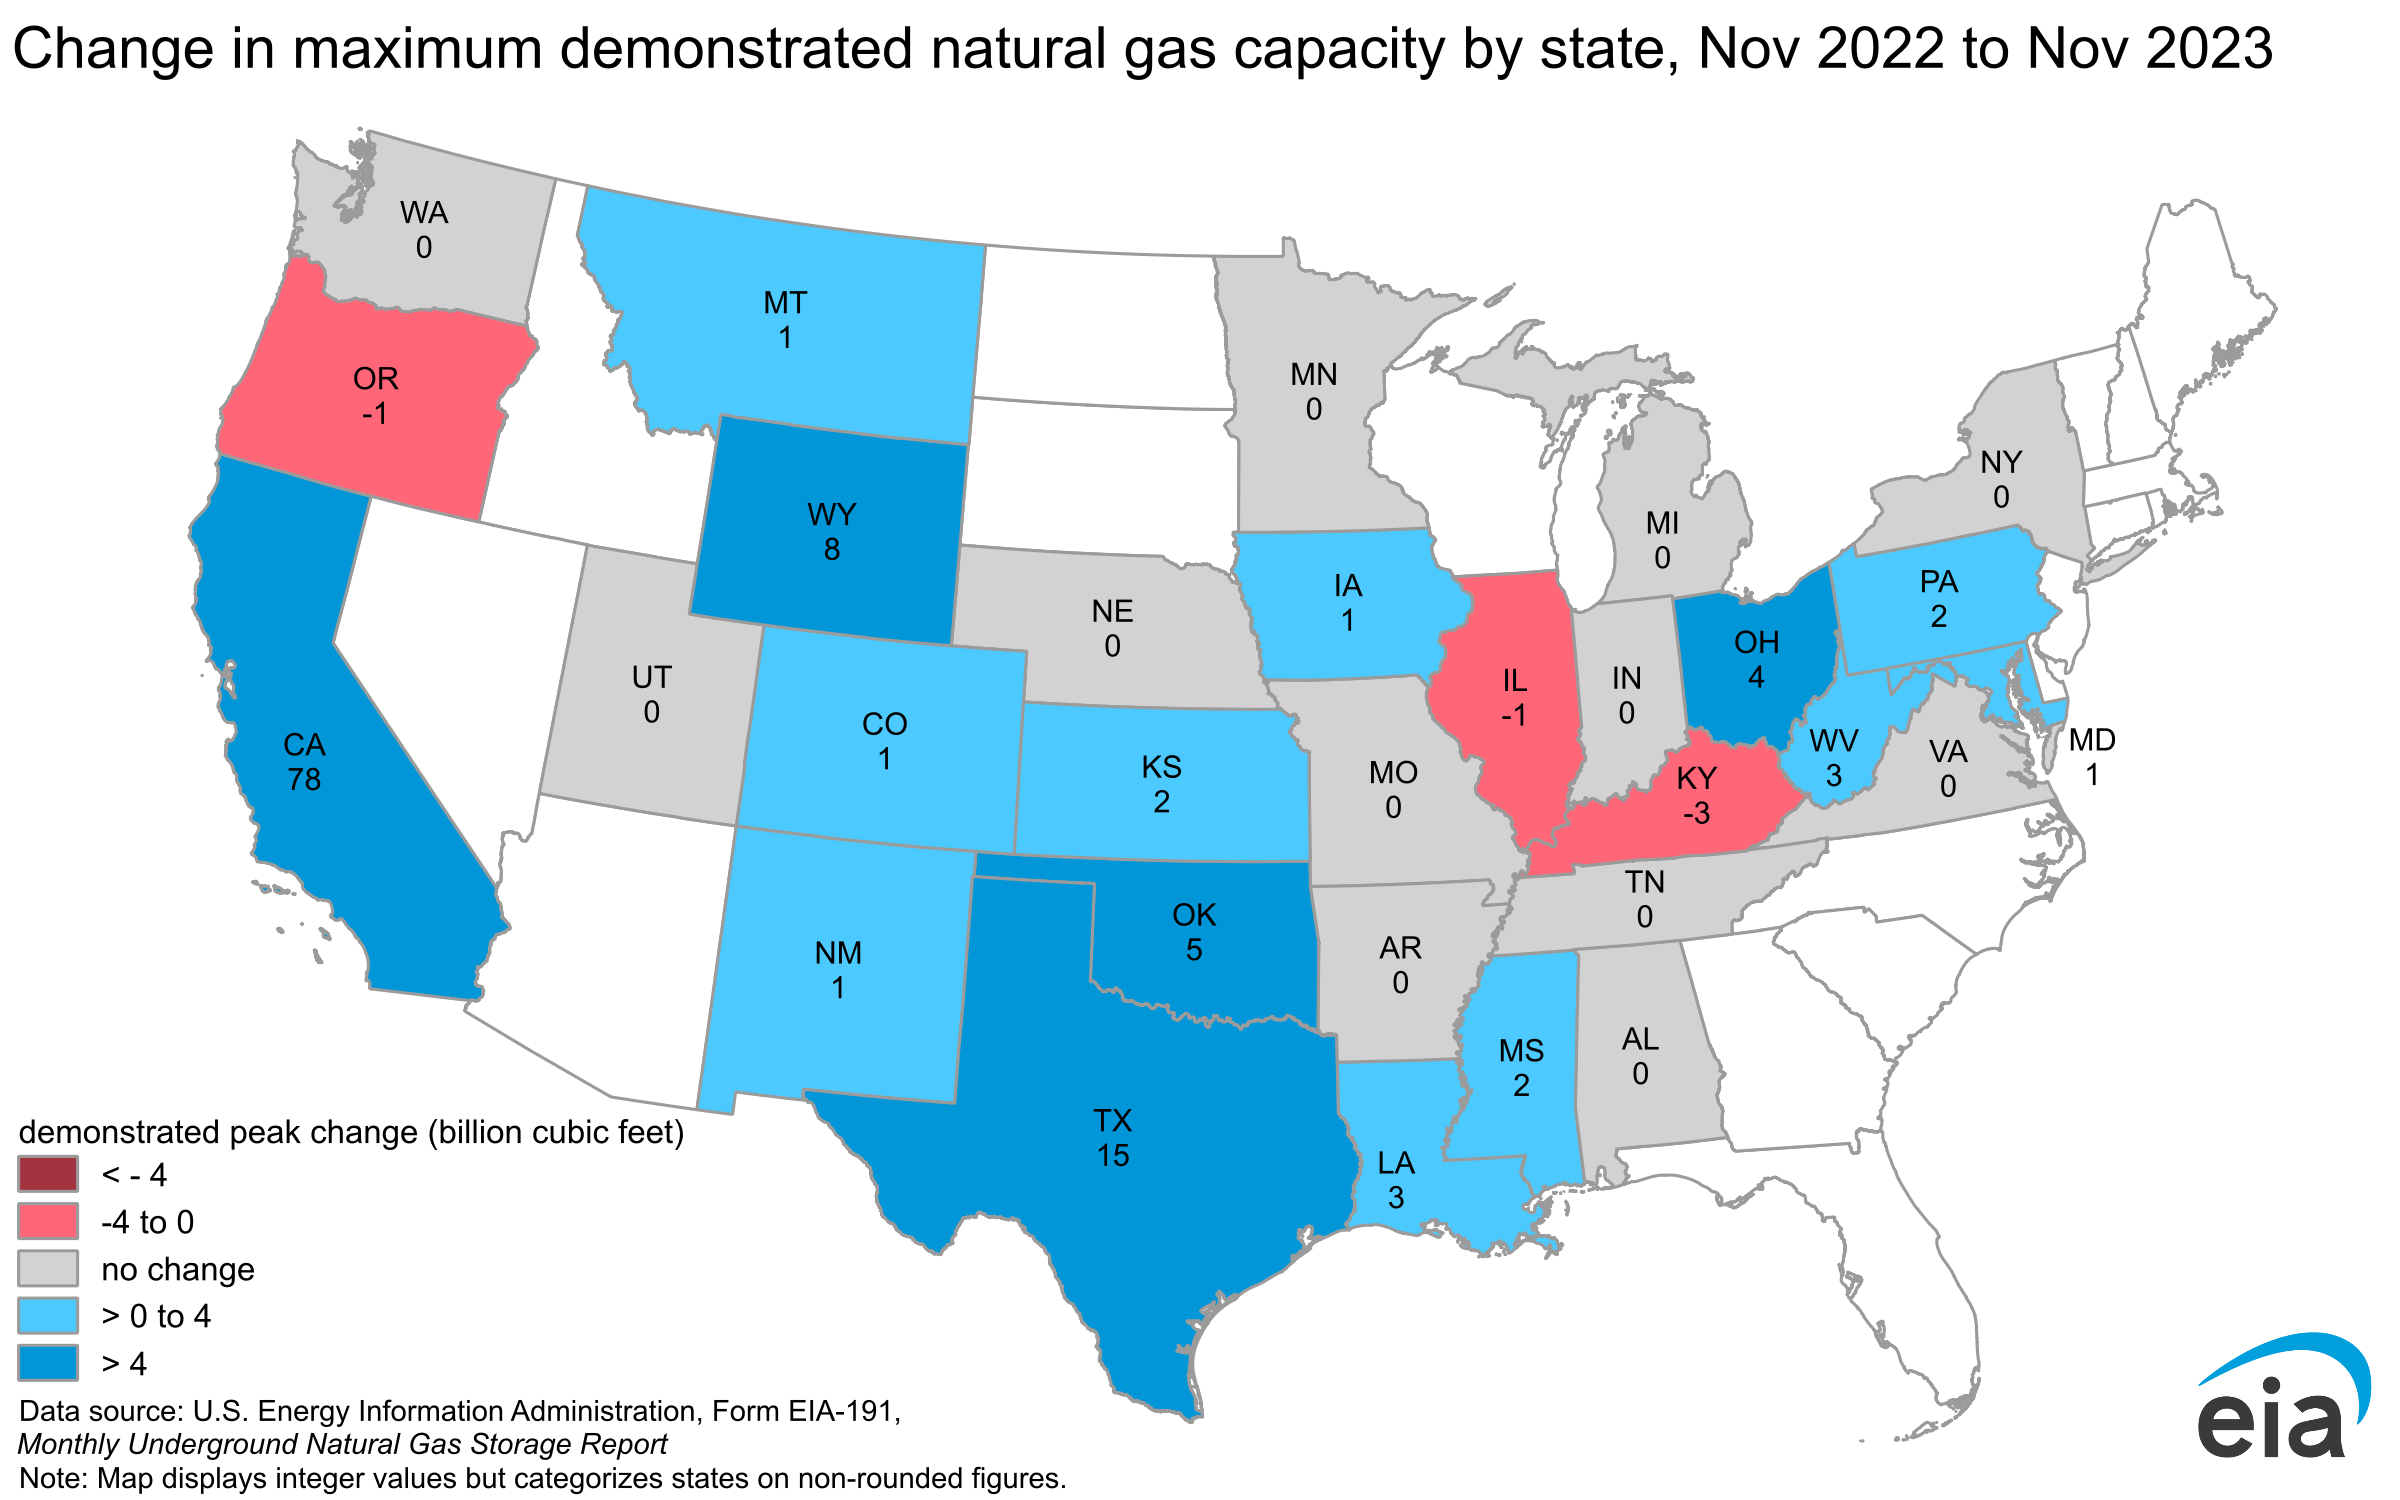
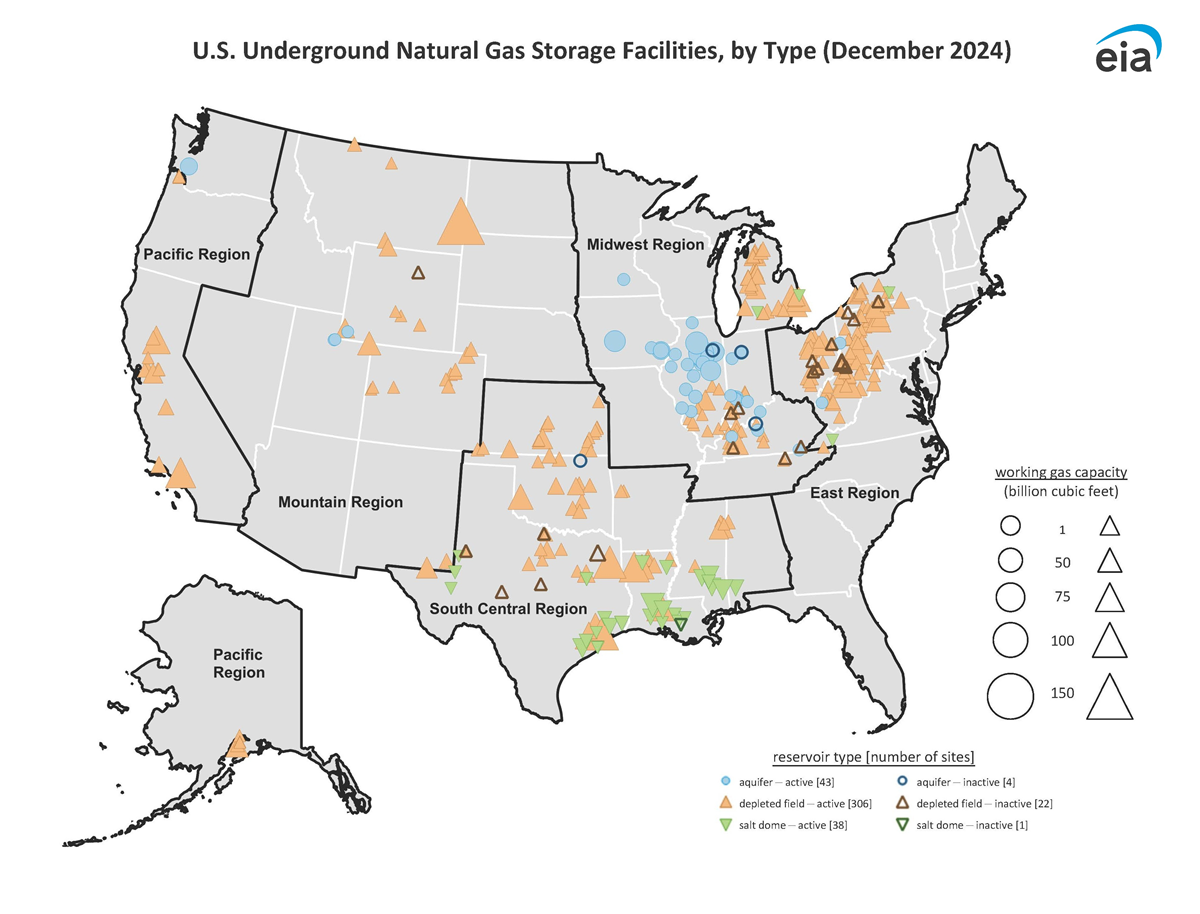
Underground working natural gas storage capacity in the Lower 48 states increased in 2025. We use two metrics to assess working natural gas storage capacity. The first metric—demonstrated peak capacity—rose 0.1%, or 6 billion cubic feet (Bcf), in 2025, reflecting increased use of natural gas storage due to market conditions. The second metric—working gas design capacity—rose 0.6%, or 26 Bcf, in 2025. Underground natural gas storage capacity continues to play an important role in balancing energy needs in the United States, regardless of how it is measured.