Find statistics on prices, exploration & reserves, production, imports, exports, storage and consumption.
Summary
- Summary — price, supply, disposition
- Monthly release date: June 30, 2026
- Release date: November 28, 2025
- Key natural gas data for prices, exploration & reserves, production, imports, exports, storage and consumption by U.S. and state.
- U.S. monthly supply and disposition
- Release date: June 30, 2026
- Includes production, imports, withdrawals and consumption
- Monthly
- Annual supply & disposition by state
- Release date: June 30, 2026
- U.S. and state level statistics for production, deliveries and receipts, storage injections and withdrawals
- Annual
- Annual company level data from Form EIA-176
- Release date: February 2026
- Company level statistics for supply, disposition, and delivery volumes; end-use prices; and number of customers.
- Annual
- Natural gas overview
- Release date: June 25, 2026 |Data from: Monthly Energy Review
- Statistics on gross withdrawals, marketed production, dry gas production, supplemental gases, imports, exports, consumption, and storage withdrawals.
-
- Monthly (more on natural gas)
- Available formats: PDFCSVXLS
- Annual (more on natural gas)
- Available formats: PDFXLS
- Natural gas statistics by country
- Query detailed country and regional energy data supply, disposition
- Annual
Prices
- Prices
- Release date: June 30, 2026
- U.S. and state prices for imports, exports, citygate, and end-use sectors, and wellhead (through 2012). Percentages of total volume delivered by sector.
- Monthly, annual
- Residential
- Release date: June 30, 2026
- Average price of natural gas delivered to residential consumers by state
- Monthly
- Commercial
- Release date: June 30, 2026
- Average price of natural gas delivered to commercial consumers by state
- Monthly
- Natural gas spot and futures prices
- Release date: July 1, 2026
- New York Mercantile Exchange futures contracts for natural gas based on delivery at the Henry Hub in Louisiana
- Daily, weekly, monthly, annual
-
- Natural gas liquid composite
- Monthly, annual
Exploration & reserves
- U.S. Crude Oil and Natural Gas Proved Reserves
- Release date: April 7, 2026
- Annual
- Reserves summary
- Release date: December 30, 2022
- Proved reserves for natural gas and natural gas liquids by U.S., region, and state
- Annual
- Proved reserves, reserves changes, and production
- Release date: December 30, 2022
- by U.S., region, and state
- Annual
- Natural gas liquids proved reserves
- Release date: December 30, 2022
- Proved reserves, reserves changes, and estimated production by U.S., region, and state
- Annual
- Estimated Natural Gas Plant Liquids contained in Total Natural Gas Proved Reserves
- Release date: December 30, 2022
- Proved reserves, reserves changes, and estimated production by U.S., region, and state
- Annual
- Proved nonproducing reserves
- Release date: December 30, 2022
- Reported proved reserves of crude oil, lease condensate, and wet natural gas, after lease separation by U.S., region, and state
- Annual
- Federal Offshore Gulf of America Deepwater reserves
- Release date: December 30, 2022
- Proved reserves of crude oil, natural gas wet after lease separation, natural gas liquids, dry natural gas, and lease condensate
- Annual
- Crude oil and natural gas drilling activity
- Release date: June 30, 2026
- Rotary rigs in operation, footage drilled, and active well service rig counts
- Monthly, annual
- Crude oil and natural gas exploratory and development wells
- Release date: July 1, 2020
- Exploratory and development wells drilled for crude oil, natural gas and dry holes; total footage drilled
- Monthly, annual
- Footage drilled for crude oil and natural gas wells
- Release date: July 1, 2020
- Footage drilled by exploratory and development wells and by crude oil, natural gas, and dry holes
- Annual
- Average depth of crude oil and natural gas wells
- Release date: July 1, 2020
- Average depth of wells drilled by exploratory and development wells and by crude oil, natural gas, and dry holes
- Annual
- Costs of crude oil and natural gas wells drilled
- Release date: July 1, 2020
- Per well and per foot costs of crude oil, natural gas, and dry hole wells
- Annual
- Maximum U.S. active seismic crew counts
- Release date: July 1, 2020
- By onshore/offshore/Alaska and dimension (monthly)
- Top 100 U.S. Oil and Gas Fields
- Release date: April 2, 2015
- Ranks the 100 largest U.S. oil and gas fields by their estimated 2013 proved reserves.
Production
- Gross withdrawals and production
- Release date: June 30, 2026
- Components of natural gas production for the U.S., states and the Gulf of America
- Monthly, annual
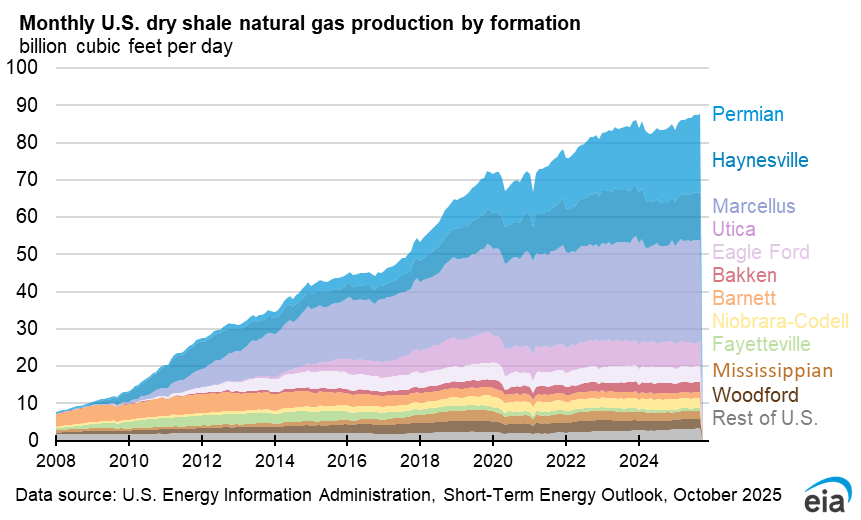
- Dry shale gas production estimates by play
- Release date: Release date: July 7, 2026
- Estimated monthly production derived from state administrative data
- Monthly
- Available formats: XLS
- Number of producing gas wells
- Release date: June 30, 2026
- U.S. and state level data
- Annual
- Number of gas producing oil wells
- Release date: June 30, 2026
- U.S. and state level data
- Annual
- Wellhead value & marketed production
- Release date: June 30, 2026
- U.S. and state level natural gas wellhead values and prices of marketed production
- Annual
- Offshore gross withdrawals
- Release date: June 30, 2026
- U.S., state, and Gulf of America gross withdrawals from oil and gas wells
- Annual
- Supplemental supplies
- Release date: June 30, 2026
- U.S. and State supplies of synthetic natural gas, biomass, refinery gas, propane-air, etc.
- Monthly, annual
- Natural gas plant processing
- Release date: June 30, 2026
- U.S. and state level statistics for natural gas processed, total liquids extracted, extraction loss.
- Annual
- Plant-level location and capacity
- Release date: January 31, 2019
- Plant-level location and capacity information for all natural gas processing plants in the United States.
- Annual
- Gulf of America Federal Offshore production
- Release date: December 30, 2022
- Production of crude oil, natural gas wet after lease separation, natural gas liquids, dry natural gas, and lease condensate
- Annual
- Natural gas plant liquids production
- Release date: December 30, 2022
- Production by U.S., region, and state
- Annual
- Lease condensate production
- Release date: December 30, 2022
- Production by U.S., region, and state
- Annual
- Unconventional dry natural gas production
- Release date: December 30, 2022
- Oil and gas field code master list
- Release date: February 25, 2022
- Comprehensive listing of U.S. oil and gas field names.
- Annual
- Distribution and production of oil & gas wells
- Release date: December 8, 2025
- Yearly estimates of the number of U.S. producing oil and natural gas wells, which are grouped into 26 production volume brackets ranging from less than 1 BOE/day to more than 12,800 BOE/day.
- Annual
- Production by company
- Release date: June 30, 2026
- Annual production volumes from data collected on Form EIA-176 (Annual Report of Natural and Supplemental Gas Supply and Disposition)
- Annual
- Monthly Crude Oil and Natural Gas Production
- Release date: November 28, 2025
- Monthly crude oil and natural gas production data collected on Form EIA-914 (Monthly Crude Oil, Lease Condensate, and Natural Gas Production Report)
- Monthly
Imports/exports
- U.S. imports by country
- Release date: June 30, 2026
- Prices and volumes
- Monthly, annual
- U.S. exports by country
- Release date: June 30, 2026
- Prices and volumes
- Monthly, annual
- U.S. imports & exports by state
- Release date: June 30, 2026
- Prices and volumes
- Monthly, annual
- U.S. imports by point of entry
- Release date: June 30, 2026
- Prices and volumes
- Monthly, annual
- U.S. exports by point of exit
- Release date: June 30, 2026
- Prices and volumes
- Monthly, annual
- U.S. international & interstate movements of natural gas by state
- Release date: June 30, 2026
- Includes International and Interstate receipts, deliveries and net receipts by state
- Annual
- International imports data
- Imports by country, region and country groups
- International exports data
- Exports by country, region and country groups
- U.S. liquefaction capacity
- Detailed information on the size and location of U.S. LNG export projects (existing, under construction, and approved)
-
Pipelines
- About U.S. pipelines
- Detailed information and maps showing pipelines, capacities, flows and network design, transportation corridors, and other relevant information for U.S. pipelines in the lower 48 states.
- U.S. state-to-state capacity
- Information on capacity of existing natural gas pipelines crossing between states, international borders, and offshore Gulf of America.
-
- Pipeline projects
- Detailed information on the size and location of pipeline projects announced or under construction.
-
Storage
- Weekly working gas in underground storage
- Release Date: July 2, 2026
- U.S. natural gas inventories held in underground storage facilities
- Weekly
-
- Underground storage East, West, and Producing regions
- (historical data 12/31/1993 - 11/06/2015)
- Underground storage — all operators
- Release date: June 30, 2026
- Total storage by base gas and working gas, and storage activity by state
- Monthly, annual
- Underground storage by type
- Release date: June 30, 2026
- U.S. storage and storage activity by all operators, salt cavern fields and nonsalt cavern
- Monthly, annual
- Underground storage capacity
- Release date: June 30, 2026
- Storage capacity, working gas capacity, and number of active fields for salt caverns, aquifers, and depleted fields by state
- Monthly, annual
- Liquefied natural gas additions to and withdrawals from storage
- Release date: June 30, 2026
- By state
- Annual
- Underground natural gas working storage capacity
- Release date: May 21, 2026
- This report provides estimates of aggregate peak working gas capacity and working gas design capacity for the U.S. underground natural gas storage as of November of the previous year.
- Annual
- U.S. field level storage data
- Release date: November 28, 2025
- Annual field-level storage capacity and field-type data for all underground storage fields in the United States.
- Annual
- Planned storage projects
- Detailed information on the size and location of underground storage facilities announced or under construction.
- Available formats: XLS
- Weekly Natural Gas Storage Report
- Thursday 10:30 a.m. EST
- Working gas in underground storage for current week and week ago comparison.
- Weekly Natural Gas Storage Report Supplement
- Release Date: July 2, 2026
- Companion publication to the Weekly Natural Gas Storage Report (WNGSR) and provides key highlights of the natural gas sector.
Consumption
- Total consumption
- Monthly release date: June 30, 2026
- Annual release date: November 28, 2025
- U.S. and State total consumption by lease and plant, pipeline, and end use consumers by sector
- Delivered to consumers
- Monthly release date: June 30, 2026
- Annual release date: November 28, 2025
- U.S. and State volumes delivered to end use consumers by sector
- Number of consumers
- Release date: June 30, 2026
- Number of sales and transported consumers for residential, commercial, and industrial sectors by state
- Annual
- State shares of U.S. deliveries
- Release date: June 30, 2026
- By sector and total consumption
- Annual
- Delivered for the account of others
- Release date: June 30, 2026
- Commercial, industrial and electric utility deliveries; percentage of total deliveries by state
- Annual
- Heat content of natural gas consumed
- Release date: June 30, 2026
- Btu per cubic foot of natural gas delivered to consumers by state and other components of consumption for U.S.
- Annual
- Company-level supply and disposition
- Release date: November 28, 2025
- Annual company-level supply and disposition data for all natural gas local distribution companies in the United States.
- Annual
- International natural gas consumption
- Dry natural gas consumption, by country, region, and country groups
- International Energy Statistics
- Annual
Regular Weekly Releases*
Thursday
-
- Weekly Natural Gas Storage Report
- 10:30 a.m. eastern time
- Weekly Natural Gas Storage Report Supplement
- By 5:00p.m. eastern time
- *No releases: Monday, Tuesday, Wednesday or Friday. Releases change on weeks with Federal holidays.
-
Most requested natural gas data
- Summary
- Prices
- Exploration & Reserves
- Production
- Imports/Exports & Pipelines
- Storage
- Consumption
International data
- Overview