U.S. Energy Information Administration logo
Skip to sub-navigation

Natural Gas

Supplement from: U.S. Crude Oil and Natural Gas Proved Reserves

Top 100 U.S. Oil and Gas Fields

With Data for 2013   |  Release Date:  April 2, 2015   |   Next Release Date: Discontinued   

Previous Issues (pdf):

Introduction

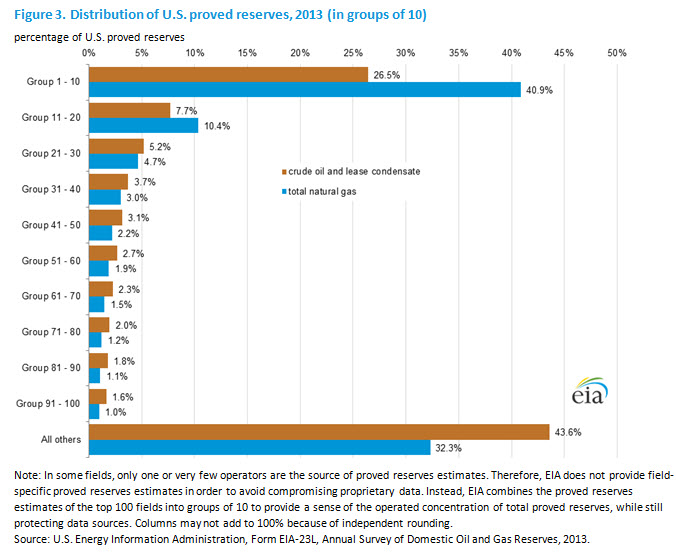
This supplement to the U.S. Energy Information Administration's (EIA) U.S. Crude Oil and Natural Gas Proved Reserves, 2013 ranks the 100 largest U.S. oil and gas fields by their estimated 2013 proved reserves.

EIA defines a field as "an area consisting of a single reservoir or multiple reservoirs all grouped on, or related to, the same individual geological structural feature and/or stratigraphic condition. There may be two or more reservoirs in a field that are separated vertically by intervening impervious strata or laterally by local geologic barriers, or by both." This definition is not used by all states in their designation of fields; consequently, areas classified as individual fields by some states may be found combined in these tables or in the EIA Field Code Master List.

Particularly in the case of unconventional shale plays for both crude oil and natural gas, multiple areas or fields may have been combined into one entry within these ranking tables. The resultant field entry in the table is labeled as an area or unit, e.g., Marcellus Shale Area, Haynesville Shale Unit, Spraberry Trend Area, and Hugoton Gas Area.

The oil field production and reserves data include both crude oil and lease condensate. The gas field production and reserves data are total natural gas, wet after lease separation, which is the sum of associated-dissolved natural gas and nonassociated natural gas with natural gas plant liquids not yet removed.

The top 100's share of U.S. proved reserves in 2013

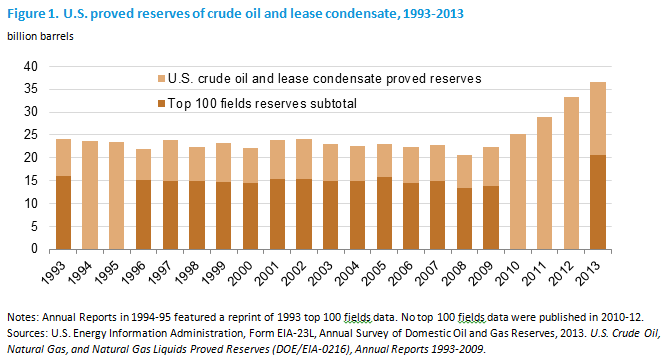
The top 100 oil fields as of December 31, 2013, accounted for 20.6 billion barrels of crude oil and lease condensate proved reserves, which was 56% of the U.S. total (36.5 billion barrels) in 2013 (Figure 1).

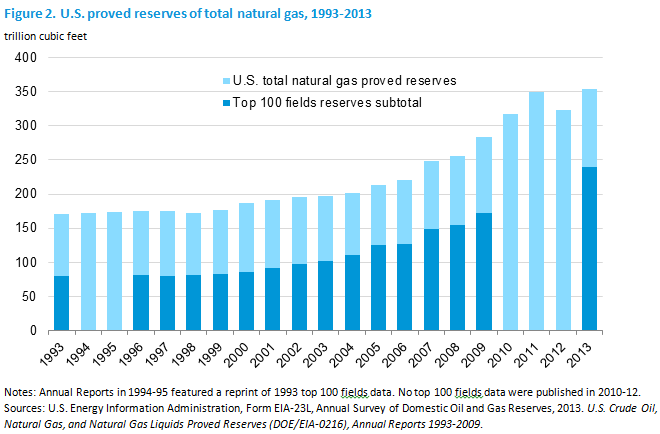
The top 100 gas fields as of December 31, 2013, accounted for 239.7 trillion cubic feet of total natural gas proved reserves, about 68% of the U.S. total natural gas proved reserves in 2013 (Figure 2).


Read entire supplement: Top 100 U.S. Oil and Gas Fields
Statistics
Analysis
Tools
Education
News

Petroleum & Other Liquids

Crude oil, gasoline, heating oil, diesel, propane, and other liquids including biofuels and natural gas liquids.

Natural Gas

Exploration and reserves, storage, imports and exports, production, prices, sales.

Electricity

Sales, revenue and prices, power plants, fuel use, stocks, generation, trade, demand & emissions.

Coal

Reserves, production, prices, employment and productivity, distribution, stocks, imports and exports.

Nuclear & Uranium

Uranium fuel, nuclear reactors, generation, spent fuel.

Renewable & Alternative Fuels

Includes hydropower, solar, wind, geothermal, biomass and ethanol.

EIA Survey Forms

Forms EIA uses to collect energy data including descriptions, links to survey instructions, and additional information.

Total Energy

Comprehensive data summaries, comparisons, analysis, and projections integrated across all energy sources.

U.S. States

State energy information, including overviews, rankings, data, and analyses.

International

International energy information, including overviews, rankings, data, and analyses.

Environment

Greenhouse gas data, voluntary reporting, electric power plant emissions.

Data Tools, Apps, & Maps

Tools to customize searches, view specific data sets, study detailed documentation, and access time-series data.

Open Data

EIA's free and open data available as API, Excel add-in, bulk files, and widgets

EIA Beta

Come test out some of the products still in development and let us know what you think!

Open Source Code

EIA's open source code, available on GitHub.

RSS Feeds

Subscribe to feeds for updates on EIA products including Today in Energy and What's New.