East Coast and Gulf Coast Transportation Fuels Markets
Release date: February 3, 2016
Introduction
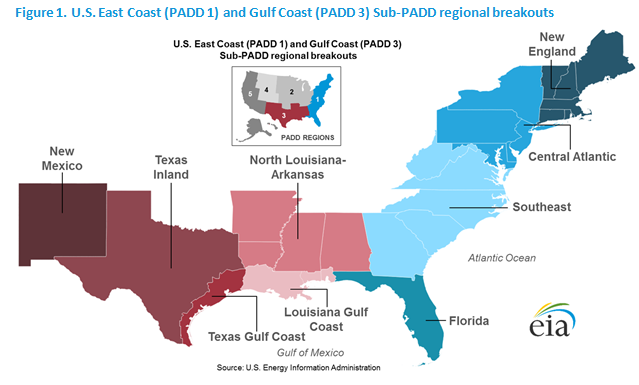
This study examines supply, consumption, and distribution of transportation fuels in Petroleum Administration for Defense Districts (PADDs) 1 and 3, or the U.S. East Coast and the Gulf Coast, respectively. The East Coast region includes states from Maine to Florida along the U.S. Atlantic Coast. The Gulf Coast region comprises states between New Mexico in the west to Alabama in the east along the Gulf of Mexico. For this study, transportation fuels include gasoline, diesel fuel and jet fuel. Residual fuel oil supply is also analyzed where applicable.
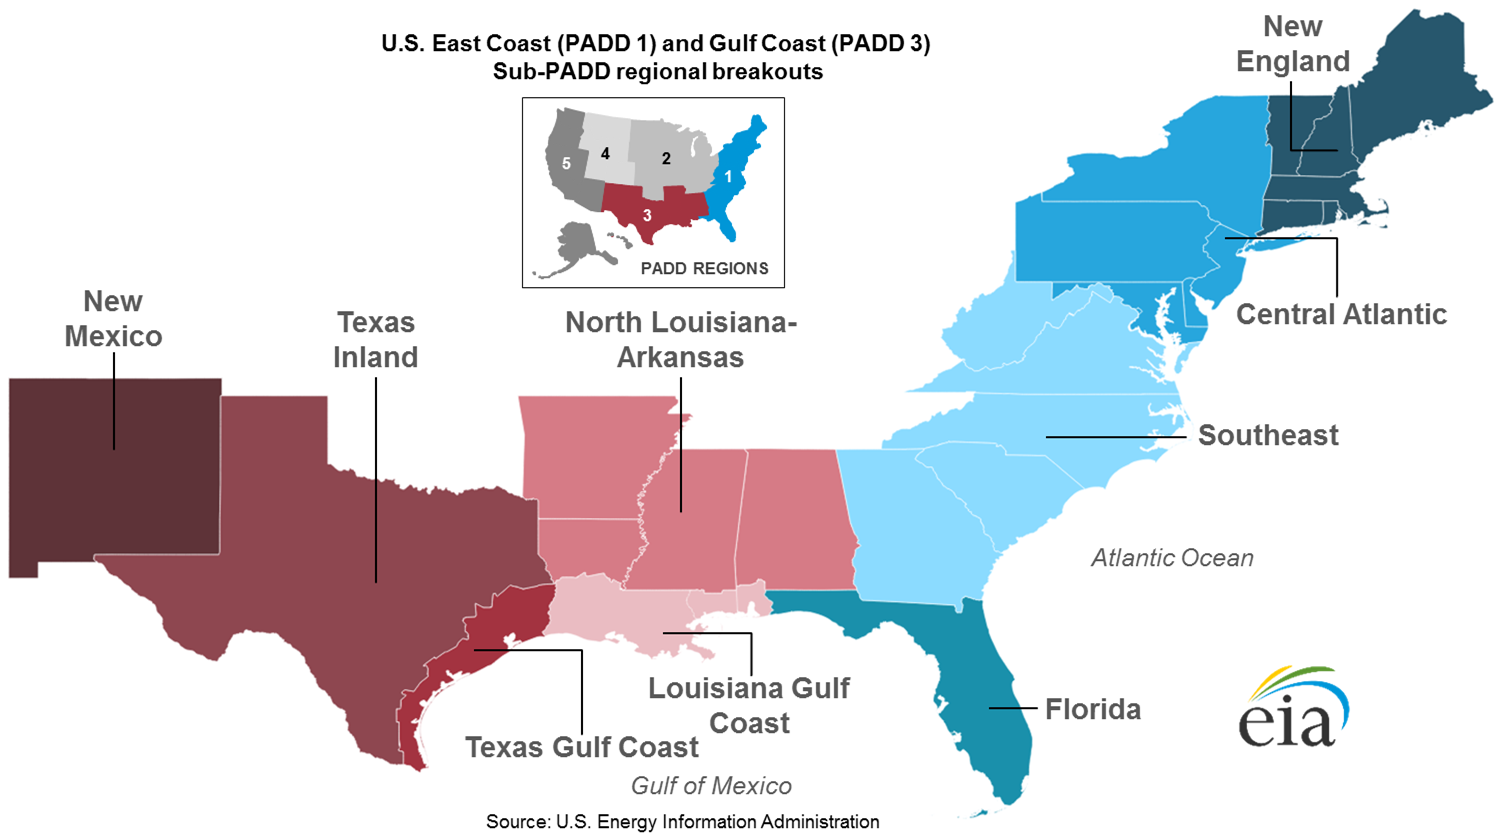
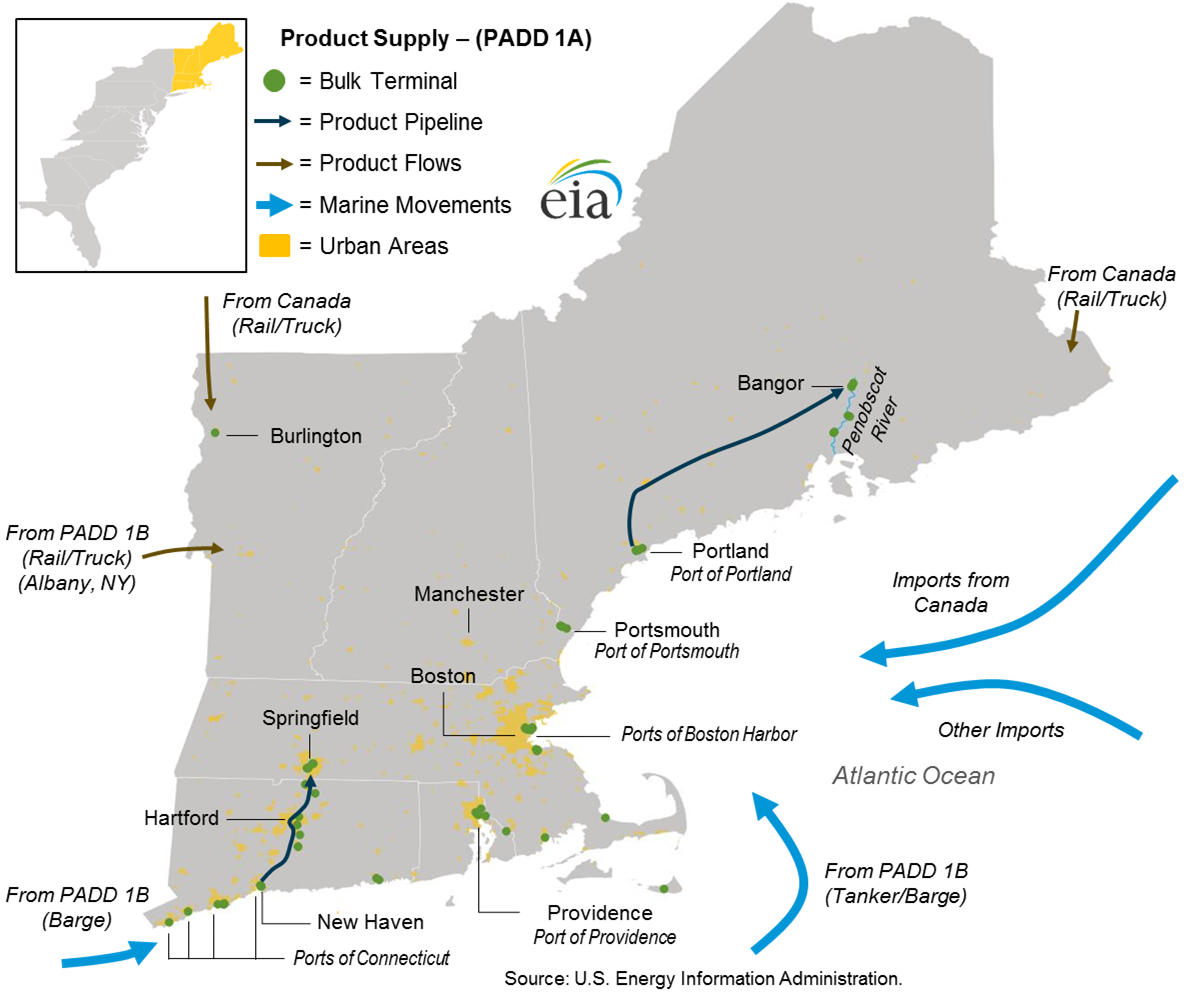
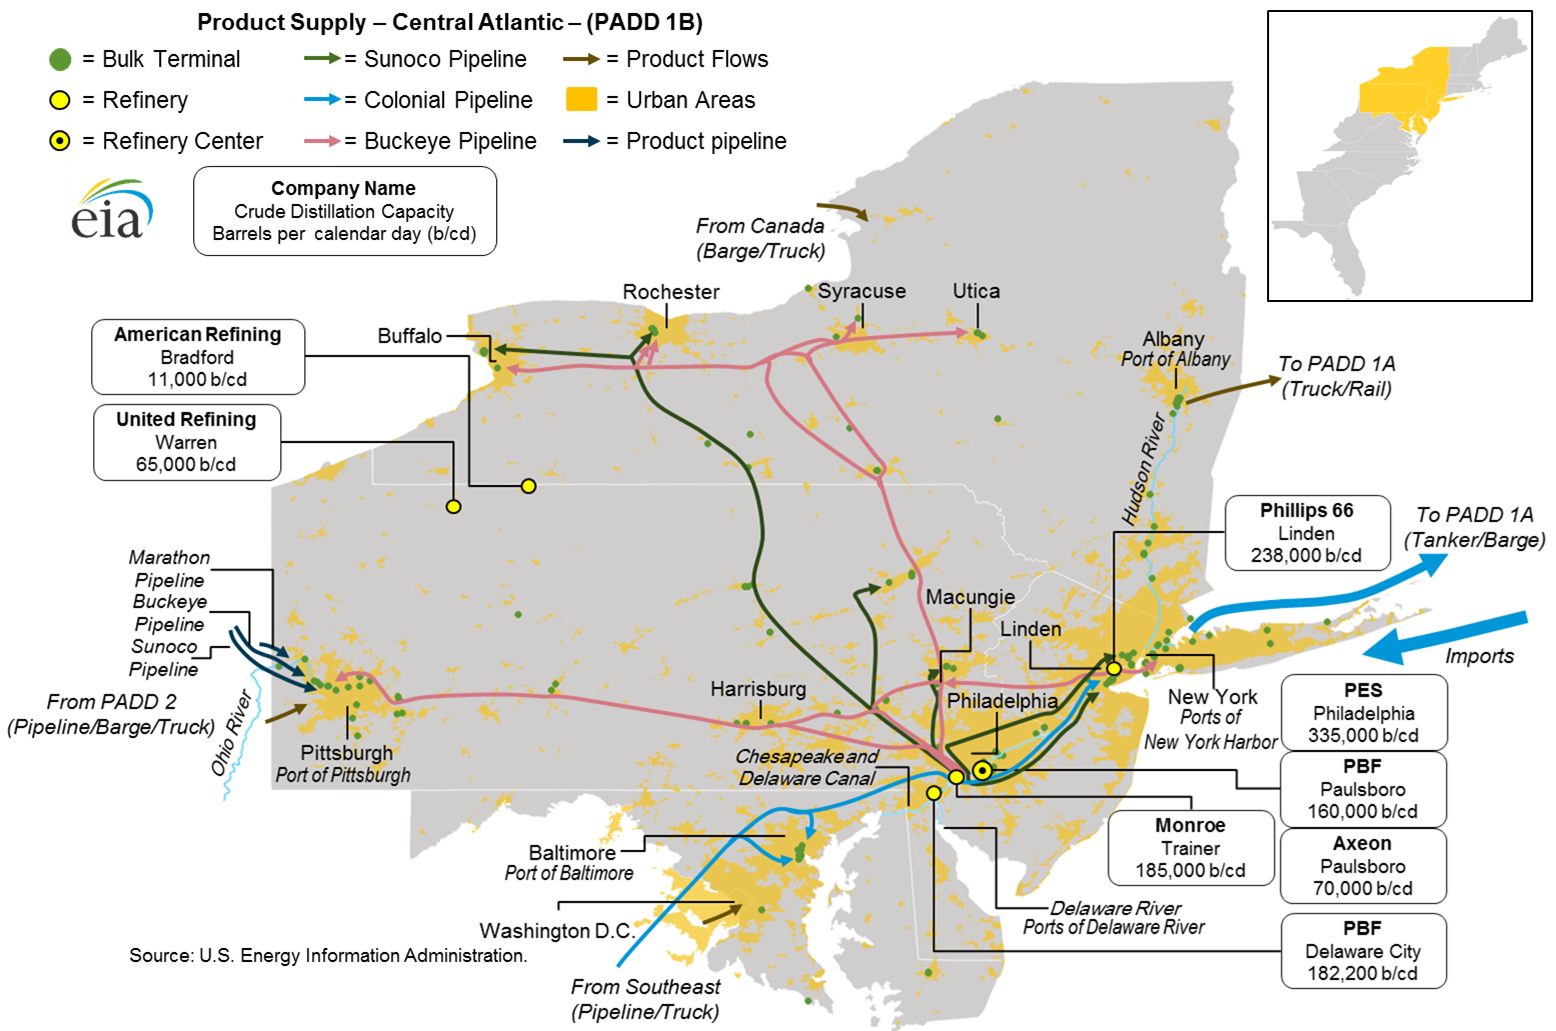
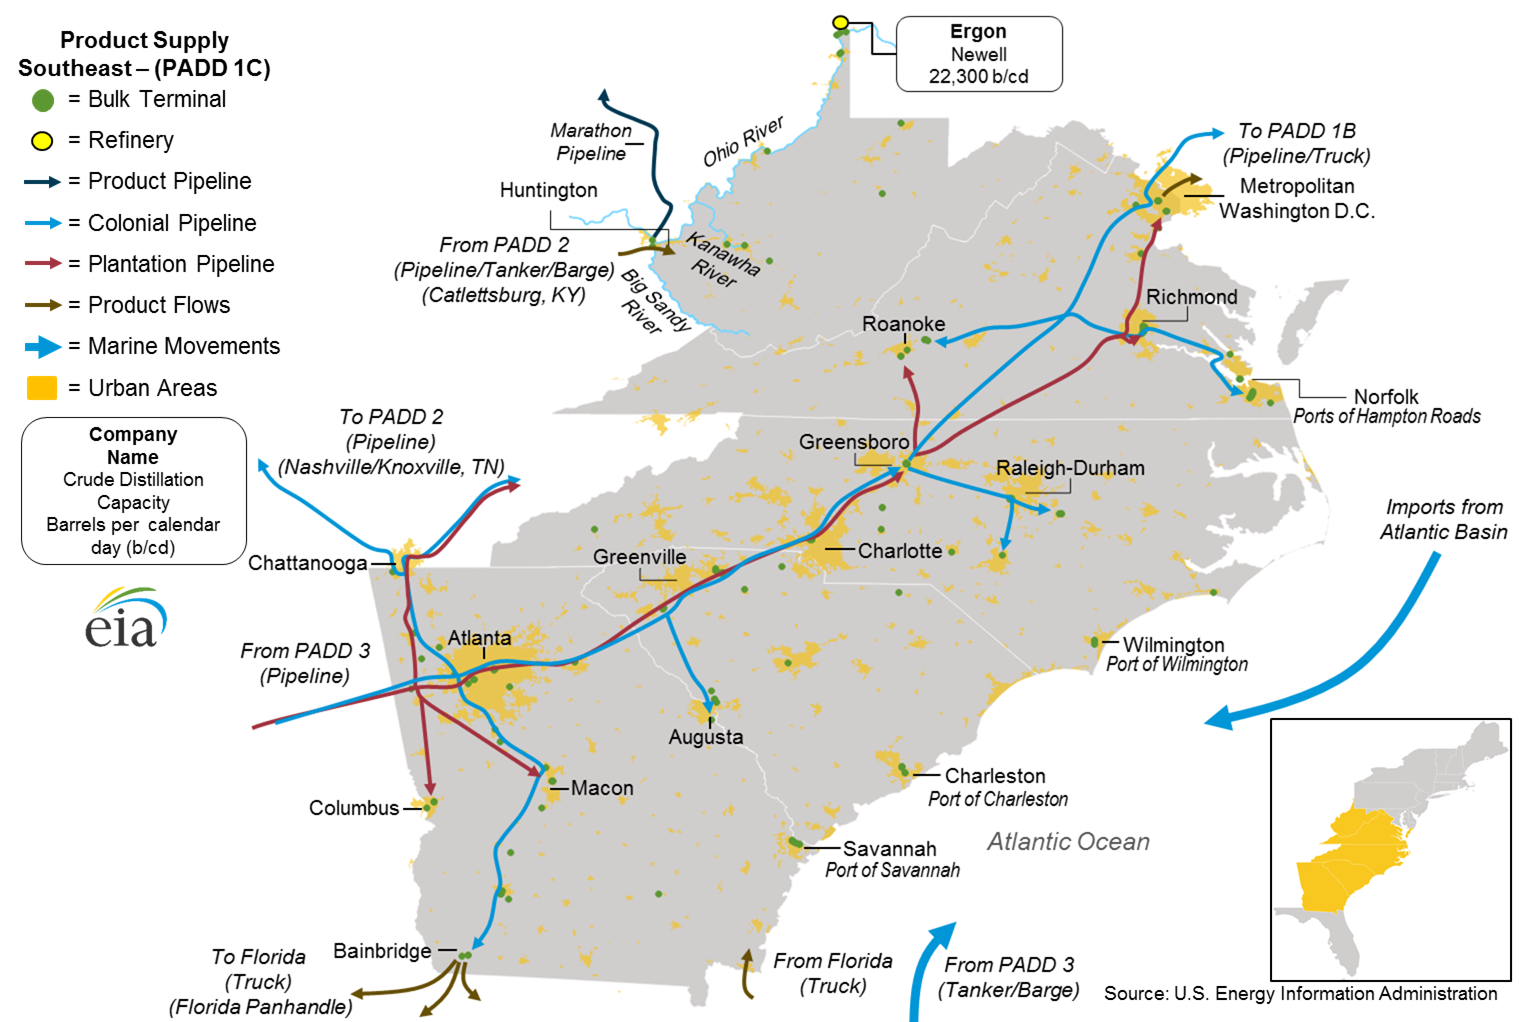
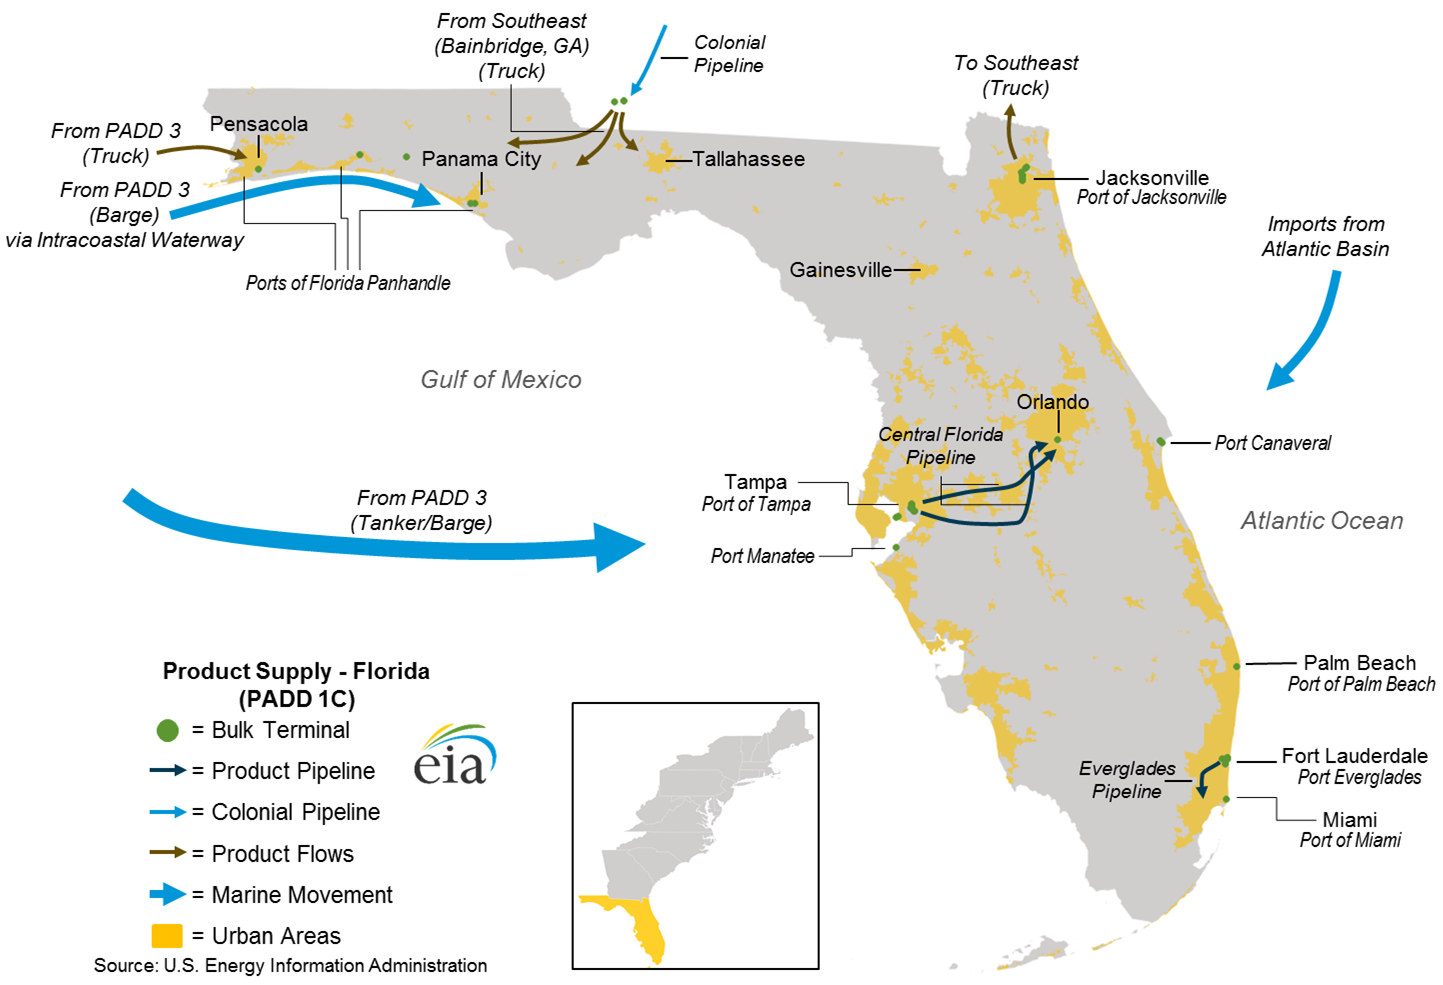
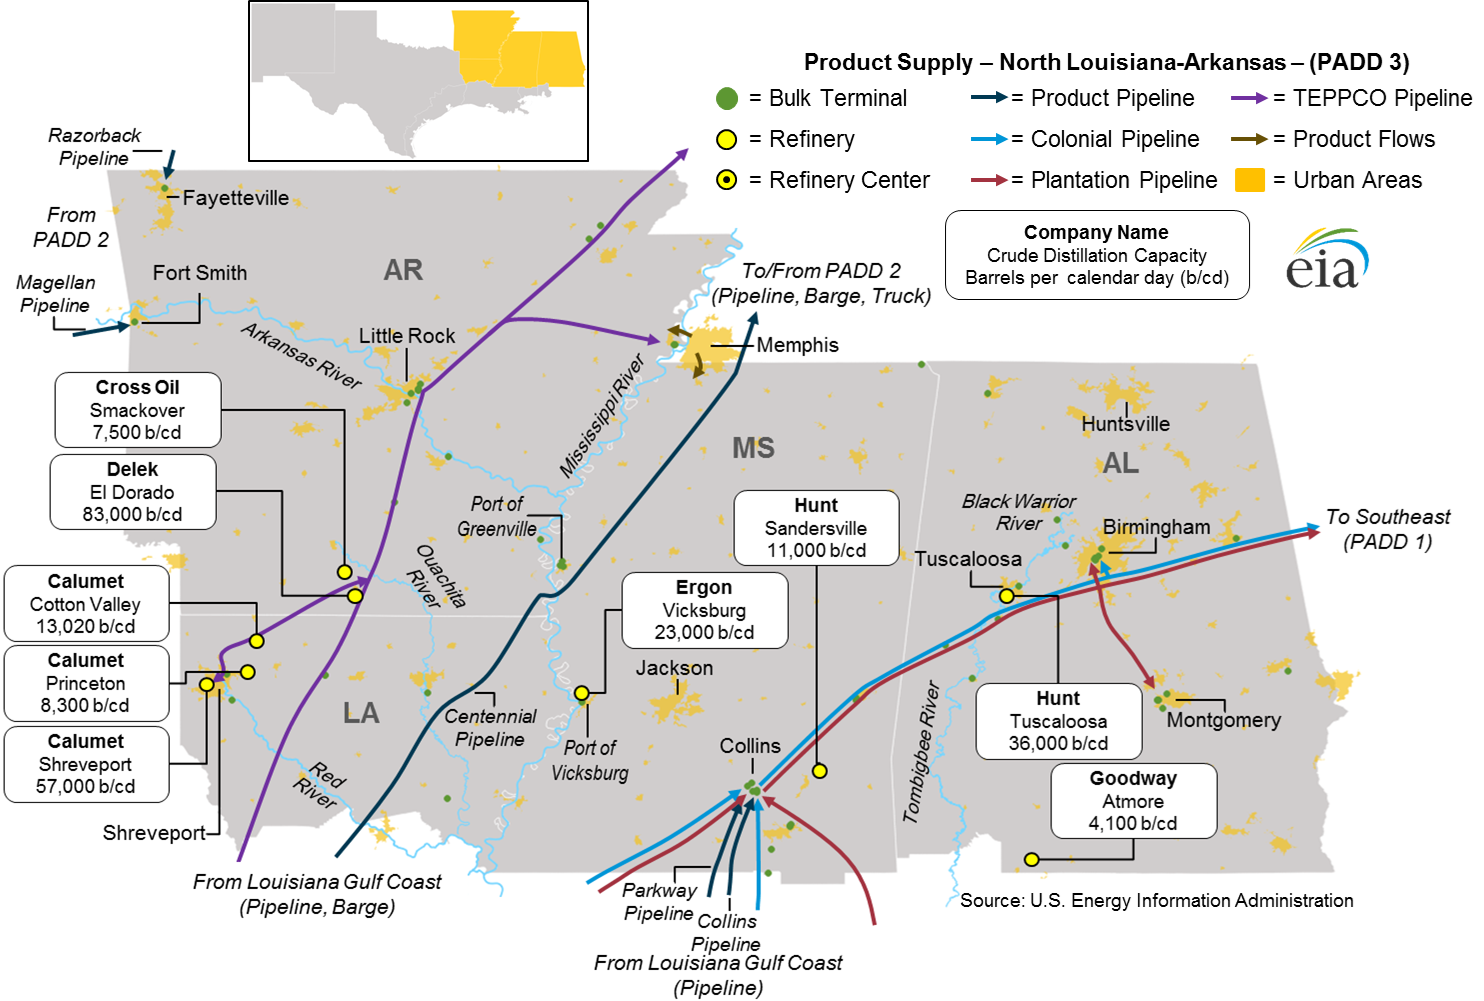
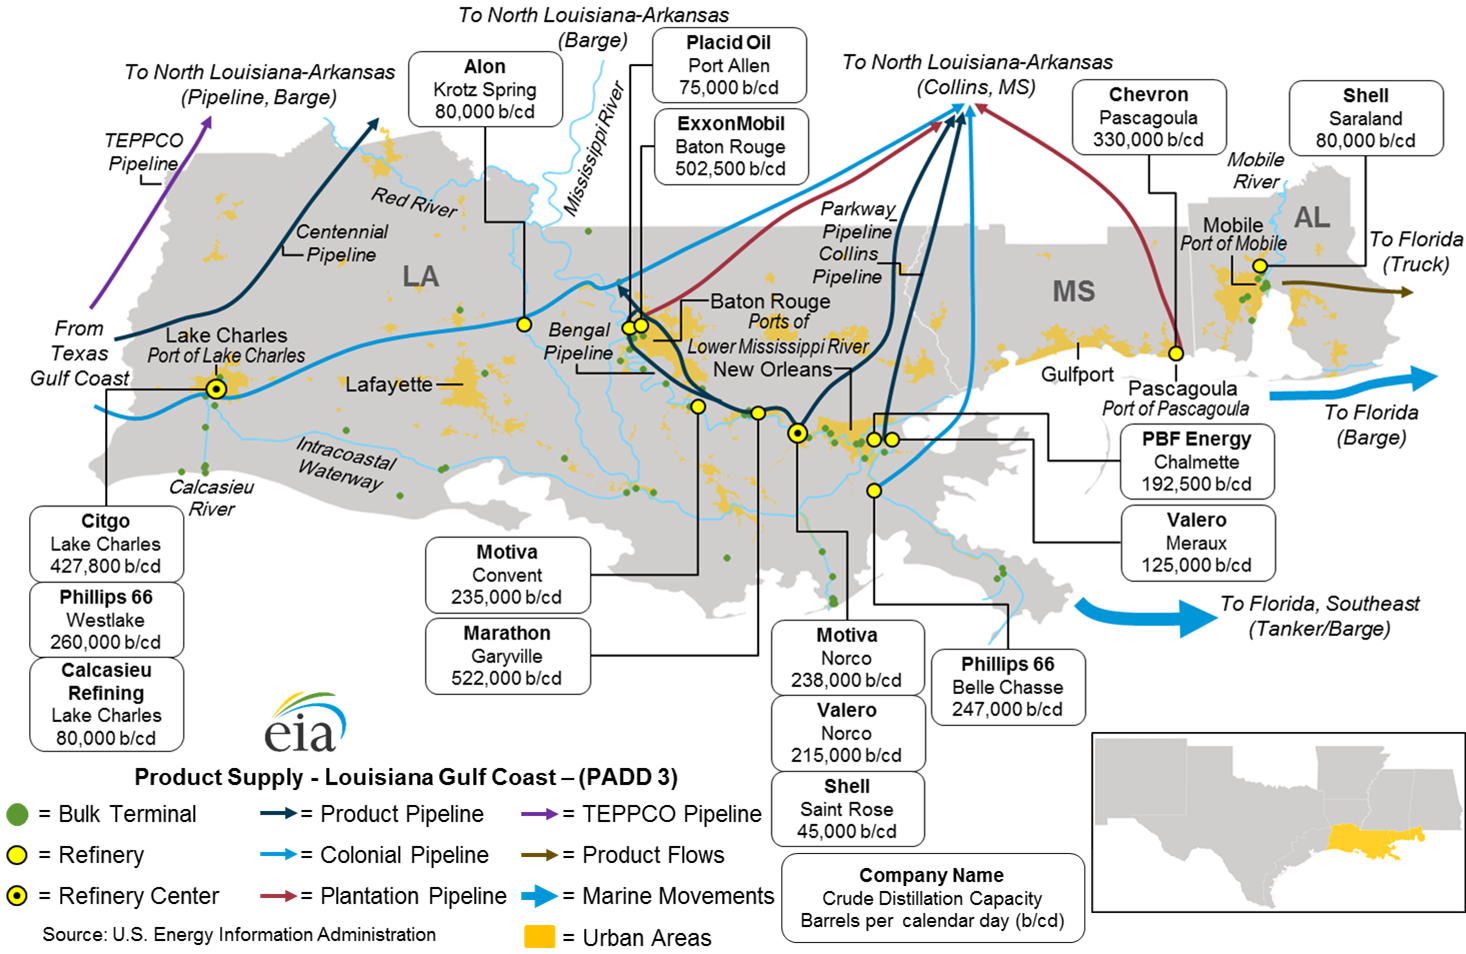
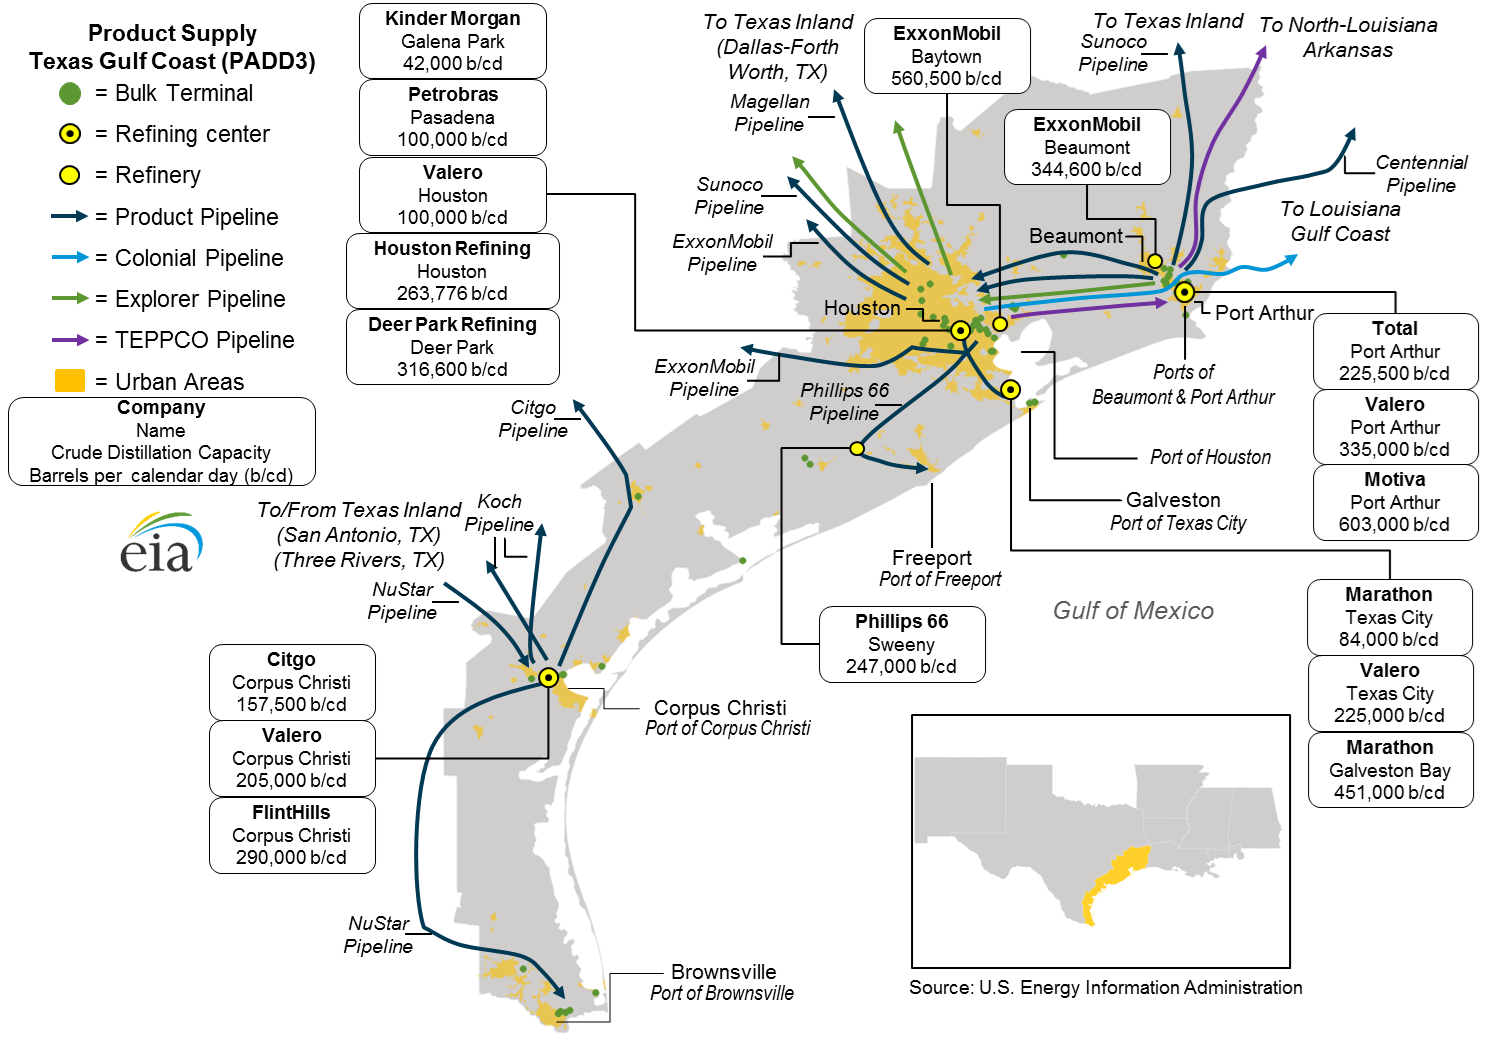
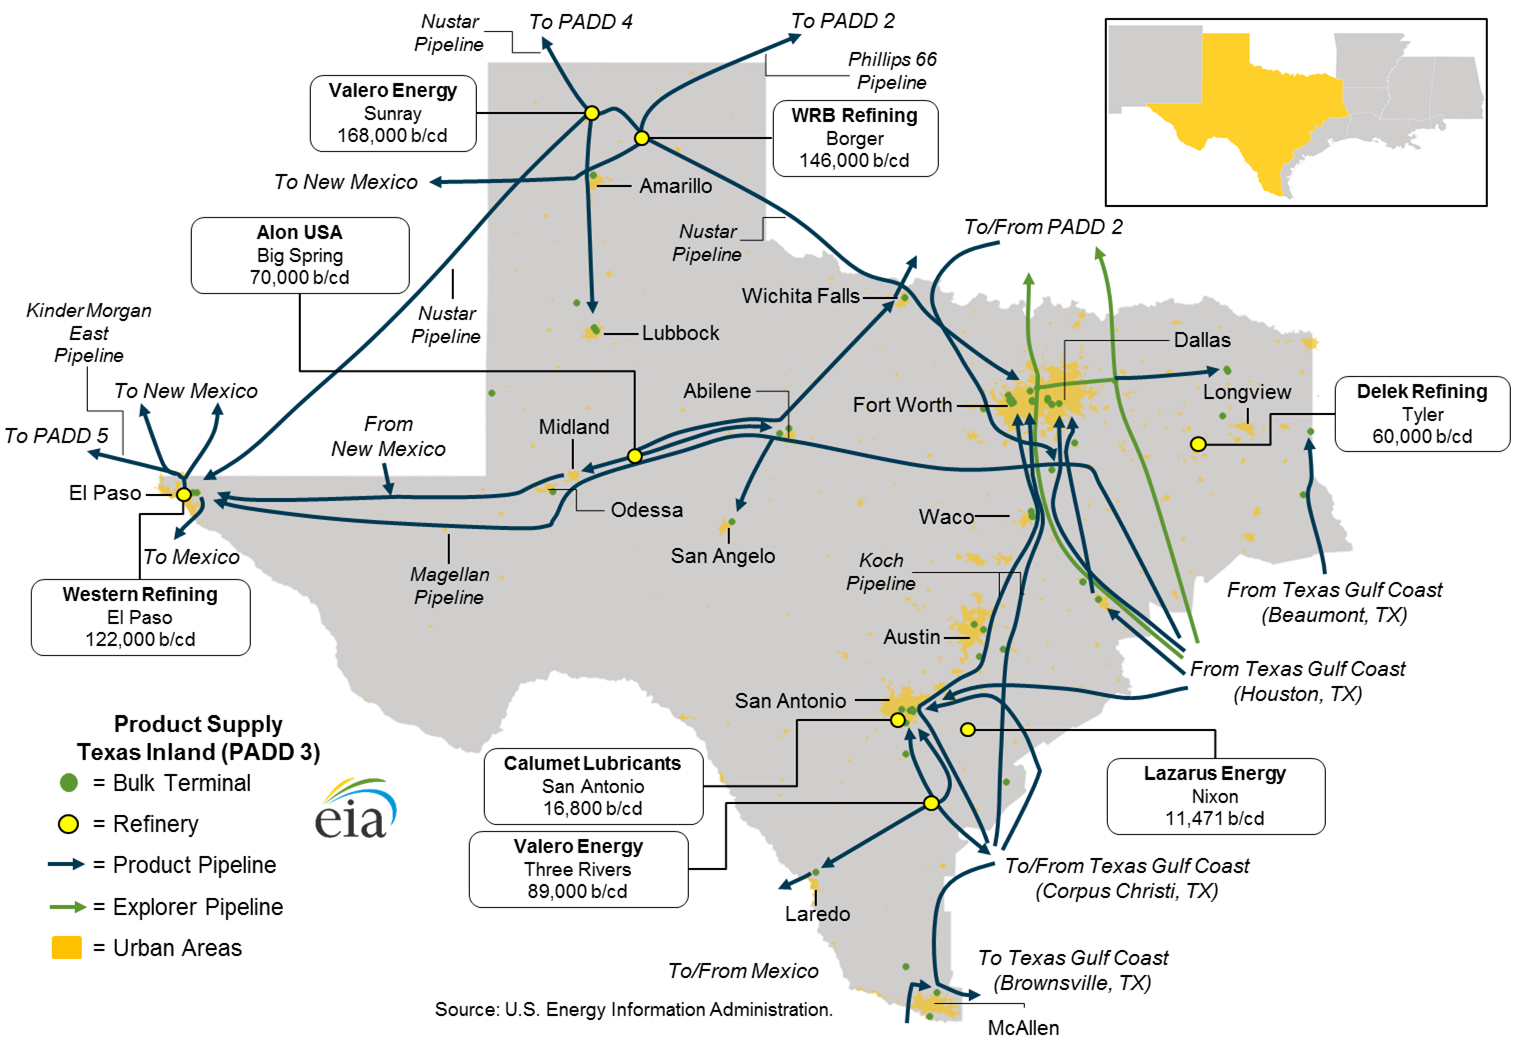
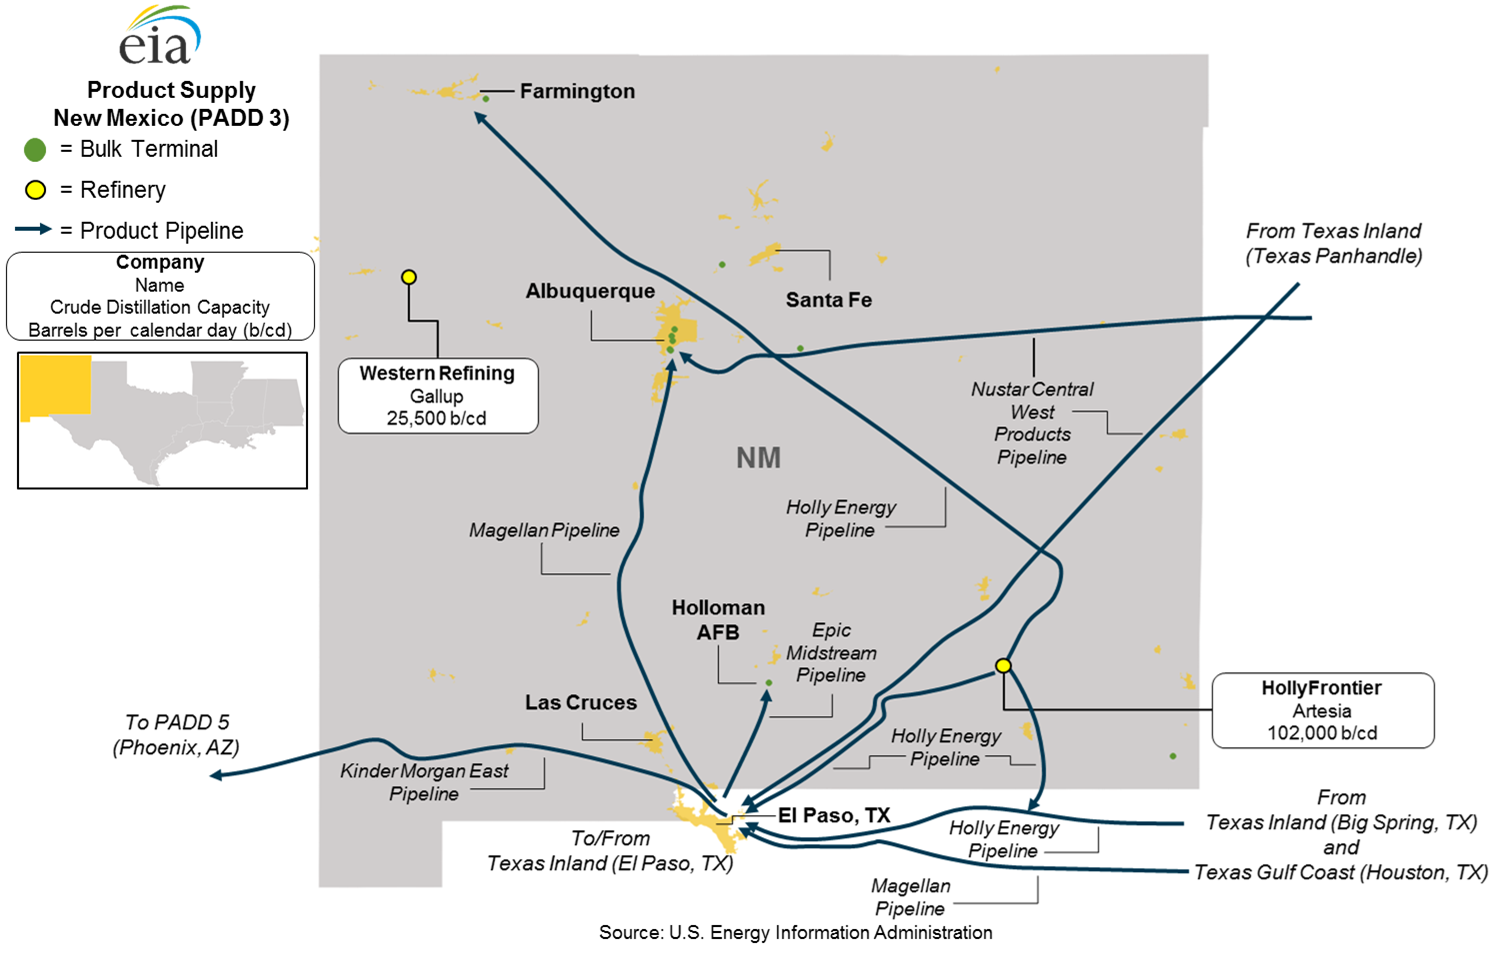
The study considers the East Coast as four distinct regions: New England (PADD 1A), Central Atlantic (PADD 1B), the Southeast, and Florida. The Gulf Coast is divided into five regions: New Mexico, Texas Inland, Texas Gulf Coast, Louisiana Gulf Coast, and North Louisiana-Arkansas.
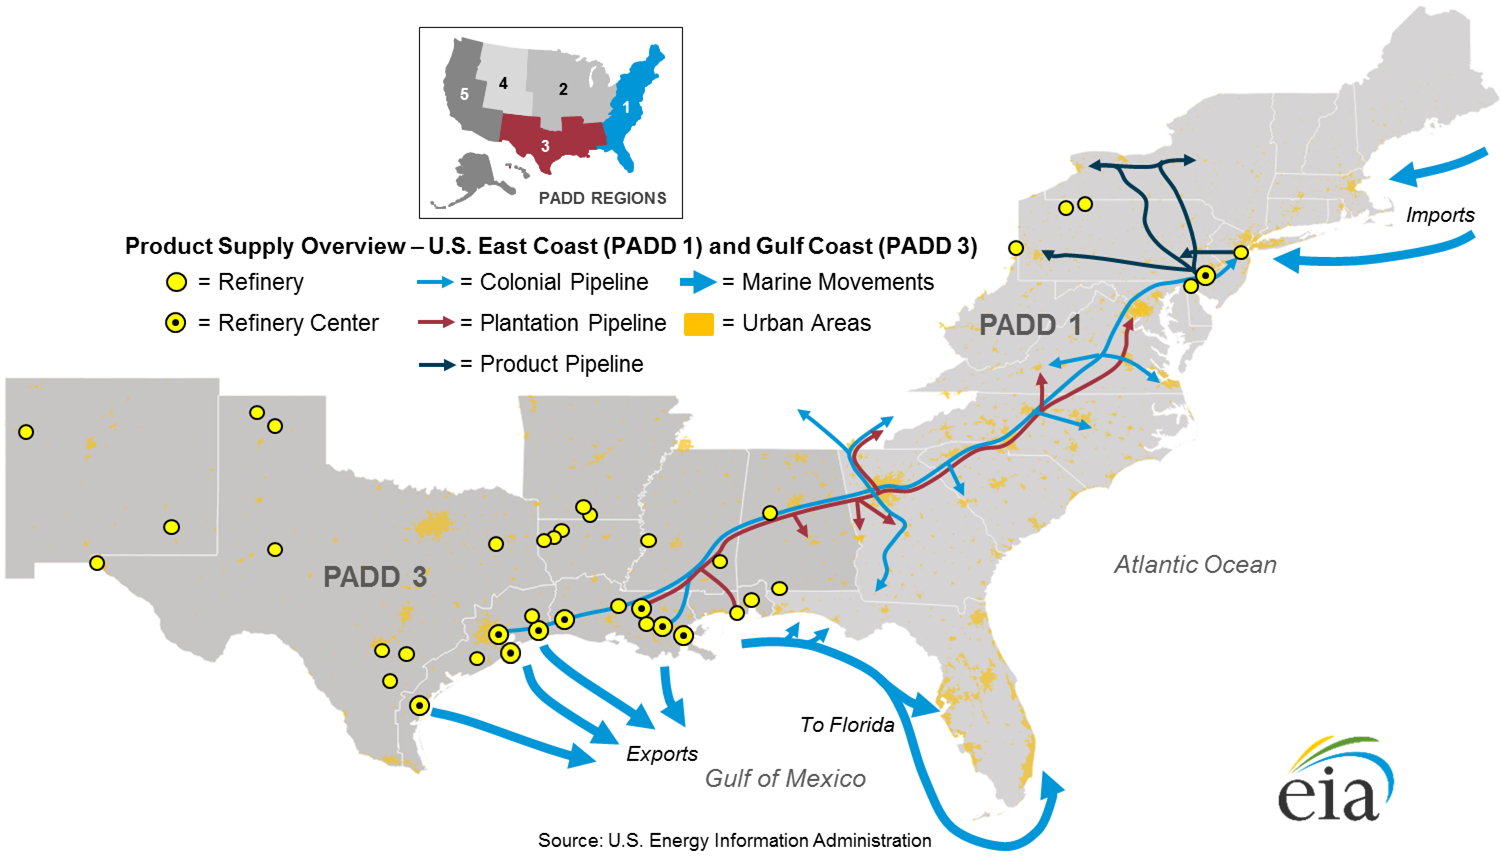
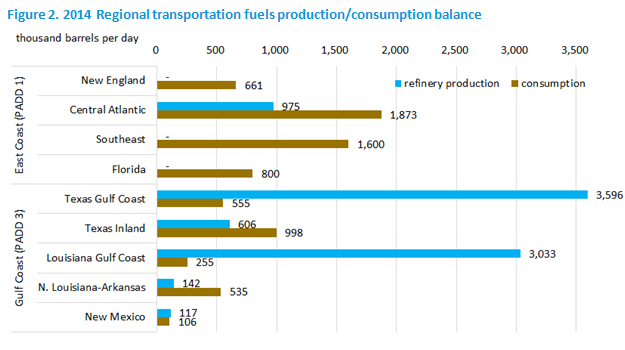
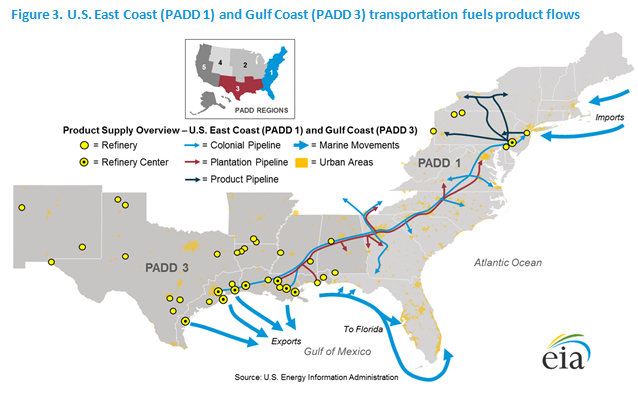
With just over half of total U.S. refining capacity, the Gulf Coast (PADD 3) is the largest domestic supplier of transportation fuels. Regional consumption is less than one-third of in-region production. The East Coast (PADD 1) is the largest transportation fuels consuming region in the country. However, the region’s limited refinery capacity produces transportation fuels to meet just one-fifth of regional consumption (Figure 2). Pipeline infrastructure linking the two PADDs and international trade play key roles in balancing the mismatch between supply and use of transportation fuels within each region (Figure 3).
The study examines transportation fuels supply, consumption, and distribution patterns within the specific sub-PADD regions. The study evaluates the supply, storage, and distribution of transportation fuels from in-region refineries and other domestic sources of supply as well as imports. The study identifies and examines the infrastructure associated with the distribution of transportation fuels including infrastructure associated with refineries, bulk terminals, pipelines, marine movements, as well as other transportation fuel distribution patterns. The study also considers regional supply/consumption balances and includes a discussion of the wholesale and retail market structure for each region.
The U.S. Energy Information Administration (EIA) retained ICF International of Fairfax, Virginia to conduct the research and analysis for the U.S. Gulf Coast and East Coast transportation fuels study, under the general guidance of Lynn Westfall, Director of EIA's Office of Energy Markets and Financial Analysis. ICF International analyzed data and information from EIA, the Army Corps of Engineers Waterborne Commerce Statistics Centers, Airlines for America, The U.S. Environmental Protection Agency, The U.S. Census Bureau, and other publicly available data from various sources. Principal contributors from ICF International are Kevin DeCorla-Souza, Matt Gilstrap, and CeCe Coffey.
This study is the second in a series by EIA to inform its analyses of petroleum product markets, especially during periods of supply disruptions and market change. A previously published study analyzed PADD 5 (West Coast) transportation fuels markets. Planned studies are planned to analyze PADD 5 crude supply and the transportation fuels markets of the Midwest (PADD 2) and Rocky Mountains (PADD 4).