
In California, natural gas helps balance changes in electricity demand and solar output
Note: Data are for the California region, which includes electric power markets regulated by the California Independent System Operator (CAISO) and other balancing authorities operating largely in California.
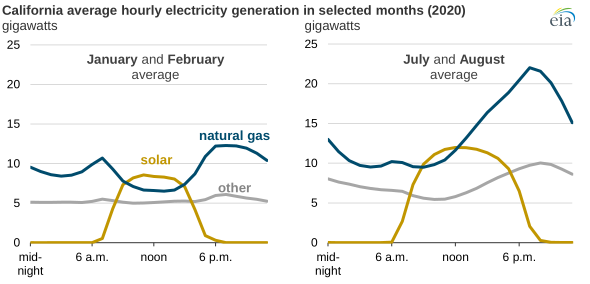
In California wholesale electricity markets, natural gas-fired electricity generation helps to balance fluctuations in electricity demand with daily cycles in solar-powered electricity generation. Natural gas and solar are the two most prevalent sources of electricity generation in California; however, solar generation is non-dispatchable. Grid operators in the state use natural gas and, to a lesser extent, hydroelectricity and electricity imports from neighboring areas to balance changes in electricity demand.
Both demand for electricity and output from natural gas-fired power plants in California are often highest in the afternoon and early evening, between 4:00 p.m. to 7:00 p.m. Output from solar power will peak and then plateau by midday, rapidly declining by the evening as the sun sets. As solar output declines, natural gas-fired generators often have to ramp up, or increase their output, considerably.
Note: Data are for the California region, which includes electric power markets regulated by the California Independent System Operator (CAISO) and other balancing authorities operating largely in California.
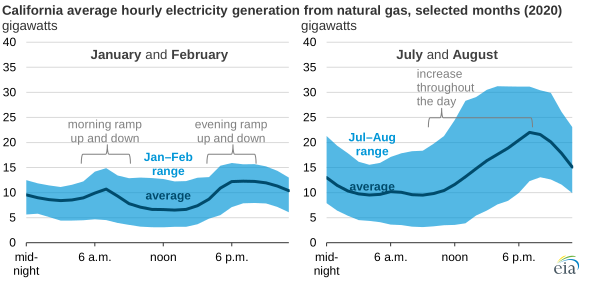
The ramping effort in California is often greatest in the summer months, when air conditioning use increases demand for electricity. According to data from the U.S. Energy Information Administration's (EIA) Hourly Electric Grid Monitor, hourly natural gas-fired generation on a typical summer day (based on the average of July and August 2020) went from 10 gigawatts (GW) for the hour ending at noon to 22 GW for the hour ending at 7:00 p.m.
In the winter months, natural gas power plants go through two cycles: ramping up and down in the morning and again in the evening. California’s hourly natural gas-fired electricity generation in January and February 2020 was often at its lowest point in the middle of the day, when solar-powered generation was at its peak.
EIA’s Hourly Electric Grid Monitor collects information from the California Independent System Operator and other balancing authorities in the state to show daily and hourly electricity generation, interchange, demand, and demand forecasts. Each balancing authority’s total demand data are available on a near real-time basis, about one hour after the hour has ended. Most of the other data elements, such as net generation by energy source and total interchange, are available on a one- to two-day lag.
Principal contributors: Katie Dyl, Owen Comstock
Tags: consumption/demand, electricity, natural gas, solar, California, states