Rising solar generation in California coincides with negative wholesale electricity prices
Note: Distributed solar generation is estimated based on December 2016 installed net-metered capacity as reported in form EIA-826, Monthly Electric Utility Sales and Revenue Report with State Distributions.
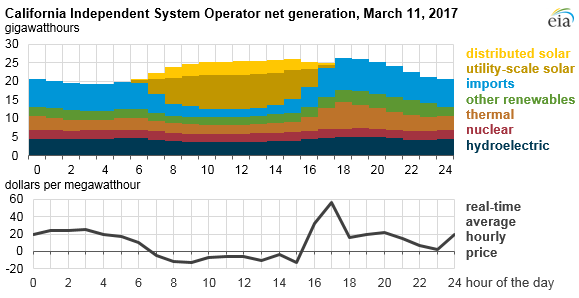
On March 11, utility-scale solar generation in the territory of the California Independent System Operator (CAISO) accounted for almost 40% of net grid power produced during the hours of 11:00 a.m. to 2:00 p.m. This is the first time CAISO has achieved these levels, reflecting an almost 50% growth in utility-scale solar photovoltaic installed capacity in 2016. The large and growing amount of solar generation has occasionally driven power prices on the CAISO power exchange during late winter and early spring daylight hours to very low, and sometimes negative, prices. However, consumers in California continue to pay average retail electricity prices that are among the highest in the nation.
Utility-scale solar generation includes solar photovoltaic (PV) systems as well as a few solar thermal plants. Additional generation from customer-sited solar generators installed in California (such as those on residential and commercial rooftops) further adds to the total solar share of mid-day electricity generation, while displacing demand for power from the grid. As of December 2016, utilities in CAISO reported 5.4 gigawatts (GW) of net-metered distributed solar capacity. (EIA reports installed electric capacity data in alternating current terms, which are typically 10% to 30% lower than the direct current capacities sometimes reported for PV systems.) EIA estimates that this capacity would have generated approximately 4 million kilowatthours (kWh) during the peak solar hours on March 11. This level of electricity reduced the metered demand on the grid by about the same amount, suggesting that the total solar share of gross demand probably exceeded 50% during the mid-day hours.
Total solar capacity in California (including both distributed and utility-scale systems) has grown from less than 1 GW in 2007 to nearly 14 GW by the end of 2016. Solar generation follows daily and seasonal sunlight patterns, peaking during the long summer days and reaching its annual minimum during the winter.
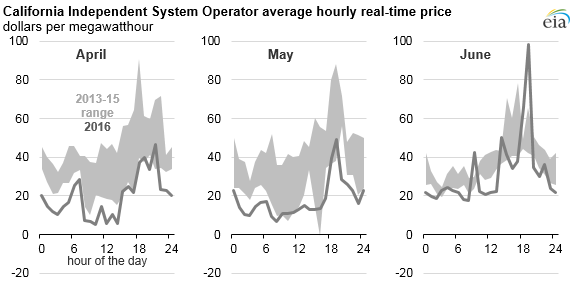
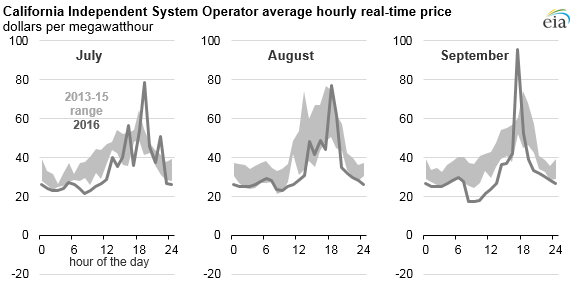
Electricity demand in California also tends to peak during the summer months. However, in late winter and early spring, demand is at its annual minimum, but solar output, while not at its highest, is increasing as the days grow longer and the sun gets higher in the sky. Although the sun is at a similar angle in September and October, electricity demand is still relatively high, leading to lower solar generation shares than seen in March.
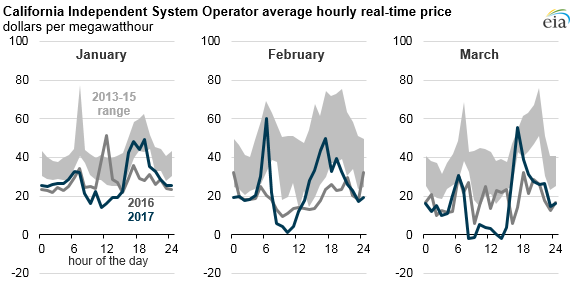
Consequently, power prices on both the day-ahead and real-time CAISO markets were substantially lower in March compared with other times of the year or even March of last year. In March, during the hours of 8:00 a.m. to 2:00 p.m., system average hourly prices were frequently at or below $0 per megawatthour (MWh). In contrast, average hourly prices in March 2013–15 during this time of day ranged from $14/MWh to $45/MWh. Negative prices usually result when generators with high shut-down or restart costs must compete with other generators to avoid operating below equipment minimum ratings or shutting down completely.
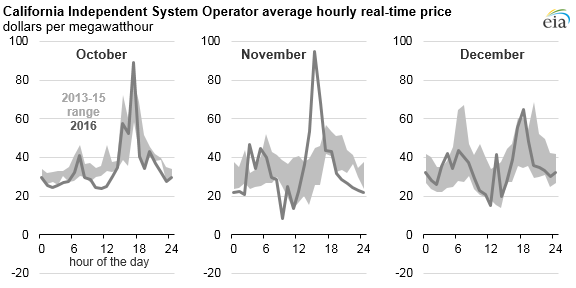
Large price spikes immediately before and after mid-day periods when both utility-scale and distributed solar generation reaches its peak level suggest a need for dispatchable generation sources to help cover ramping periods, when the need for power from the grid to meet load is rapidly changing. Beyond solar output, the mix of generation on the system also affects prices. Notably, above-average rain and snowfall this winter in California has supported high levels of hydropower generation that may also be contributing to recent pricing patterns.
California grid operators have been concerned over the effects of the increase in solar generation on system operations for several years. The generation and pricing patterns that occurred in March and that may continue through the spring highlight some of the issues California grid operators will face in integrating large amounts of solar into their power markets.
Principal contributor: Chris Namovicz
Tags: California, electricity, generation, renewables, solar, states