Global oil markets
Global oil prices
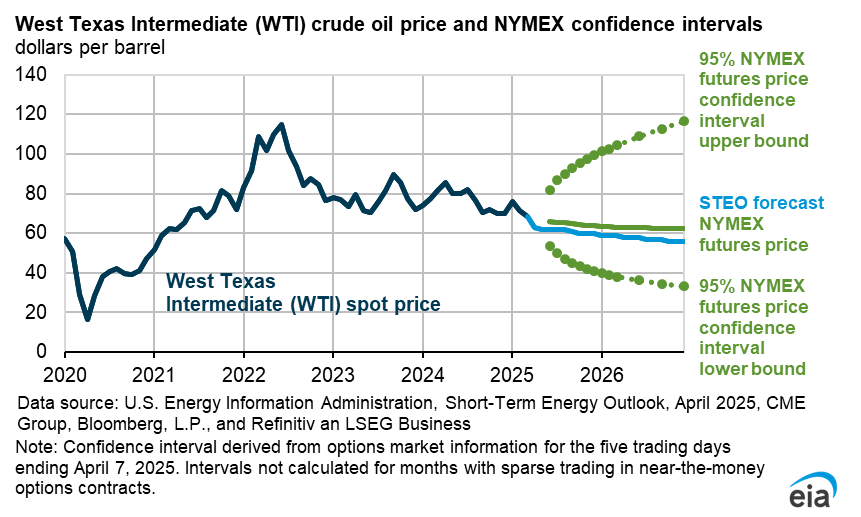
Global oil markets are in a period of heightened volatility and uncertainty due to the de facto closure of the Strait of Hormuz, a major world oil transit chokepoint through which nearly 20% of global oil supply flowed prior to military action that began on February 28. The strait has been effectively closed to shipping traffic since. The Brent crude oil spot price averaged $117 per barrel (b) in April, $46/b higher than the average in February. This monthly average price is also the highest since June 2022, following Russia’s invasion of Ukraine. Daily Brent spot prices reached as high as $138/b on April 7. The closure of the strait has dramatically reduced the availability of oil supplies to global markets and has had cascading effects across oil supply chains.
Daily Brent spot prices increased significantly in April, reflecting the tightness and demand for physical barrels of crude oil for delivery in the very near term. At the same time, front-month Brent futures prices for delivery in June were highly volatile due to significant uncertainty around the length of the disruption. Fewer physical barrels available for near-term delivery helped widen the differential between spot and front-month futures to nearly $30/b early in April, as buyers bid to replace disrupted supplies. Although crude oil prices remained elevated in late April, the two prices trended closer as trade flows adjusted and refiners sourced new supplies.
Since the conflict began in late February, crude oil implied volatility has averaged 78%, based on futures and options contract data from the CME Group, with daily Brent crude oil implied volatility reaching as high as 106% on March 12. Prior to the conflict, implied volatility was generally less than 30% since the beginning of 2024. Recent Brent crude oil implied volatility is the highest it has been since the onset of the COVID-19 pandemic in early 2020.
As the conflict persists, we have adjusted our expectations around the duration of the disruption. We now assume that the Strait of Hormuz will remain effectively closed through late May, with flows slowly starting to resume in late May or early June. Even after flows resume, we expect it will take until late 2026 or early 2027 for most pre-conflict production and trade patterns to resume. However, we anticipate that some producers around the Persian Gulf will not see their production levels return to pre-conflict levels during the STEO forecast period.
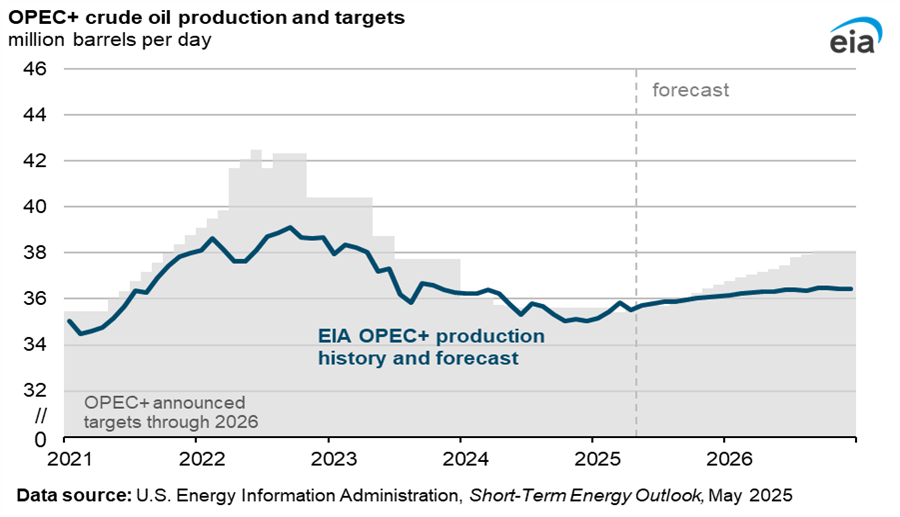
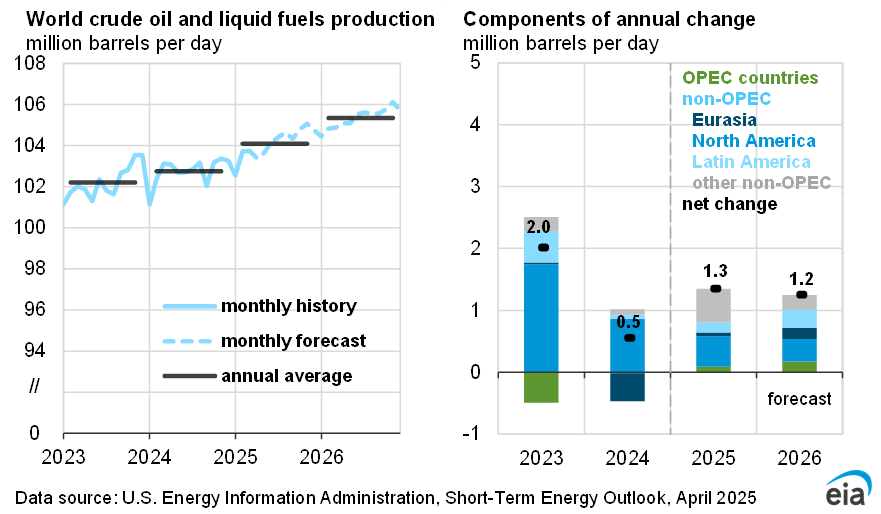
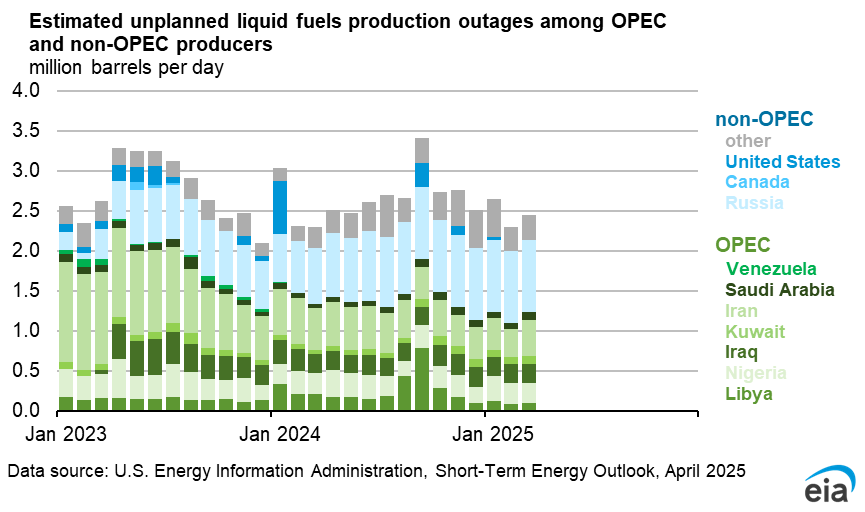
Disrupted crude oil production volumes in the Middle East have increased since our last forecast. We assess that production shut-ins averaged 10.5 million barrels per day (b/d) in April, and we expect they will peak at nearly 10.8 million b/d in May as storage levels reach maximum limits requiring producers to shut in additional volumes. One of the factors driving our increased expectations of shut-in production is that we now forecast Iran will have to reduce production in part due to the U.S. blockade, which has curtailed Iran’s ability to export oil.
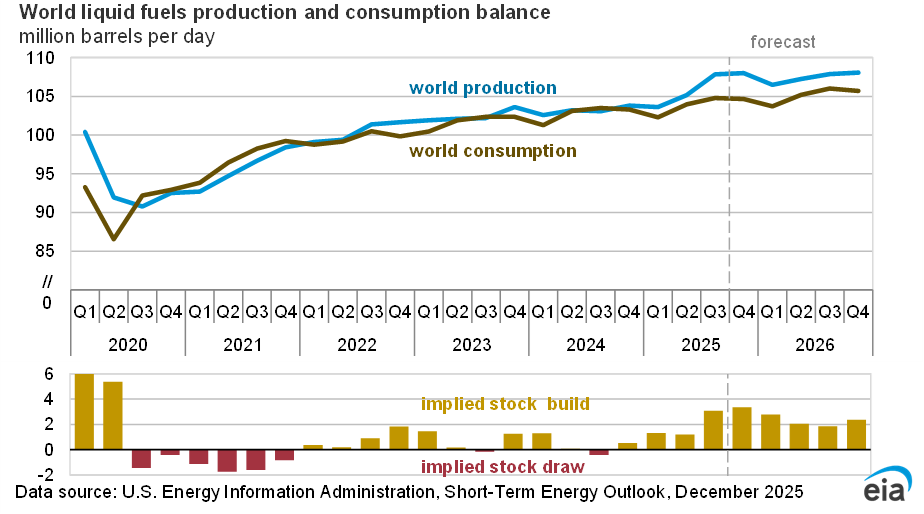
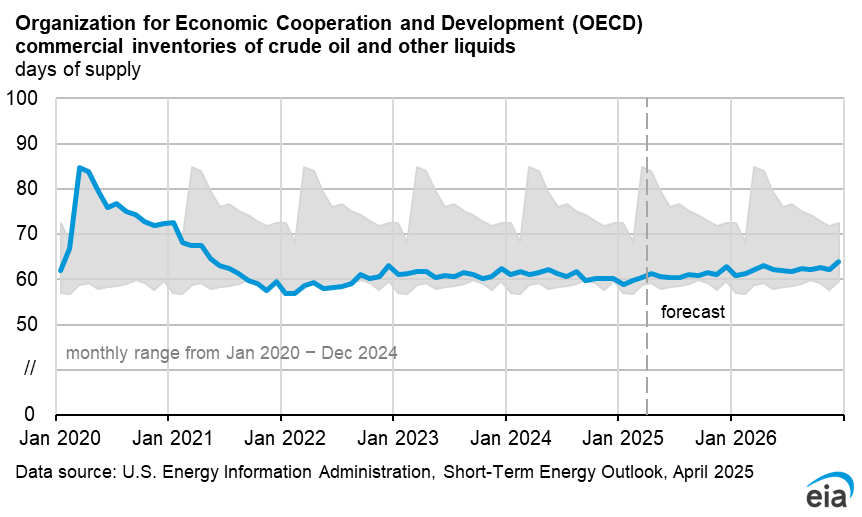
Our initial assessment after the closure of the strait was that, as a result of months of global oversupply and significant global oil inventory builds in on-land and floating storage, the market was well positioned to weather a short-term disruption to oil flows. As the conflict and disruption have persisted, oil inventories have continued to fall. It takes several months for higher oil prices to lead to supply growth for price-responsive producers like shale oil production in the United States, and even longer in other regions.
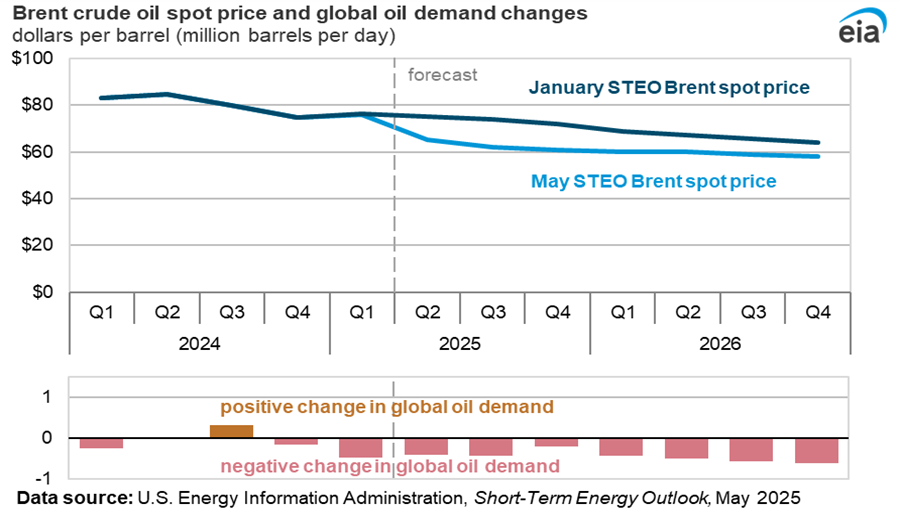
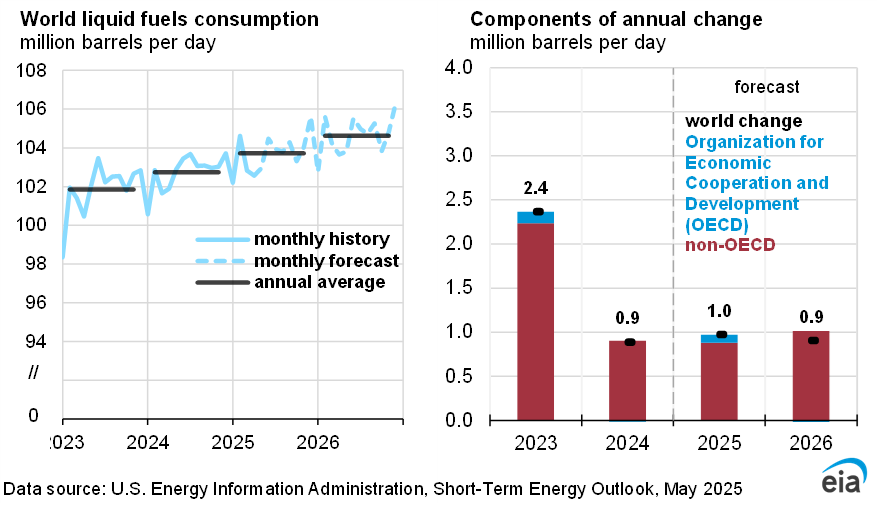
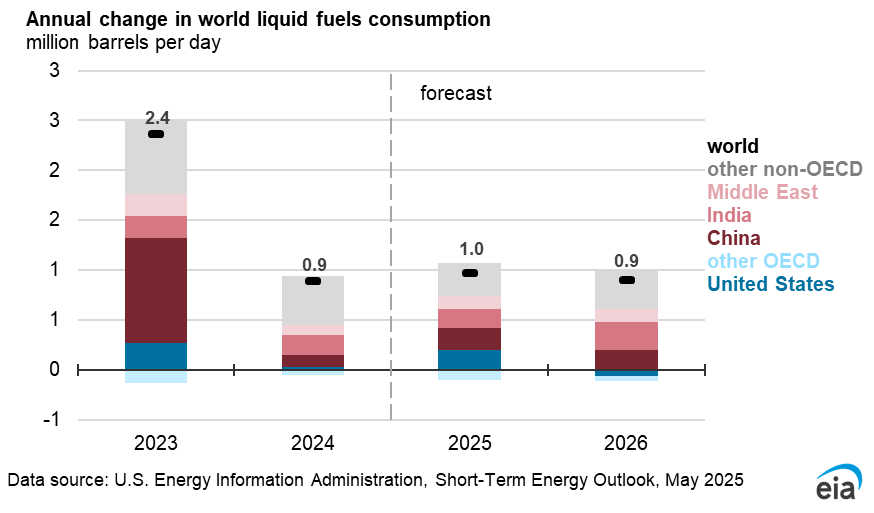
However, oil demand responds much more quickly to high prices. We expect higher prices will bring about a reduction in oil demand, which will help move the oil market towards balance. The longer that shut-in production volumes and disruptions to oil flows persist the larger we expect this price response to be. As a result, we have reduced our expectations around global oil demand growth, based on reports of government initiatives to reduce fuel use, fuel shortages, and the curtailing of refined oil product exports. We assume reductions in demand occur primarily in Asia, which is more reliant on crude oil supplies from the Middle East. As a result, we now assume that global oil demand will increase by an average of 0.2 million b/d in 2026, down from an average of 0.6 million b/d in last month’s STEO, and 1.2 million b/d in our February STEO. We assume oil demand will rebound next year once supply flows return later in 2026, with oil demand growing by 1.5 million b/d in 2027 to 105.6 million b/d.
Although the United States announced a ceasefire in early April, we still assess that oil prices will reflect a larger risk premium throughout the forecast. Traffic through the Strait of Hormuz has largely been at a standstill, both because of the risk of attacks on oil tankers as well as a new U.S. blockade against Iranian oil shipments through the strait.
We estimate that global oil inventories will fall by an average of 8.5 million b/d in 2Q26, pushing Brent crude oil prices to an average of around $106/b in May and June. Once the traffic through the Strait of Hormuz gradually begins to resume in June and shut-in oil production gradually returns, we assume oil prices will begin to fall, decreasing to an average of $89/b by 4Q26 as global oil inventory withdrawals lessen. We assess that most shut-in oil production will be fully restored by January 2027 and that global oil inventories will again start building, helping oil prices gradually lower to an average of $79/b in 2027.
This month’s STEO assumes that the strait reopens in late May. We assessed the impact on oil prices if there was a delay in the reopening of the strait by one month—through late June. This would result in crude oil prices that are more than $20/b higher than our current forecast in the near term. Prices would remain higher than our current forecast through next year, although the difference would narrow over time.
Our forecast includes the U.S. Strategic Petroleum Reserve release announced on March 11 and the collective release of strategic stocks announced by the International Energy Agency.