Electricity, Coal, and Renewables
Summer wholesale electricity
We expect wholesale electricity prices this summer will be lower than last year for much of the country. Lower wholesale electricity prices primarily reflect lower costs of natural gas delivered to power plants, particularly in the western part of the country. Natural gas-fired power plants are often the marginal generator that ultimately determines power prices. Heat waves during the summer months have the potential to cause wholesale electricity prices to temporarily spike higher than in our forecast, which represents a monthly average.
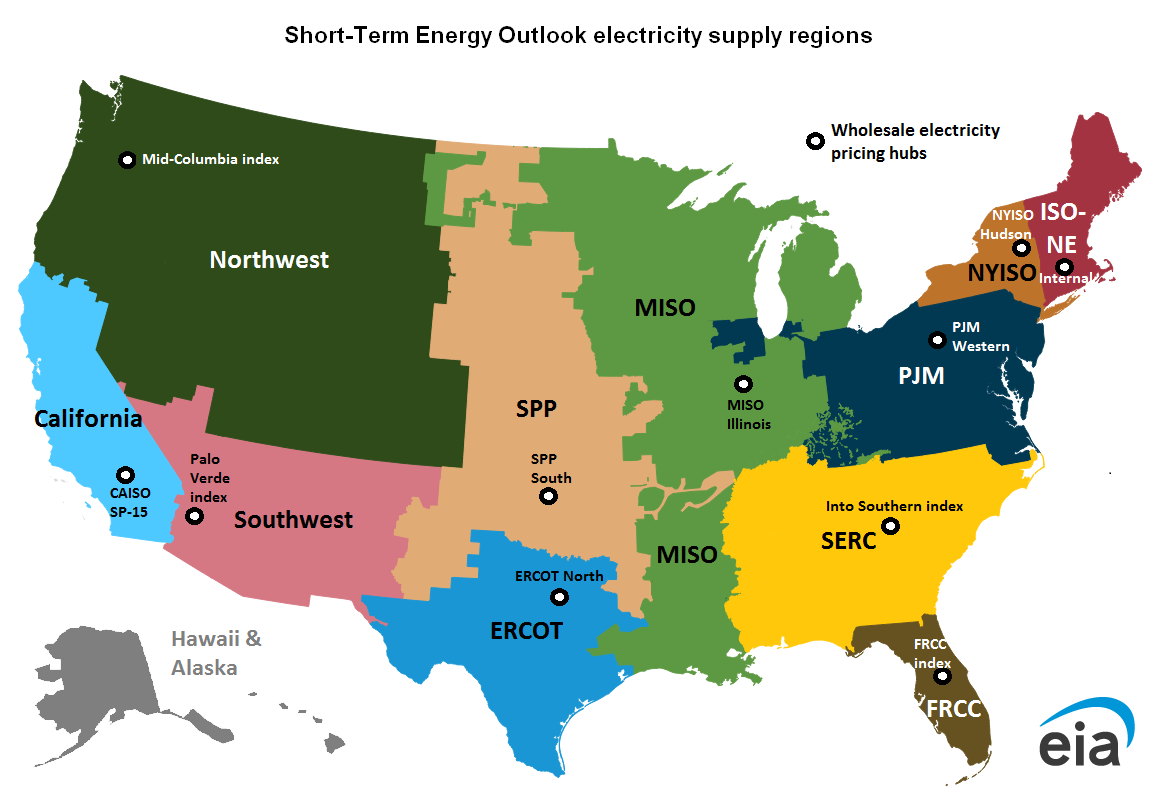
We forecast U.S. wholesale electricity prices this summer will be $4 per megawatthour (MWh) lower than last year, hovering at an average of $45/MWh. Although wholesale prices at most of the 11 hubs we track show only minor changes from last summer, forecast prices at the representative hubs for the three western regions, along with the Midcontinent ISO (MISO) region, show relatively large decreases in our model.
Alongside record natural gas production and low natural gas prices, these large, expected decreases in regional wholesale electricity prices are coincident with increased electric generation from various fuels. In the Northwest Mid-Columbia hub, prices drop 46% from an average of $50/MWh in summer 2025 to $27/MWh this summer, amid a substantial increase in hydropower.
We forecast wholesale power prices in California will fall by 30% and average $23/MWh this summer, and in the Southwest, wholesale power prices fall by 27% and average $28/MWh. Natural gas prices in both of these regions are also relatively low. Prices in the MISO region fall by 18% in our forecast, from an average of $56/MWh last summer to $46/MWh this summer. In MISO, we expect large increases in solar generation, in particular, alongside increases from natural gas, wind, solar, and nuclear.
Coal markets
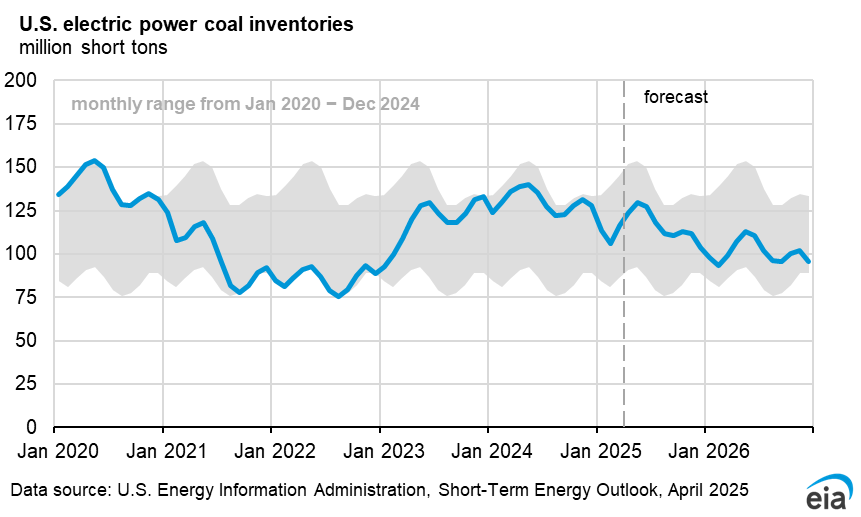
Stocks of coal held by coal-fired electric power plants tend to decrease during the summer months as seasonal demand for the fuel for electricity generation outpaces supply. U.S. coal stocks began summer 2026 significantly higher than last year after reduced coal generation during the spring months, compared with the same period last year. We estimate that coal stocks held by the electric power sector at the end of May totaled 126 million short tons (MMst), 6% more than in May 2025.
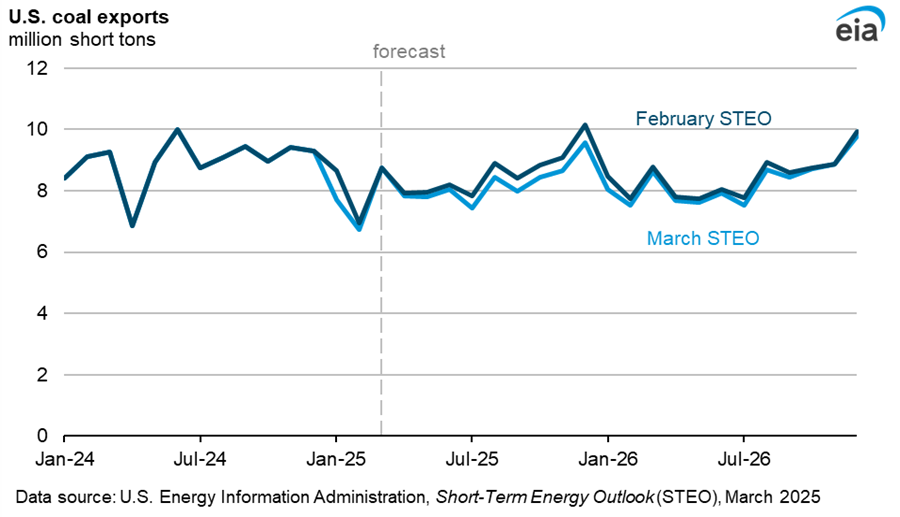
Between May 2025 and September 2025, coal stocks fell by 14 MMst (12%) as a result of relatively strong demand for power generation. We expect reduced demand for coal from power generators this summer, which means generators will not draw down coal stocks as much as last summer. Forecast coal-fired electricity generation during summer of 2026 is 6% lower than last summer. Consequently, we expect that stocks at the end of September will be 12 MMst (10%) lower than May 2026.
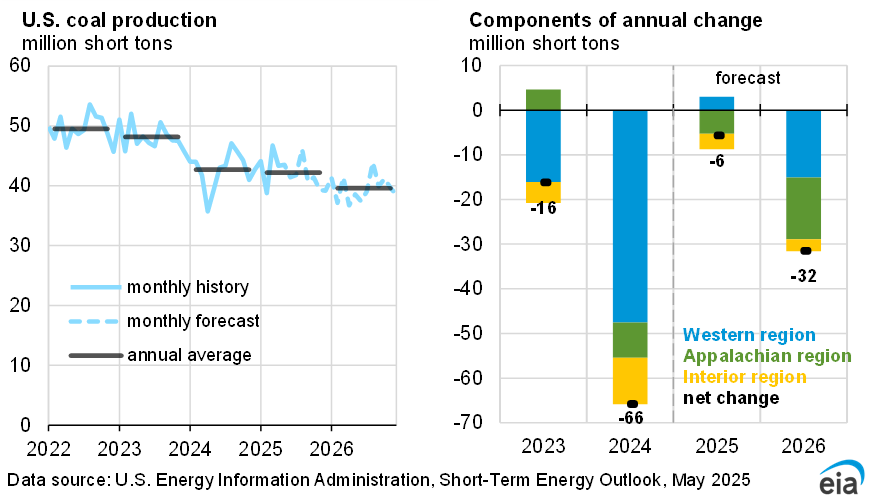
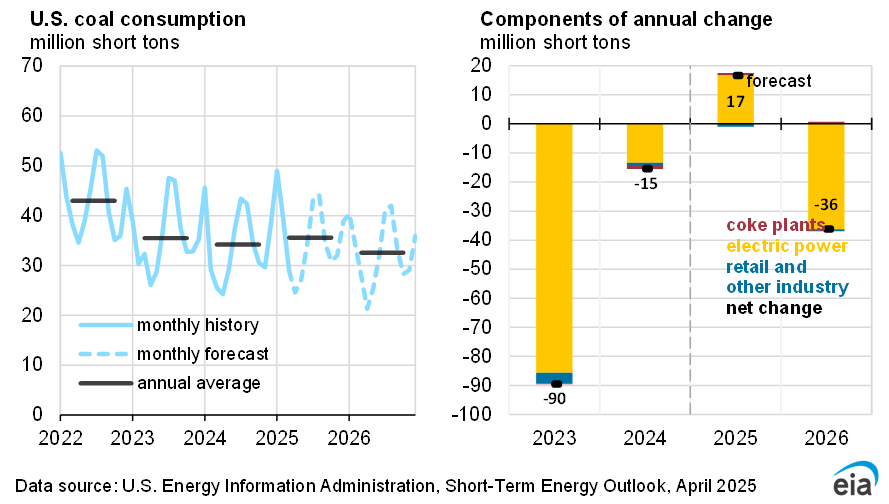
On an annual basis, we expect the U.S. electric power sector will consume 9% (38 MMst) less coal in 2026 than in 2025. Forecast annual coal production in 2026 is declining as well by 17 MMst. The faster decline in demand than the decline in supply contributes to our expectation that electric power sector coal stocks at the end of 2026 will be 6% higher than the end of 2025. We forecast that both coal production and power sector coal consumption will decline in 2027 by 4% and 3%, respectively.