Natural gas
Natural gas consumption in the electric power sector
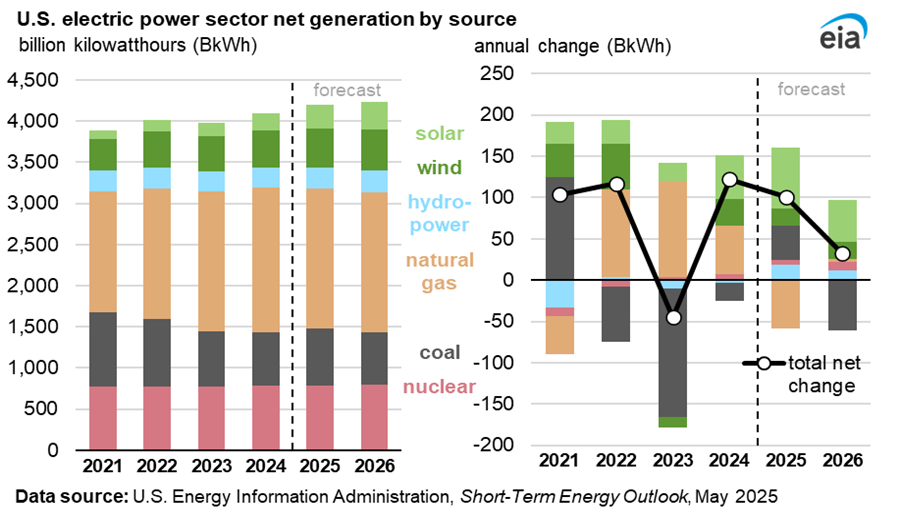
Natural gas consumption in the U.S. electric power sector is the primary source of natural gas consumption in the summer, as electricity is used to meet demand for air conditioning during warmer weather months. We forecast natural gas consumed to generate electricity in the United States will average 38.4 billion cubic feet per day (Bcf/d) in June, up 26% from May. U.S. natural gas consumption in the electric power sector in May was down 9% from last year, as milder weather kept consumption levels relatively low.
Our forecast assumes 3% more cooling degree days (CDDs) than the 10-year average across the United States from June through September and about the same number of CDDs as last year during those months. Despite similar temperatures compared with last year, we expect the power sector will consume 3% less natural gas this summer than it did last summer. The drop in natural gas-fired generation largely reflects our expectation that natural gas prices will be higher this summer compared with last year. We expect the price of natural gas delivered to the power sector to average about $3.84/MMBtu from June through September, $1.39/MMBtu more than that period in 2024. At the same time, the price generators pay for coal will be almost unchanged.
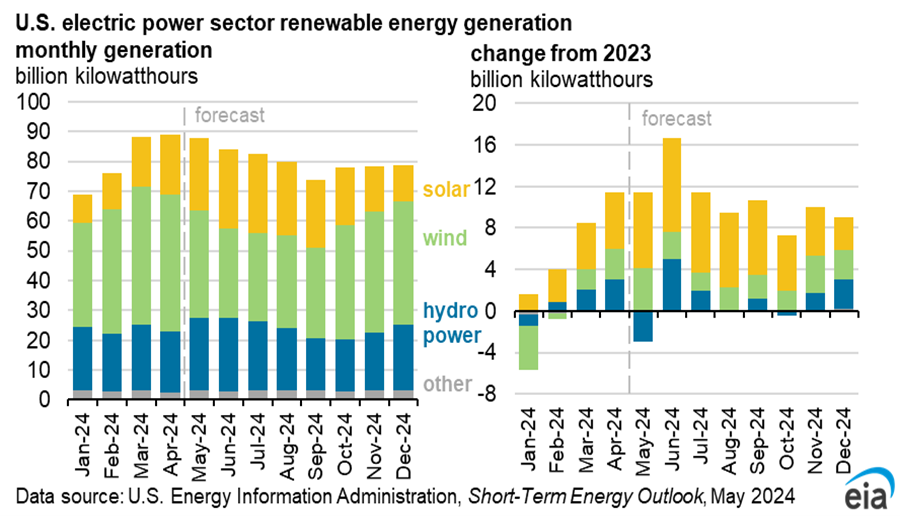
The increasing availability of electricity generation from renewable sources also constrains growth in natural gas consumption beyond last year’s levels.
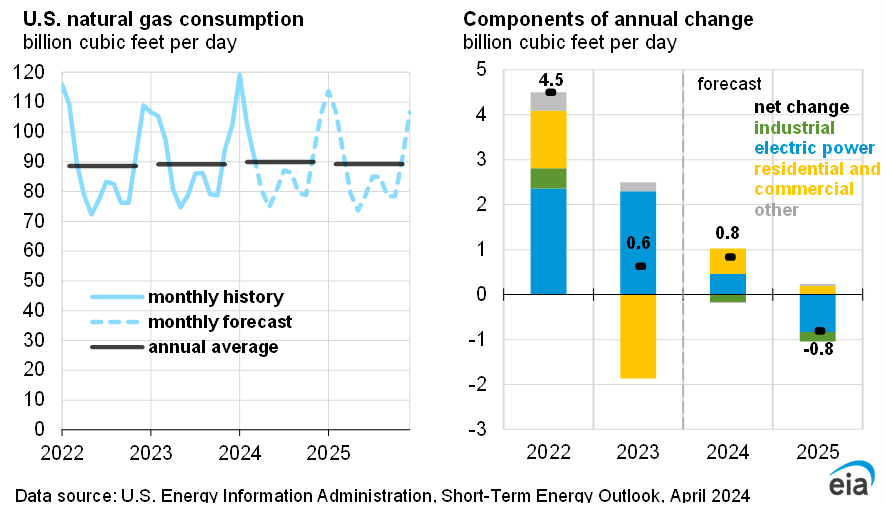
In 2025, we forecast overall natural gas consumption in the United States to be about 1% more than last year, averaging 91 Bcf/d, with increases across the major sectors except for electric power. Relatively cold weather across most of the country during 1Q25 increased demand particularly in the residential and commercial sectors, supporting increased consumption for the year.
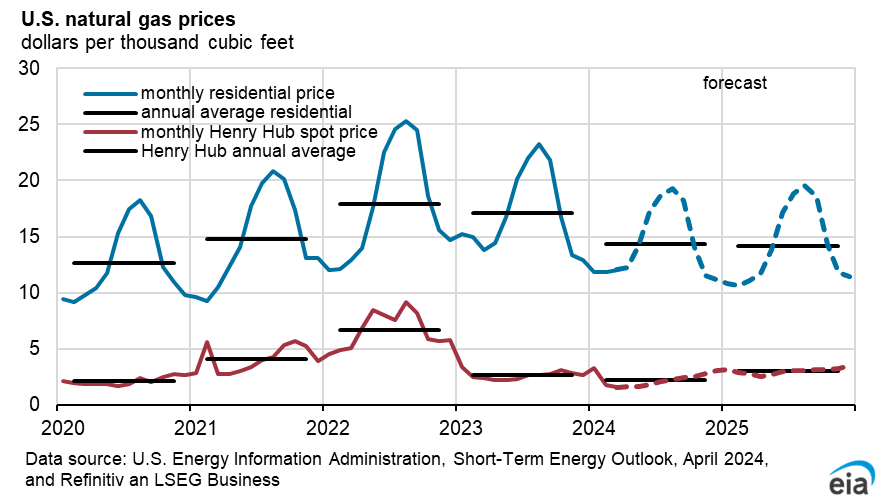
Natural gas prices
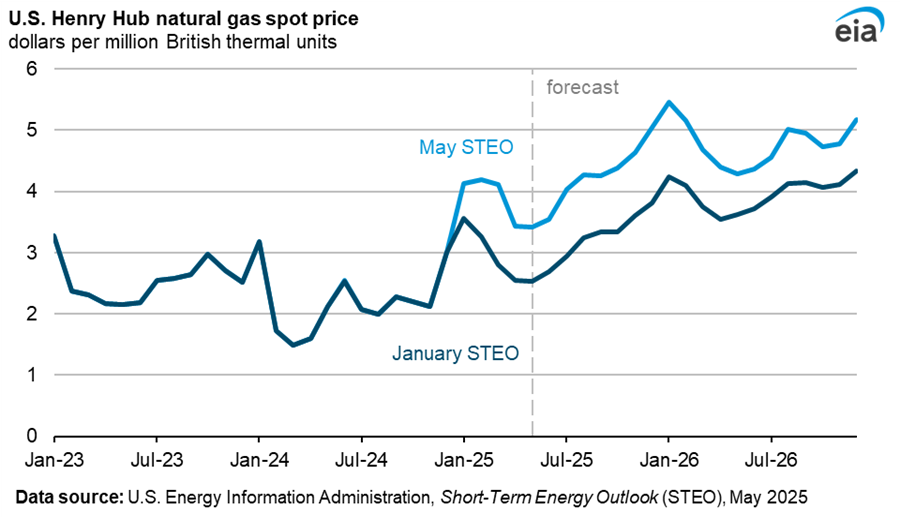
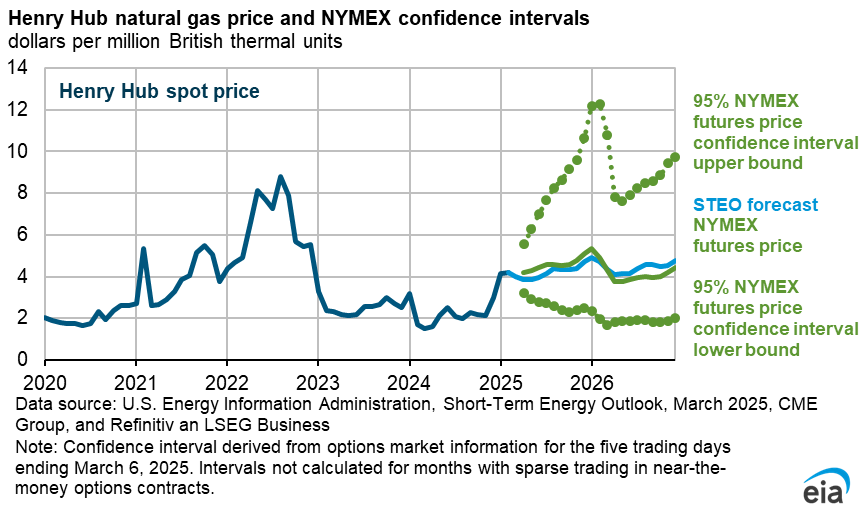
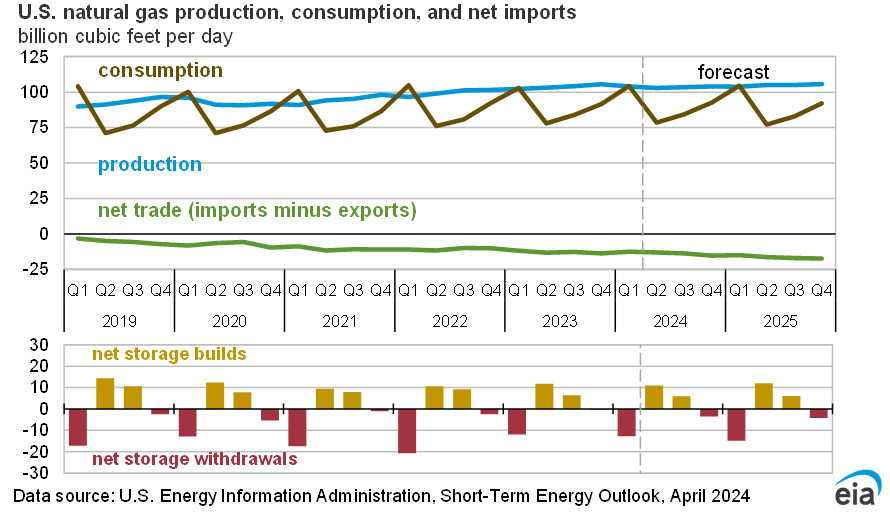
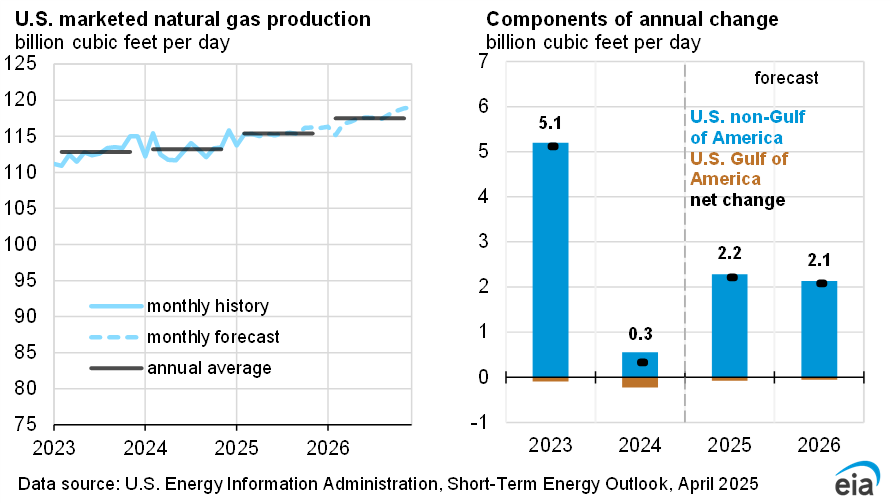
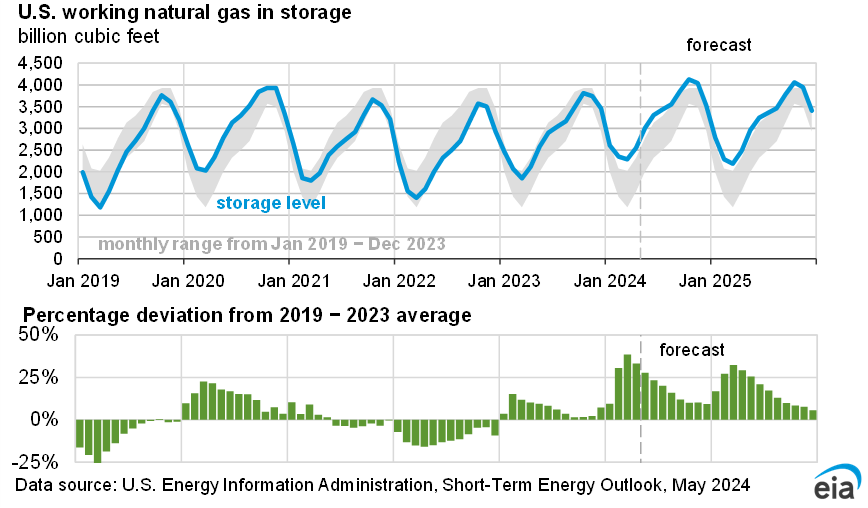
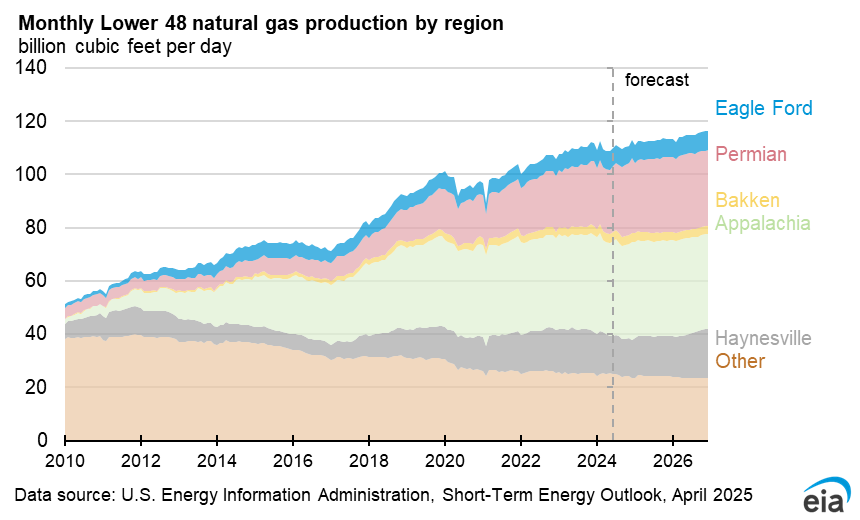
We expect natural gas prices to increase throughout the summer as production declines slightly and demand for air conditioning increases the use of natural gas in the electric power sector. The Henry Hub spot price in our forecast averages more than $4.30/MMBtu in the second half of 2025, up from the May average of $3.12/MMBtu. The average natural gas price at the Henry Hub in our forecast rises by more than 80% in 2025 compared with 2024. We expect that domestic consumption and exports combined will increase by nearly 4 Bcf/d this year, while U.S. dry natural gas production grows by less than 3 Bcf/d. Although natural gas inventories have recently moved above the five-year average, we expect that as demand persistently outpaces supply through much of this year, inventories will fall back below the five-year average by October, putting upward pressure on prices.