Petroleum products
U.S. wholesale product prices
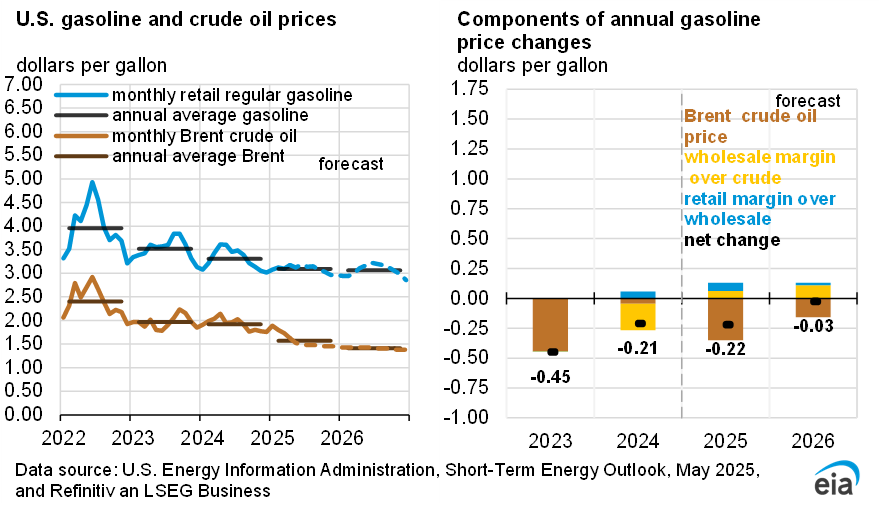
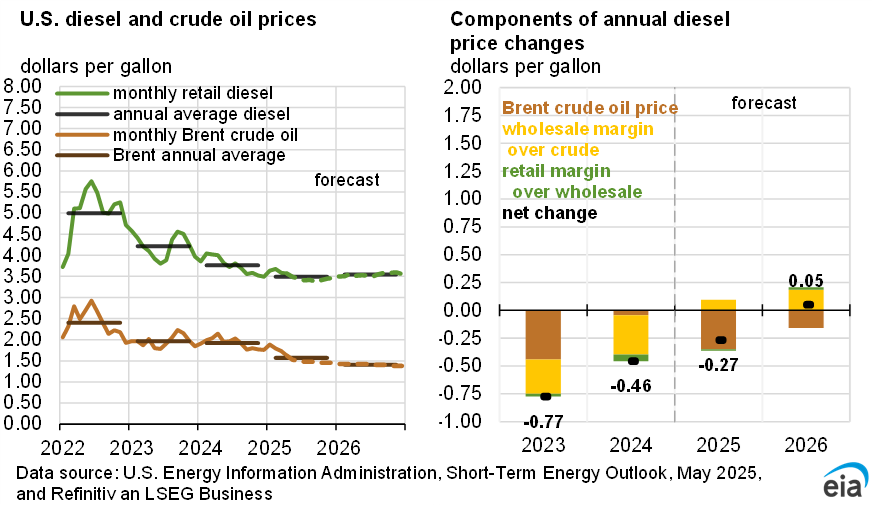
Higher crude oil prices have increased wholesale gasoline, diesel, and jet fuel product prices in the United States. The largest price changes are in the second quarter of 2026 (2Q26) due to supply concerns related to the de facto closure of the Strait of Hormuz, particularly for diesel and jet fuel.
We forecast an average wholesale gasoline price of $2.98 per gallon (gal) in 2026, an almost $1.00/gal increase from the February STEO, and an average price of $2.61/gal in 2027, a $0.70/gal increase from the February STEO. Our forecast for diesel prices is $3.40/gal in 2026 and $2.98/gal in 2027, which are $1.34/gal and $0.89/gal higher, respectively. For jet fuel, prices increase by $1.42/gal for 2026 and $0.89/ga for 2027, with average prices of $3.37/gal and $2.86/gal, respectively.
The primary driver of the increase in wholesale prices is rising crude oil prices. The Brent crude oil spot price rose sharply in March and April, rising from an average of $71 per barrel (b) in February to reach an average of $117/b for April. The Brent price fell to an average of $107/b for May. This brings the 2026 annual average to $95/b, representing the highest annual average price since 2022, following Russia’s invasion of Ukraine.
In addition to higher crude oil prices, petroleum product prices have also increased because of higher refinery margins. Refinery margins have increased particularly for diesel and jet fuel because of a need in Europe and Asia to replace volumes previously supplied through the Strait of Hormuz.
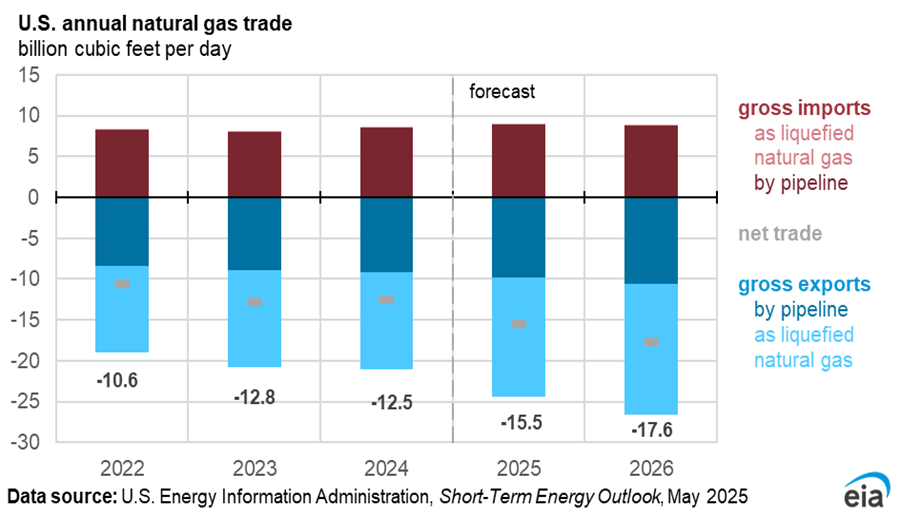
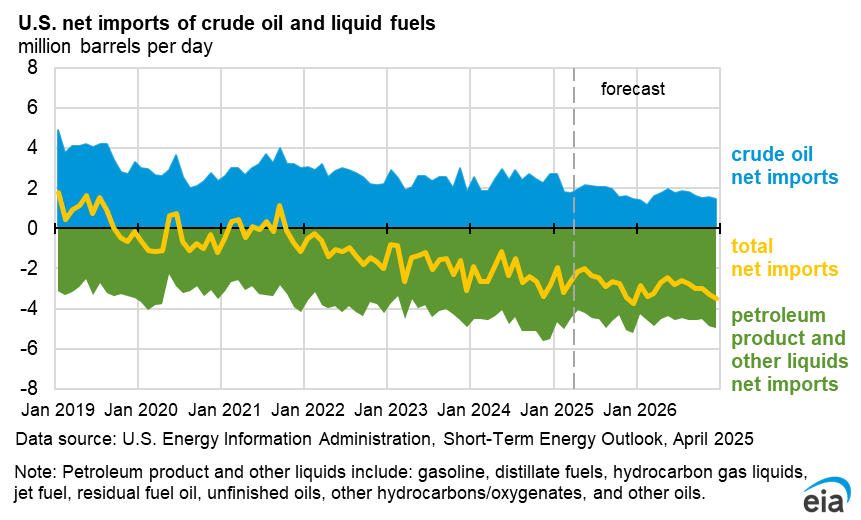
U.S. petroleum net exports
With both crude oil and petroleum product oil flows through the Strait of Hormuz disrupted, many countries are turning to the United States for supply. Since March, we estimate the United States has exported an average of 6.2 million b/d more petroleum products—not including crude oil—than it has imported. Our April estimate of 6.3 million b/d net exports would be the highest on record. We forecast that net exports of petroleum products will average 5.6 million b/d in 2026, up 0.6 million b/d from 2025 and the most of any year on record.
Countries have been securing U.S. diesel and jet fuel to prevent shortages. We forecast the United States will export a net of 1.5 million b/d of distillate fuel in 2Q26, up 27% from the same quarter last year. U.S. net exports of jet fuel average 0.3 million b/d in our forecast for 2Q26, compared with about 0.1 million b/d in 2Q25.
Many global refineries have also sought alternative sources of crude oil supply as well, such as crude oil from the United States. As a result, the United States exported almost as much crude oil as it imported in April. Data from our Weekly Petroleum Status Report show, the United States imported 5.6 million b/d of crude oil over the four weeks ending May 1, which is the least in any month since February 2021, when oil demand was still reduced because of the pandemic. Meanwhile, weekly data show the United States exported 5.4 million b/d of crude oil over the same four weeks, which would be the most on record. We expect U.S. net crude oil imports to average 1.4 million b/d in 2026, down 0.8 million b/d from last year.
In our forecast, we expect global oil trade will return to more historically typical patterns once oil flows resume through the Strait of Hormuz. The return of more typical oil flows will reduce international demand for U.S. crude oil and petroleum products. We expect that this year the U.S. net exports of total crude oil and petroleum products will average 4.2 million b/d, but we forecast it will drop to 3.9 million b/d in 2027. However, our forecast for total net exports in 2027 remains higher than the 2.8 million b/d of net exports registered in 2025.