Where is natural gas found?
A natural gas reservoir is a location where natural gas is trapped in the subsurface of the earth. These reservoirs are made up of porous and permeable rocks that can hold significant amounts of natural gas that is confined by impermeable rock or water barriers.
What are proved reserves?
Proved reserves are estimated volumes of natural gas resources that analysis of geological and engineering data demonstrates with reasonable certainty are recoverable under existing economic and operating conditions. Proved reserves estimates could increase each year when successful exploratory wells are drilled and as more information is obtained about fields where current wells are producing natural gas. New and improved production techniques or technologies and rising natural gas prices can change previously uneconomic natural gas resources into proved reserves. Because they depend on economic factors, proved reserves shrink or grow with changes in wholesale (spot) natural gas prices and production costs. We base our estimates of proved reserves on analysis of data collected annually from domestic oil and natural gas well operators.
How large are U.S. proved natural gas reserves?
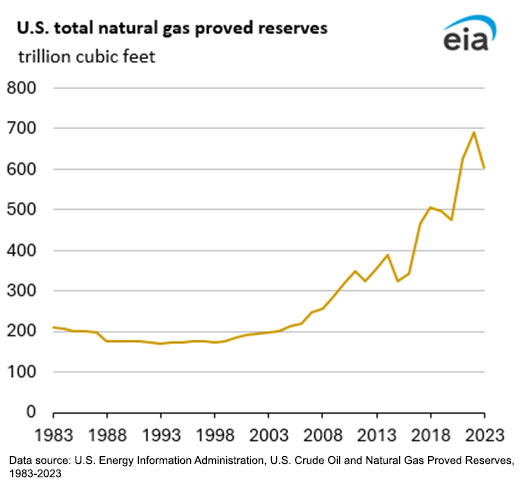
U.S. natural gas proved reserves have increased nearly every year since 2000. Major advances in natural gas exploration and production technologies, such as horizontal drilling and hydraulic fracturing in shale, sandstone, carbonate, and other tight geologic formations, contributed to increases in natural gas production and reserves.
According to U.S. Crude Oil and Natural Gas Proved Reserves, Year-end 2023, as of December 31, 2023, U.S. total natural gas proved reserves—estimated as wet gas—was about 604 trillion cubic feet (Tcf), a 13% decline from their 2022 record of 691 Tcf.
Wet gas is the volume of natural gas remaining after lease condensate, if any, is removed at lease and field separation facilities and after nonhydrocarbon gases are excluded when they occur in sufficient quantity to render the gas unmarketable. The dry natural gas portion of these reserves was about 566 Tcf, a 13% decrease from the 653 Tcf in 2022.
What are technically recoverable resources?
A common measure of the long-term viability of U.S. domestic natural gas and crude oil as energy sources are the remaining technically recoverable resources (TRR), which consist of proved reserves and unproved resources.1 Estimates of TRR are highly uncertain, particularly in emerging plays where relatively few wells have been drilled.
We publish TRR estimates in the Annual Energy Outlook within the Assumptions to Annual Energy Outlook Oil and Gas Supply Module based on the latest available well production data and information from other federal and state governmental agencies, industries, and academia.
1 Unproved resources include resources that have been confirmed by exploratory drilling. They include undiscovered resources that are located outside oil and natural gas fields where exploratory drilling has confirmed the presence of resources. Unproved resources also include resources from undiscovered pools within confirmed fields when they occur as unrelated accumulations controlled by distinctly separate structural features or stratigraphic conditions.