In 2016, U.S. energy expenditures per unit GDP were the lowest since at least 1970
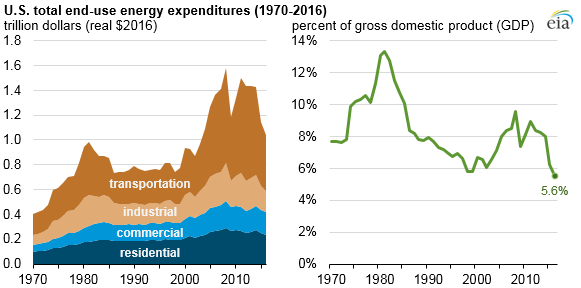
U.S. energy expenditures declined for the fifth consecutive year, reaching $1.0 trillion in 2016, a 9% decrease in real terms from 2015. Adjusted for inflation, total energy expenditures in 2016 were the lowest since 2003. Expressed as a percent of gross domestic product (GDP), total energy expenditures were 5.6% in 2016, the lowest since at least 1970.
Total U.S. GDP is calculated as the total value of goods and services produced in the United States including energy, and was $18.6 trillion in 2016, 1.5% (in real terms) higher than 2015 levels. U.S. GDP has grown every year since 2010, and U.S. total energy expenditures, which is the amount of money spent to consume energy in the United States, has decreased each year since 2011, leading to the record-low energy expenditure share.
The decrease in total U.S. energy expenditures in 2016 was entirely attributable to lower energy prices, as total energy consumption has remained virtually unchanged since 2013. The U.S. average energy price was $15.92 per million British thermal units (Btu) in 2016, down 9% from 2015, and the lowest since 2003, when adjusted for inflation. Average energy prices reached their highest point on record in 2008, when they averaged $24.13 per million Btu.
Based on realized prices in 2017 and some months in 2018, EIA does not expect the downward energy price trend to continue, as average energy prices of products such as motor gasoline, natural gas, and retail electricity have all increased since 2016, contributing to higher U.S. energy expenditures since that year.
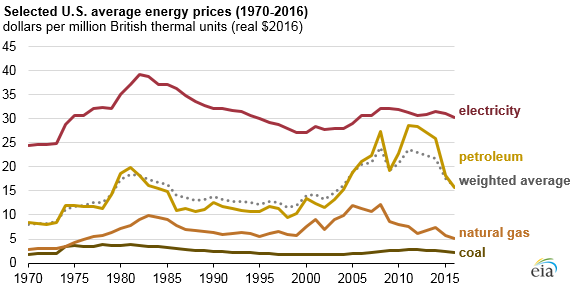
Note: Does not include nuclear, biomass, and coal coke, but those fuels are reflected in the weighted average.
The U.S. total energy price is calculated as the consumption-weighted average prices of all energy sources consumed in each of the four end-use sectors: transportation, industrial, residential, and commercial. The transportation and industrial sectors, the two largest end-use consuming sectors, account for most of the petroleum product consumption in the United States. For this reason, U.S. energy expenditures are heavily influenced by prices of petroleum products such as motor gasoline, distillate fuel oil, and hydrocarbon gas liquids. Expenditures on electricity, which were also relatively low in 2016, made up 74% of residential expenditures, 80% of commercial expenditures, and 37% of industrial expenditures.
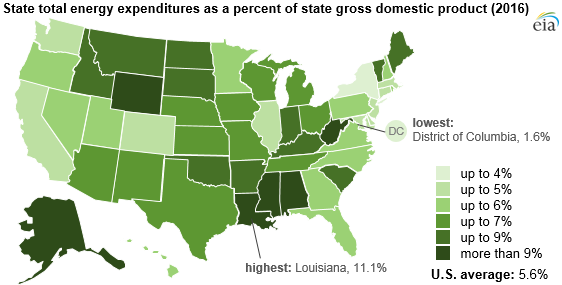
At a state level, Louisiana had the highest energy expenditures per GDP of any state with 11.1% in 2016. Historically, Louisiana has had the highest energy expenditures per GDP of any state every year since 1997, the earliest year in EIA’s data series on this topic. Louisiana’s large industrial sector consumption, which includes its energy-intensive petrochemical industry, contributes to the state’s relatively high ratio. Even while leading the nation, Louisiana saw a record-low ratio of energy expenditures per GDP that was less than half of the state’s previous high (26.5%), reached in 2008.Overall, every state saw lower expenditures per GDP in 2016 compared to 2015, and 24 states and the District of Columbia reached their lowest ratio on record in 2016.
Mississippi (10.8%), Wyoming (10.5%), West Virginia (9.9%), and Alabama (9.4%) have the next highest state energy expenditures per GDP, which reflect a combination of relatively large state industrial sector consumption, including the energy-intensive coal mining industries in Wyoming and West Virginia, as well as relatively low GDP in each state. The District of Columbia (1.6%), New York (3.3%), Massachusetts (4.3%), California (4.3%), and Delaware (4.4%) have the lowest energy expenditures per GDP. This reflects relatively high consumption in less energy-intensive residential and commercial sectors as well as relatively high state GDP.
EIA’s State Energy Data System (SEDS) contains a complete set of state-level estimates of energy production, consumption, prices, and expenditures through 2016.
Principal contributor: Mickey Francis
Tags: commercial, total energy, industrial, states, map