Global oil markets
Global oil prices and inventories
The Brent crude oil spot price averaged $82 per barrel (b) in June, unchanged from May. Prices fell to $75/b on June 4 following the OPEC+ meeting on June 2, when the group announced that 2.2 million barrels per day (b/d) of voluntary cuts would gradually be unwound beginning in the fourth quarter of 2024 (4Q24). Prices fell following this announcement as market participants assessed that unwinding production cuts could cause a significant increase in global oil inventories. The Brent crude oil spot price has since reached $88/b as of July 3, as market participants have reassessed the announcement based on current global inventory levels and the indication by OPEC+ that production cuts remain subject to market conditions.
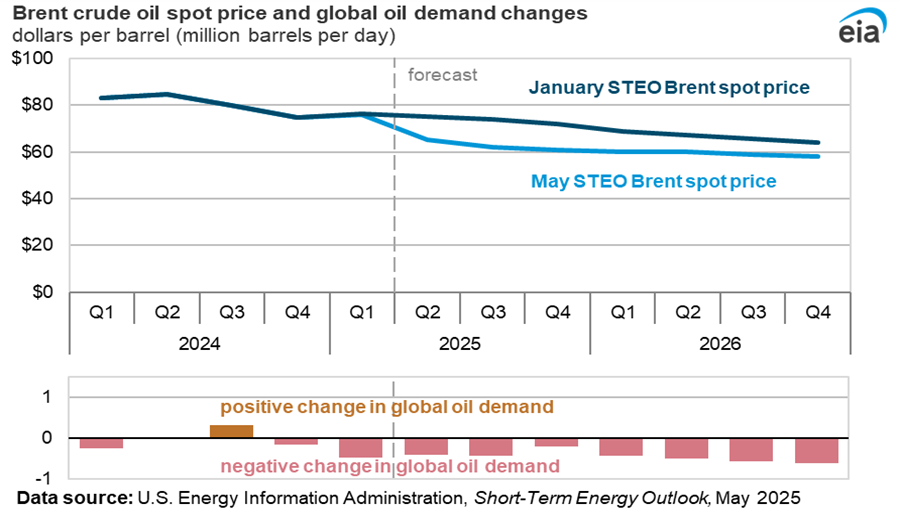
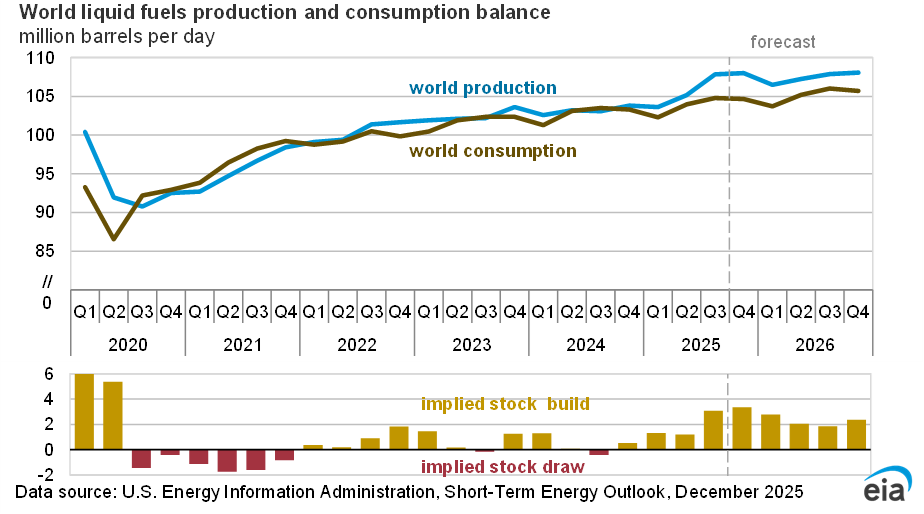
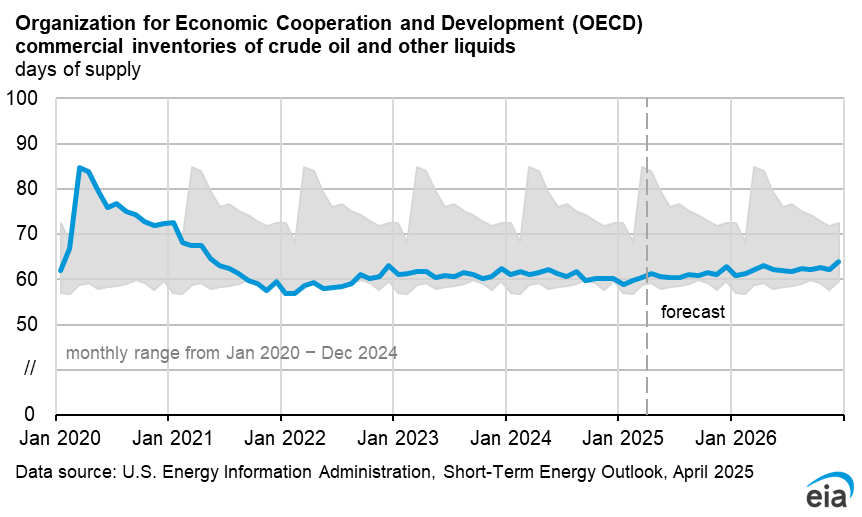
We expect oil prices will increase from an average of $82/b in June to $89/b for the remainder of 2024 and $91/b in 1Q25. Total oil inventories in the OECD remain near the lower bound of their recent five-year range (2019–2023). We expect that OPEC+ will produce less crude oil than the group’s announced targets through the rest of the forecast period, which will reduce global oil inventories through mid-2025 and keep OECD inventories near the bottom of the range. Global oil inventories decreased by an estimated 0.6 million b/d in 2Q24, and we expect they will decrease by 0.8 million b/d on average from 3Q24 through 1Q25.
We anticipate that the market will gradually return to moderate inventory builds in 2025 after the expiration of voluntary OPEC+ supply cuts in 4Q24 and after forecast supply growth from countries outside of OPEC+ begins to offset growth in global oil demand. Beginning in 3Q25 we estimate that global oil inventories will increase at an average of 0.3 million b/d and will increase by 0.4 million b/d in 4Q25. We forecast the Brent price will average $88/b in 2025, as growing inventories reduce oil prices in the second half of next year.
Uncertainty remains around heightened tensions in the Middle East, and an escalation in Houthi attacks on shipping vessels around the Red Sea. These attacks have largely cut off the shipping channel for many oil shipments. Although these attacks have yet to directly reduce oil supply, the potential for further escalation and the lack of any potential resolution around the Red Sea attacks has added higher shipping costs and an ongoing risk premium to oil prices in the near term.
Global oil production and consumption
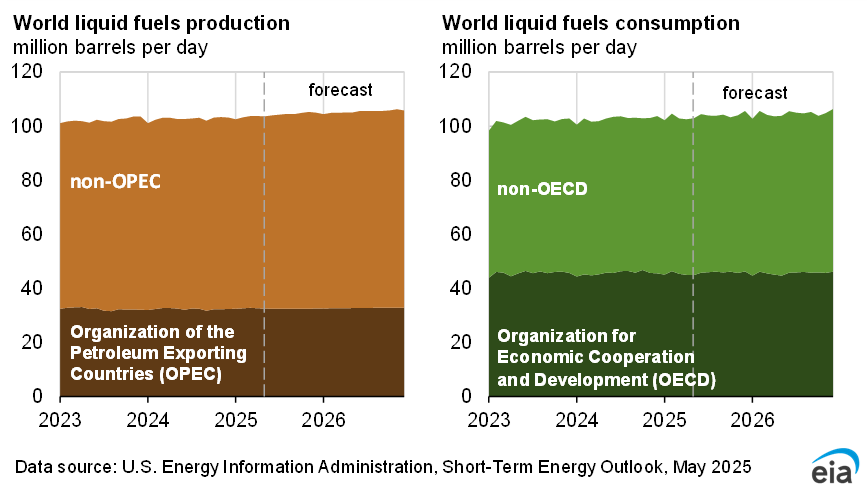
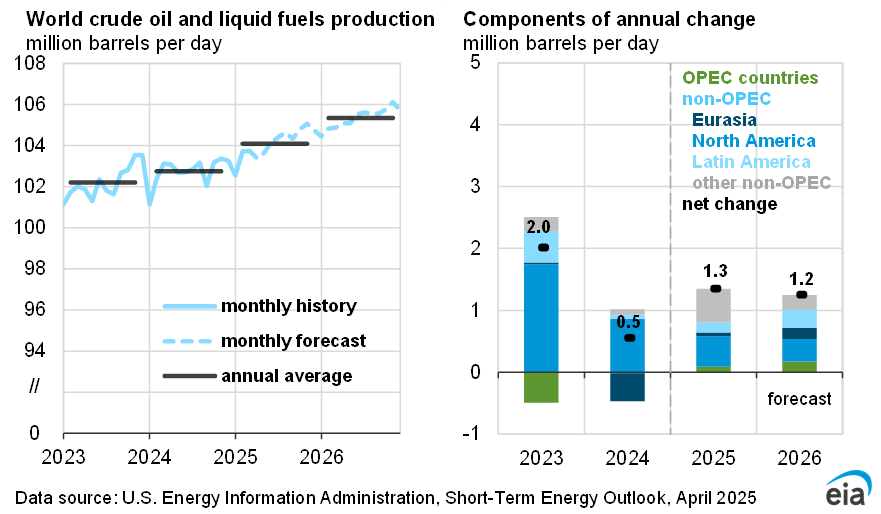
Although OPEC+ cuts are limiting world oil production growth, we estimate that growth outside of OPEC+ remains strong. We expect that global production of petroleum and other liquid fuels will increase by 0.6 million b/d in 2024. We expect OPEC+ liquid fuels production to decrease by 1.3 million b/d in 2024, while production outside of OPEC+ increases by 1.9 million b/d, led by growth in the United States, Canada, Guyana, and Brazil. We expect that global production of liquid fuels will increase by 2.2 million b/d in 2025, as the OPEC+ voluntary production cuts unwind throughout the year. OPEC+ production increases by 0.7 million b/d combined with 1.4 million b/d of production growth from countries outside of OPEC+ in 2025.
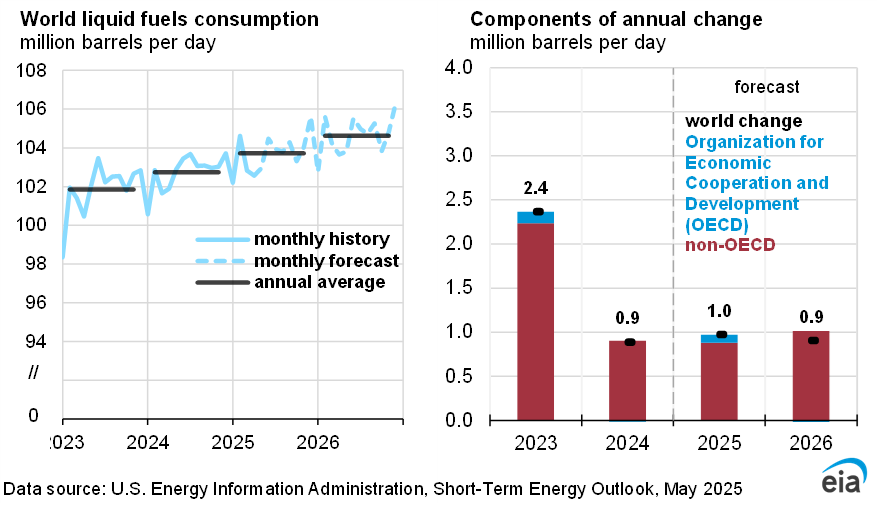
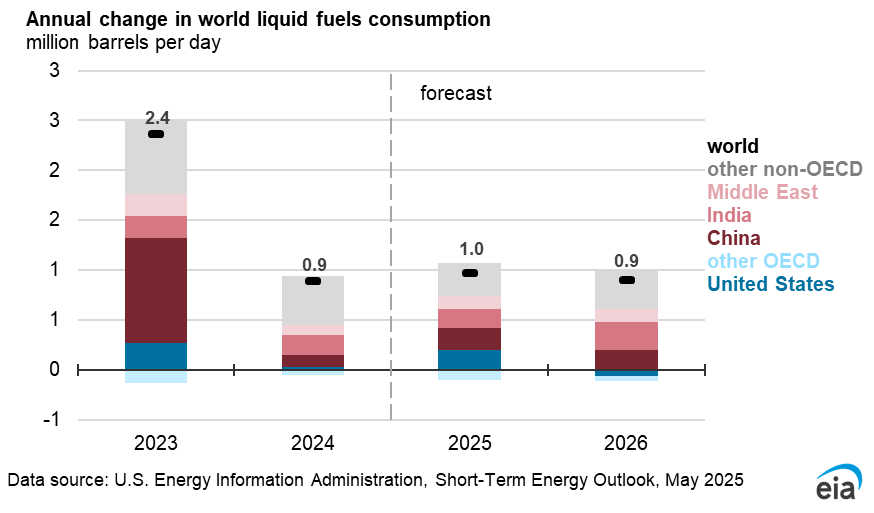
We forecast that global consumption of liquid fuels will increase by 1.1 million b/d in 2024 and 1.8 million b/d in 2025. Most of the expected demand growth is from non-OECD countries. In 2024, consumption of liquid fuels by non-OECD countries increases by 1.2 million b/d, offsetting a small decline in OECD, particularly in Europe and Japan. In 2025, non-OECD consumption rises by 1.4 million b/d, mostly in China, where we expect consumption will increase by 0.4 million b/d, and India, with a 0.3 million b/d increase. We expect OECD consumption rises by 0.4 million b/d, led by consumption growth in the United States.