
Red Sea disruptions increase oil flows around Cape of Good Hope

Note: May 2024 is preliminary data.
The amount of crude oil and oil products flowing around the Cape of Good Hope, located at the southern tip of Africa, increased nearly 50% in the first five months of 2024 compared with the 2023 average as commercial vessels avoided chokepoints in the Middle East.
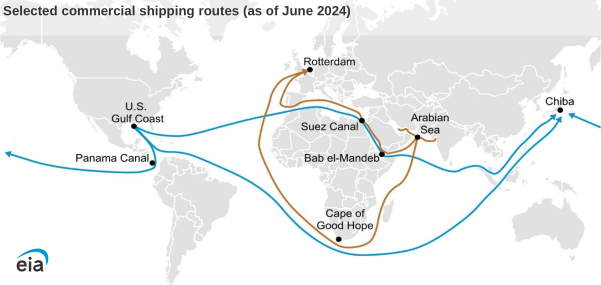
Attacks by Yemen-based Houthi militants in late 2023 prompted many commercial vessel operators to seek alternatives to the Bab el-Mandeb Strait and the Red Sea, the waterways off Yemen’s coast. In the coming weeks, we will update our World Oil Transit Chokepoints Analysis Brief, which will analyze how crude oil and oil products flow through all global chokepoints has changed in recent years.

Note: Russia to Asia & Oceania includes volumes from the crude oil blend transported from the Caspian Pipeline Consortium, which includes crude oil from Russia and Kazakhstan. May 2024 is preliminary data.
The volume of crude oil and oil products flowing around the cape (in either direction) rose to 8.7 million barrels per day (b/d) in the first five months of 2024 from an average of 5.9 million b/d in 2023. Oil products made up most of the increase. The following trade increased around the cape:
- Middle Eastern crude oil producers Saudi Arabia and Iraq sent more crude oil around the cape westbound to Europe than through the Suez Canal, which is accessed by the Red Sea and Bab el-Mandeb to the south. This increase in trade flow volume made up 15% of the total increase between the average of 2023 and January through May of 2024.
- Asian and Middle Eastern refiners increased their oil product exports to Europe and diverted cargoes westbound around the cape, representing 29% of the increased trade around the cape.
- The United States received both crude oil and oil products from the Middle East and Asia and sent more oil products to Asia around the cape. Total U.S. trade around the cape increased by about one-third, or just over 600,000 b/d, in the first five months of 2024 from the 2023 average.
- Although the Red Sea disruption did not affect Russia’s oil cargoes as much as other trade flows, Russia sent nearly four times as much crude oil and oil products, including volumes from the Caspian Pipeline Consortium, to Asia around the cape in the first five months of 2024 than in 2023, as a whole.
Diverting vessels around the Cape of Good Hope increases costs and shipping time. For example, a journey from the Arabian Sea to Europe via the cape is about 15 days longer—nearly twice the time—than by the Bab-al Mandeb and the Suez Canal, which increases costs and delays shipments.
Principal contributors: Candace Dunn, Justine Barden