Electricity, coal, and renewables
Electricity consumption
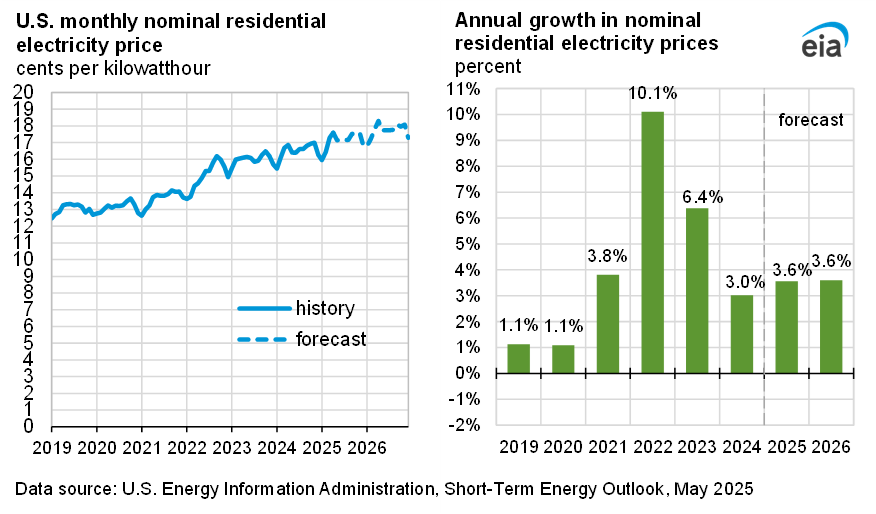
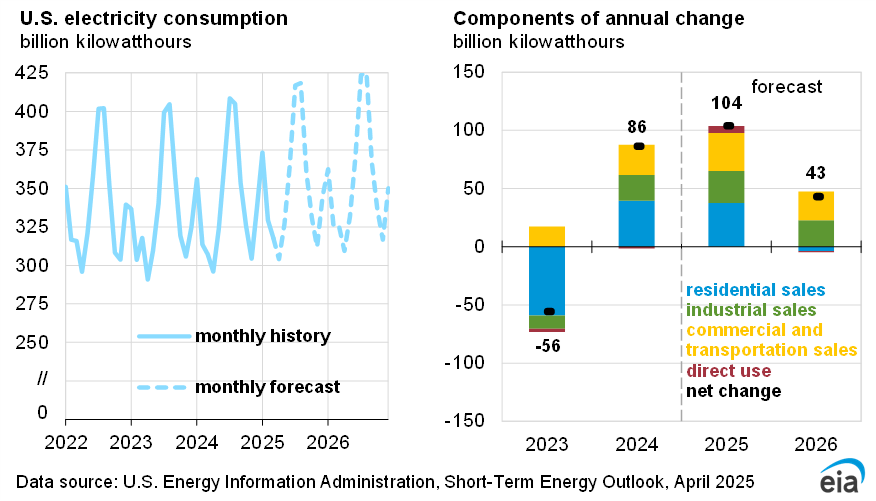
Colder-than-expected temperatures in February led to an increase in our 2025 U.S. electricity demand forecast. We expect that total U.S. sales of electricity to ultimate customers in the first quarter of 2025 (1Q25) will total 991 billion kilowatthours (kWh) compared with a forecast of 972 billion kWh in the February STEO.
On an annual basis, we forecast total U.S. electricity sales in 2025 will be 3% higher than in 2024. The growth this year is especially strong in the residential and commercial sectors, reflecting the higher 1Q25 weather-related consumption along with strong continuing growth in electricity demand from commercial customers such as data centers. We expect electricity demand in the commercial sector will grow by 2% next year and that industrial sector demand will grow by 3%. Forecast residential demand in 2026 decreases by less than 1% as temperatures return to more normal levels.
Electricity generation
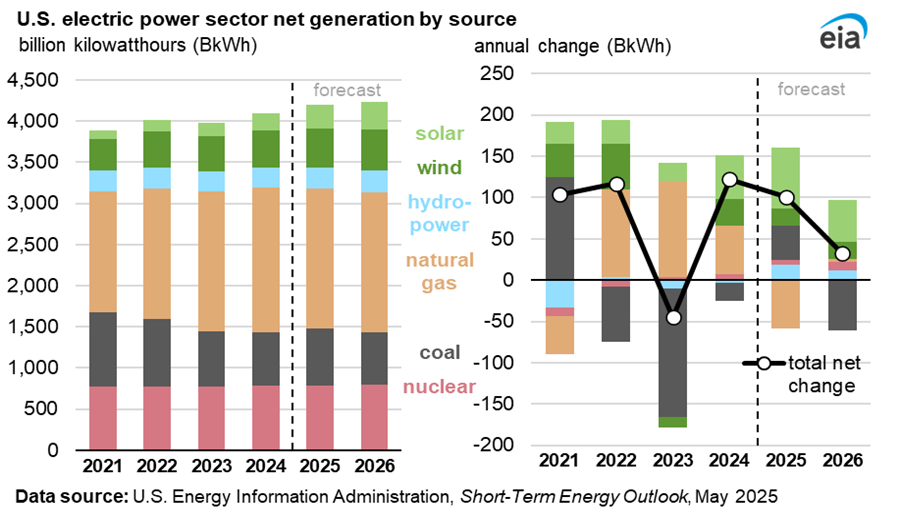
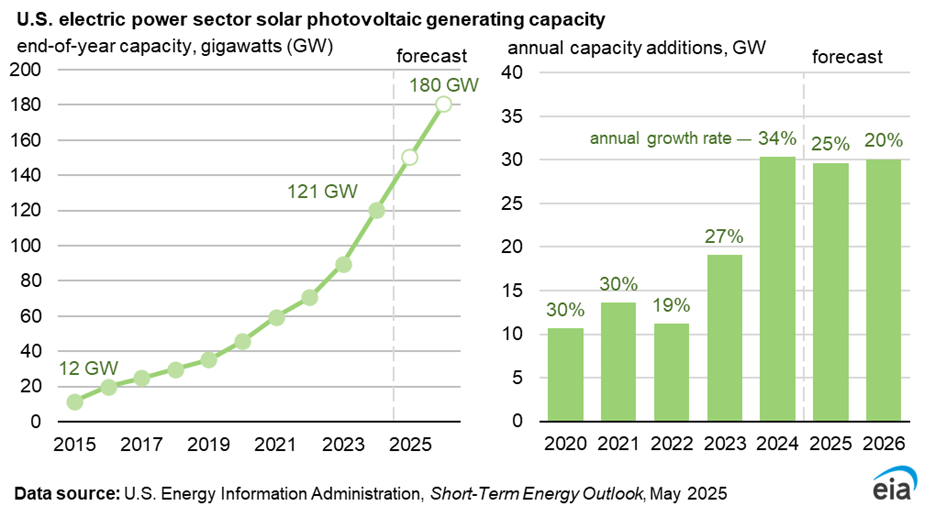
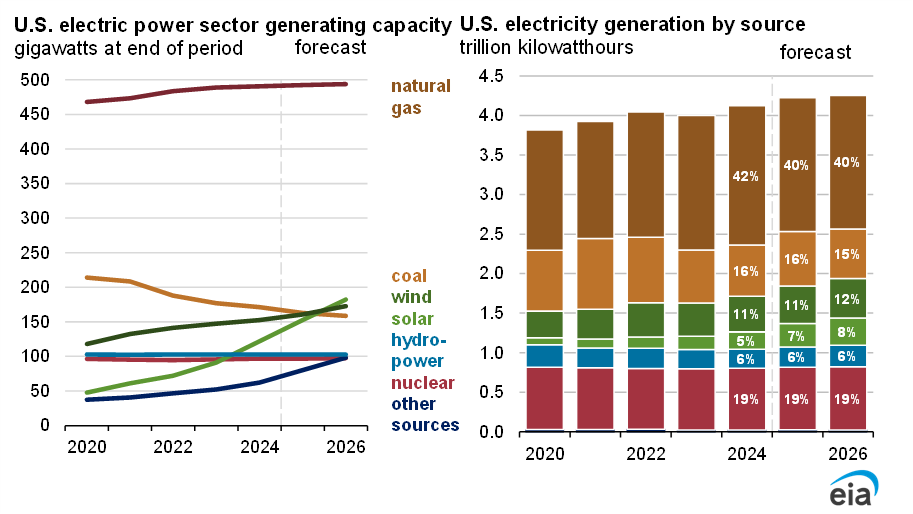
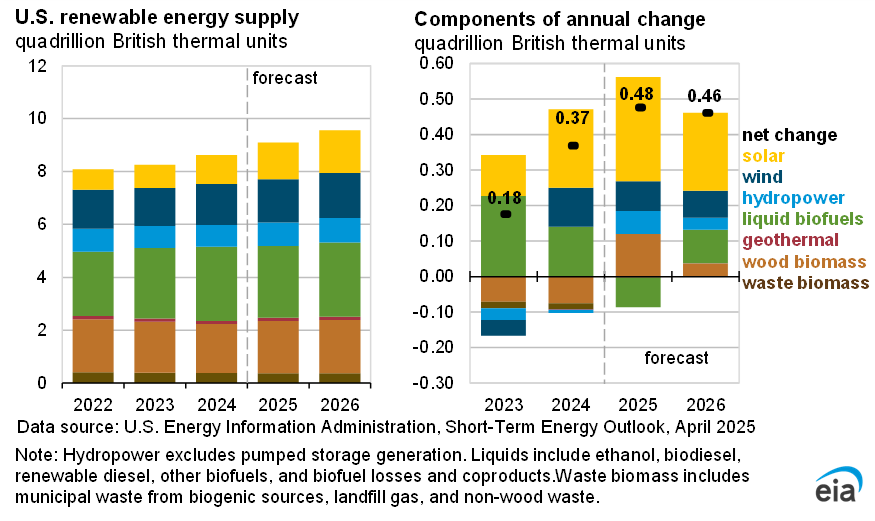
Increased generation from renewable energy is the main contributor to growth in U.S. electricity generation over the STEO forecast. The latest data received from power plant developers indicates that the electric power sector is planning to add 32 gigawatts (GW) of solar generating capacity in 2025 compared with an increase of 30 GW of solar in 2024. We expect this new capacity will lead to a 73 billion kWh increase (33%) in U.S. solar generation in 2025 followed by a 54 billion kWh increase (19%) in 2026. An expected 35 GW increase in battery storage capacity over the next two years allows solar generators to supply electricity for more hours of the day.
Increased overall electricity demand along with higher natural gas prices leads to a forecast 39 billion kWh increase (6%) in U.S. coal generation in 2025. U.S. natural gas generation declines in the forecast by 44 billion kWh (3%) as a result of higher fuel costs. In 2026, we expect coal generation will fall 55 billion kWh (8%), while natural gas generation stays relatively flat.
Coal markets
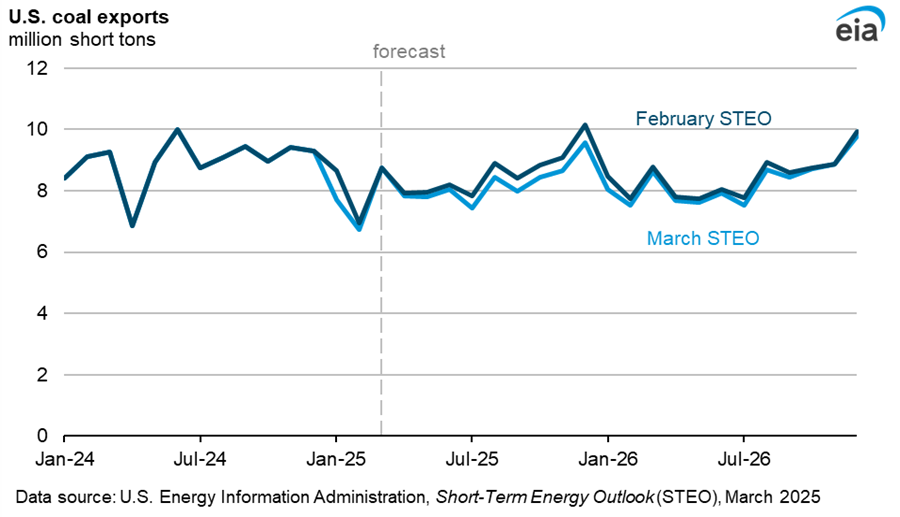
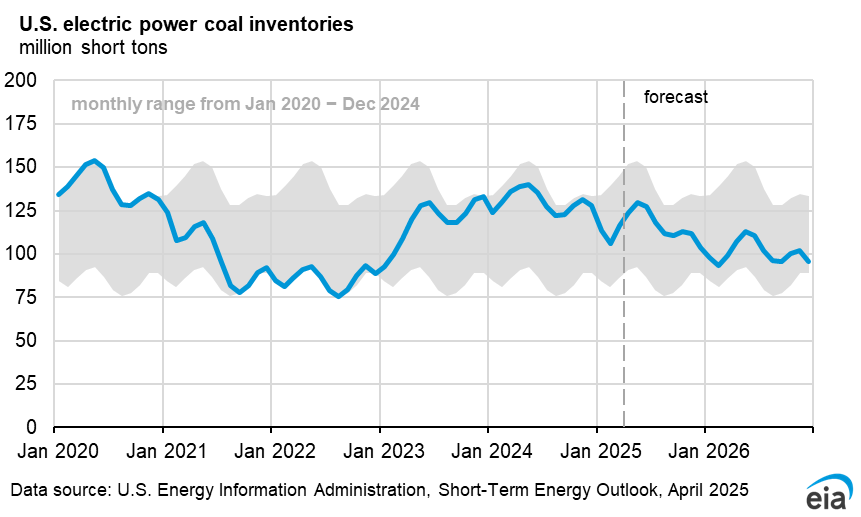
We have revised our forecast of U.S. coal exports to 97 million short tons (MMst) in 2025, compared with 102 MMst in the February STEO. Our revised forecast reflects a combination of emerging pressures on U.S. coal exports, including a strong U.S. dollar, weak pricing in international markets, China’s imposition in February of a 15% additional tariff on U.S. coal imports, and increasing coal production and exports from Australia. We expect these factors to be headwinds for both steam and metallurgical coal exports. In 2026, we forecast exports to rise slightly to 99 MMst. We also expect India to remain a consistent source of demand for U.S. coal.
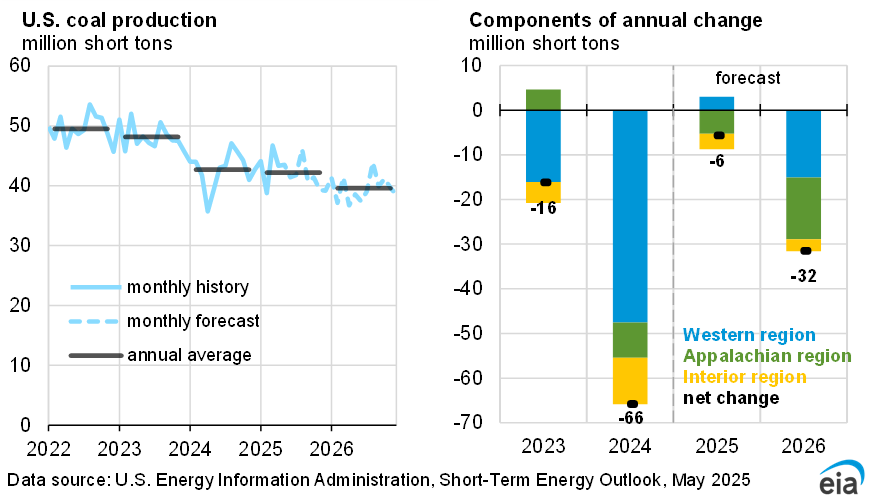
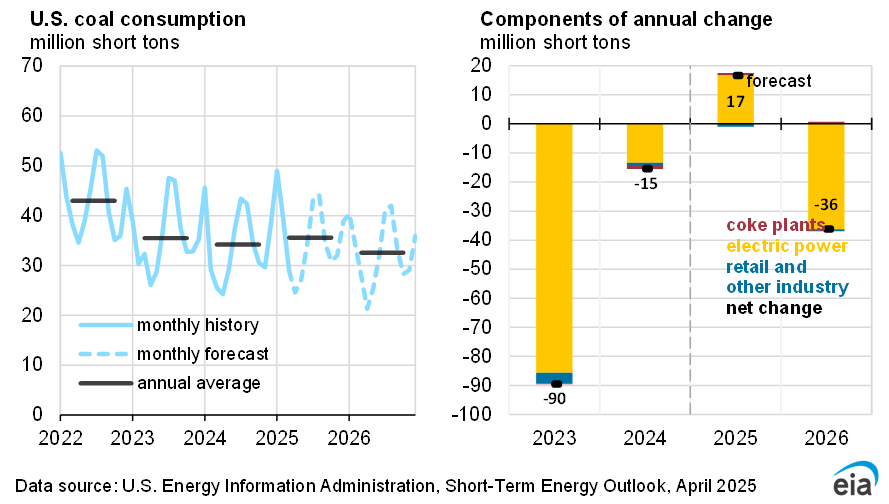
We expect electric power inventories to decline by 24% to 98 MMst in 2025 as electric power consumption increases 5% while coal production declines 6% in 2025. We expect inventory drawdowns to continue in 2026. In 2026, coal consumption falls by 7% in our forecast, and coal production falls by 3%. Despite a drop in coal consumption next year, we expect electric power sector coal stocks will be drawn down and end 2026 at 76 MMst. The stock draws mostly occur in 3Q26 when power generation peaks and relatively more coal is consumed by electric power generators than is supplied to the domestic power market.
.