Liquefied natural gas (LNG) is natural gas that has been cooled to a liquid state (liquefied), to about -260° Fahrenheit, for shipping and storage. The volume of natural gas in a liquid state is about 600 times smaller than its volume in a gaseous state (in natural gas pipelines). The liquefaction process, developed in the 19th century, makes it possible to transport natural gas to places natural gas pipelines do not reach and to use natural gas as a transportation fuel.
LNG expands markets for natural gas
Where natural gas pipelines are not feasible or do not exist, liquefying natural gas is a way to move natural gas from producing regions to markets, such as to and from the United States and other countries. Asian countries have accounted for the largest share of global LNG imports relative to all other regions since world LNG trade began in the 1970s.
LNG export facilities receive natural gas by pipeline and liquefy the gas for transport on special ocean-going LNG ships, or tankers. Most LNG is transported by tankers called LNG carriers in large, onboard, super-cooled (cryogenic) tanks. LNG is also transported in smaller International Organization for Standardization (ISO)-compliant containers that can be placed on ships and on trucks.
At import terminals, LNG is offloaded from ships and is stored in cryogenic storage tanks before it is returned to its gaseous state, or regasified. After regasification, the natural gas is transported by natural gas pipelines to natural gas-fired power plants, industrial facilities, and residential and commercial customers.
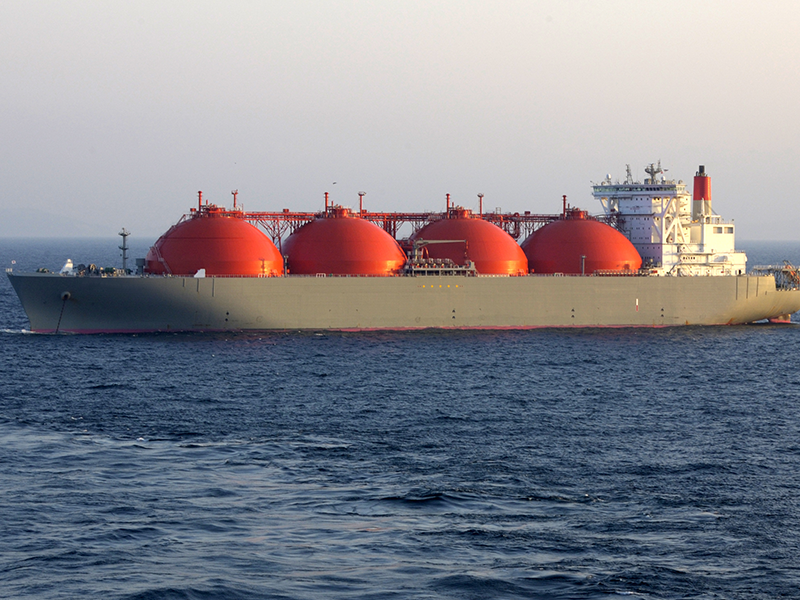
An ocean-going LNG carrier
Source: Stock photo (copyrighted)
In the United States, some power plants make and store LNG onsite to generate electricity when electricity demand is high (such as during cold or hot weather) or when pipeline delivery capacity is constrained or insufficient to meet increased demand for natural gas by other consumers. This process is called peak shaving. The power plants take natural gas from natural gas pipelines, liquefy it in small-scale liquefaction facilities, and store it in cryogenic tanks. The LNG is regasified and burned by the power plants when needed. Some ships, trucks, and buses have specially designed LNG tanks to use LNG as fuel.
U.S. LNG imports peaked in 2007
The United States imported very small amounts of LNG until 1995. In 1995, annual LNG imports began to increase until they peaked in 2007 at about 771 billion cubic feet (Bcf), equaling 17% of total natural gas imports. LNG imports have declined in most years since 2007. In subsequent years, increasing U.S. natural gas production and an expanding U.S. natural gas pipeline network reduced natural gas imports.
In 2023, U.S. LNG imports were about 1% (15.24 Bcf) of total U.S. natural gas imports.
- The source countries, amounts, and percentage shares of total U.S. LNG imports in 2023 were:1
- Trinidad and Tobago 11.93 Bcf 78%
- Canada 2.05 Bcf 13%
- Jamaica 1.26 Bcf 8%
In 2023, the Everett LNG regasification terminal near Boston, Massachusetts, received about 87% of total U.S. LNG imports, all by LNG carriers from Trinidad and Tobago and Jamaica. The remaining 13% of LNG imports were delivered by truck from Canada into Alaska, Maine, Montana, New York, Vermont, and Washington. New England states—Connecticut, Maine, Massachusetts, New Hampshire, Rhode Island, and Vermont—historically have pipeline constraints during winter months when heating demand increases substantially during very cold weather. LNG imports help to meet natural gas demand in New England because the region has limited pipeline interconnections within the Northeast or with other U.S. natural gas-producing regions.
U.S. LNG export capacity and exports increased substantially between 2016 and 2023
The United States was a net exporter of LNG from 2016 through 2023 (exports were greater than imports), largely because of increases in U.S. natural gas production, declines in LNG imports, and increases in LNG export terminal capacity.
U.S. LNG baseload export capacity increased from about 1 billion cubic feet per day (Bcf/d) in 2016 to about 11.44 Bcf/d at the end of 2023. Total peak export capacity in 2023 was about 14.01 Bcf/d. In 2016, total U.S. LNG exports averaged 0.5 Bcf/d to 17 countries. In 2023, total U.S. LNG exports averaged 11.90 Bcf/day to 43 countries and accounted for 57% of total U.S. natural gas exports. U.S. LNG exports to Europe increased substantially in 2023, largely in response to European countries reducing natural gas imports by pipeline from Russia. U.S. LNG exports are expected to increase in coming years as the 9.69 Bcf/d of export capacity still under construction at the end of 2023 comes online.
- The top five destination countries, amounts exported, and percentage shares of total U.S. LNG exports in 2023 were:2
- The Netherlands 589 Bcf 14%
- France 493 Bcf 11%
- United Kingdom 451 Bcf 10%
- Japan 310 Bcf 7%
- South Korea 276 Bcf 6%
In 2023, LNG carriers transported nearly all U.S. LNG exports. About 0.69 Bcf of U.S. LNG exports were transported by truck in ISO containers to Canada and Mexico, with 88% going to Mexico.
Sometimes, when natural gas prices are favorable to do so, the United States re-exports some of the LNG that it originally imported. However, in 2023, the United States did not re-export any LNG.
LNG export terminals consume natural gas to liquefy natural gas
Not all natural gas delivered to LNG export facilities (feed gas) is exported as LNG because LNG export terminals consume some of the feed gas to operate on-site liquefaction equipment. EIA estimates (based on survey Form EIA-176; see LNG respondent data) that approximately 7% to 15% of LNG feed gas is used for liquefaction processes, mostly to operate on-site liquefaction equipment.3 U.S. LNG export facilities, except Freeport LNG, use natural gas turbine-driven refrigerant compressors to convert natural gas to LNG. Freeport LNG is the only liquefaction facility in the United States that uses electric motors instead of natural gas turbines to drive refrigerant compressors. As a result, most of Freeport LNG's feed gas is converted into LNG.
1 Data source: Natural Gas Monthly, Table 4, March 2024, preliminary data for 2023
2 Data source: Natural Gas Monthly, Table 5, March 2024, preliminary data for 2023
3 The U.S. Energy Information Administration does not publish data specifically on the volumes of natural gas consumed for LNG liquefaction. Those volumes are included, but are not itemized, in the data for natural gas consumption for pipeline and distribution use.
Last updated: June 21, 2024, with data from the Natural Gas Monthly, March 2024; preliminary data for 2023.