Summer 2022 Electricity Industry Outlook
Overview
EIA is publishing this supplement with its May Short-Term Energy Outlook (STEO) to provide more detail about our forecasts for U.S. electricity consumption, power generation, and electricity prices during the summer of 2022 (June, July, and August). These forecasts are based on recent trends in electricity demand and supply that have been influenced by changes in market economics, regulatory policy, and consumption patterns:
- Natural gas prices in the United States rose substantially over the past year and a half, after many years of relatively low prices that led to a steady rise in the use of natural gas for electricity generation.
- Federal production and investment tax credits, state renewable standards, and declining construction costs for wind and solar power have led to increased generation from renewable energy sources.
- Generation from coal fell as coal-fired power plants were retired.
- Electricity consumption continues to return to pre-pandemic patterns with forecast declines in residential demand partially offsetting growing electricity consumption in the commercial and industrial sectors.
These changes in the supply and demand of electricity have led to gradually rising wholesale electricity prices in recent months, as well as contributing to price spikes at certain times in response to temporary constraints in supplying power.
For summer 2022, we forecast that total U.S. retail sales of electricity to end-use customers will be 0.4% higher than last summer. Lower forecast residential usage resulting from milder expected temperatures is more than offset by increasing consumption in the commercial and industrial sectors, which continue to recover from the pandemic-related economic slowdown over the past two years.
This summer, we expect renewables will be the only electricity generation source that will significantly increase compared with last summer, driven by large buildouts of new solar capacity. Higher forecast natural gas prices in 2022 contribute to our expectation that natural gas generation will decline this summer compared to last year. However, we do not expect the higher natural gas prices will lead to more electricity generation from coal, which has typically been a substitute for natural gas when dispatching power plants. A significant number of coal plants were retired in recent years and the remaining coal generating fleet is experiencing constraints that are limiting the dispatch of the fleet. Higher expected natural gas prices along with the limited responsiveness of coal generation will lead to increases in both wholesale and retail electricity prices this summer.
Demand and supply patterns for electricity are highly dependent on the realized weather, especially during the summer, so actual industry conditions in the future may differ substantially from initial expectations. In addition, natural gas prices have shown high degrees of volatility in recent months. Therefore, this summer’s electricity supply outlook is subject to heightened levels of uncertainty around the current STEO forecast.
Electricity Consumption
U.S. electricity consumption patterns changed significantly as a result of the COVID-19 pandemic. Annual U.S. total retail sales of electricity in 2020, the first year of the pandemic, were 2.5% lower than in 2019, but the effect differed by end-use sector and at different times of the year. The stay-at-home orders that occurred during the spring and summer of 2020 caused U.S. retail sales of electricity to the commercial sector during the summer months (June, July, and August) to fall by 4.7% from the same period in 2019. This decline was the largest year-over-year percentage decline in commercial-sector retail sales of electricity since at least 1975 (the first year for which we have monthly data). Industrial-sector consumption of electricity fell by 6.4% in summer 2020, the largest decline since the recession of 2009. Conversely, with more people working from home, residential electricity consumption in the summer of 2020 was 7.9% higher than the summer of 2019, which was the fastest summer-over-summer growth since 2010.In 2021 stay-at-home orders were gradually relaxed, the economy began recovering, and electricity consumption began returning to pre-pandemic patterns. In 2021, U.S. gross domestic product (GDP) rose 5.7% on an annual basis after having fallen 3.4% in 2020. In 2020, the unemployment rate averaged 8.1% but by December 2021 had fallen to 3.9%, about where it was before the pandemic began.
These improving economic conditions were most evident in the industrial and commercial sectors, where U.S. retail sales of electricity during the summer months of 2021 were 6.1% and 4.9% higher than in the previous summer, as more business returned to normal operations. Retail sales of electricity to the residential sector in the summer of 2021 were 2.4% lower than the summer of 2020. Some of the decline may be attributable to people returning to the office instead of working at home. However, this effect is difficult to isolate because summer temperatures last year were milder than in 2020, which likely led to less residential electricity use for air conditioning.
For the summer of 2022, we forecast that total U.S. retail sales of electricity will be 0.4% higher than last summer. This growth is concentrated in increased electricity sales to the commercial and industrial sectors, reflecting continued economic recovery after the pandemic. Based on economic forecasts from S&P Global, we expect U.S. GDP in 2022 will grow by 3.1% for the year. We forecast that the industrial production index for electricity-intensive businesses will grow by 4.5% this year. These growing economic indicators largely determine our forecast that retail sales of electricity to the industrial sector during summer 2022 will be 2.8% higher than last summer.
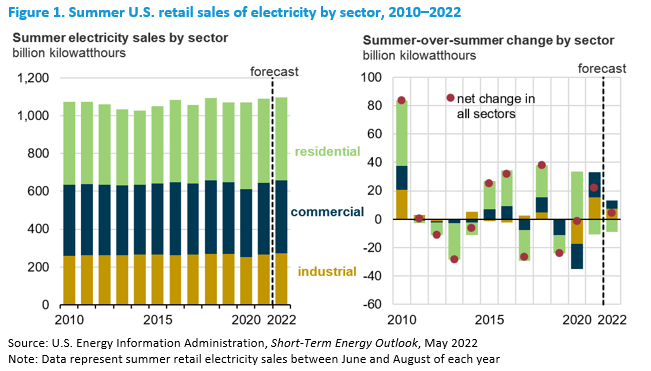
Increased economic activity is also likely to contribute to rising U.S. commercial-sector demand for electricity this year. Our forecast for U.S. non-farm employment, an indicator of commercial sector economic activity, grows by 4.0% on an annual basis in 2022. We forecast that U.S. retail sales of electricity to the commercial sector during the summer of 2021 will be 1.5% higher than last summer. This increased commercial-sector electricity demand will likely occur in office buildings, where workers have been returning after an extended period of working from home, as well as at travel and leisure-related establishments such as restaurants and hotels.
Weather patterns can affect electricity demand in the commercial and industrial sectors to a limited extent. However, in the residential sector, temperature and humidity levels are primary drivers of summer electricity demand because nearly 90% of homes in the United States use some form of air conditioning for space cooling [1]. The National Oceanic and Atmospheric Administration forecasts that U.S. cooling degree days, a measure of summer warmth, will be 6.5% lower in June-August 2022 than last summer. The lower expected temperatures will likely translate to less residential electricity demand this summer. We forecast U.S. residential sector retail sales of electricity during the summer of 2022 will be 2.0% lower than last summer.
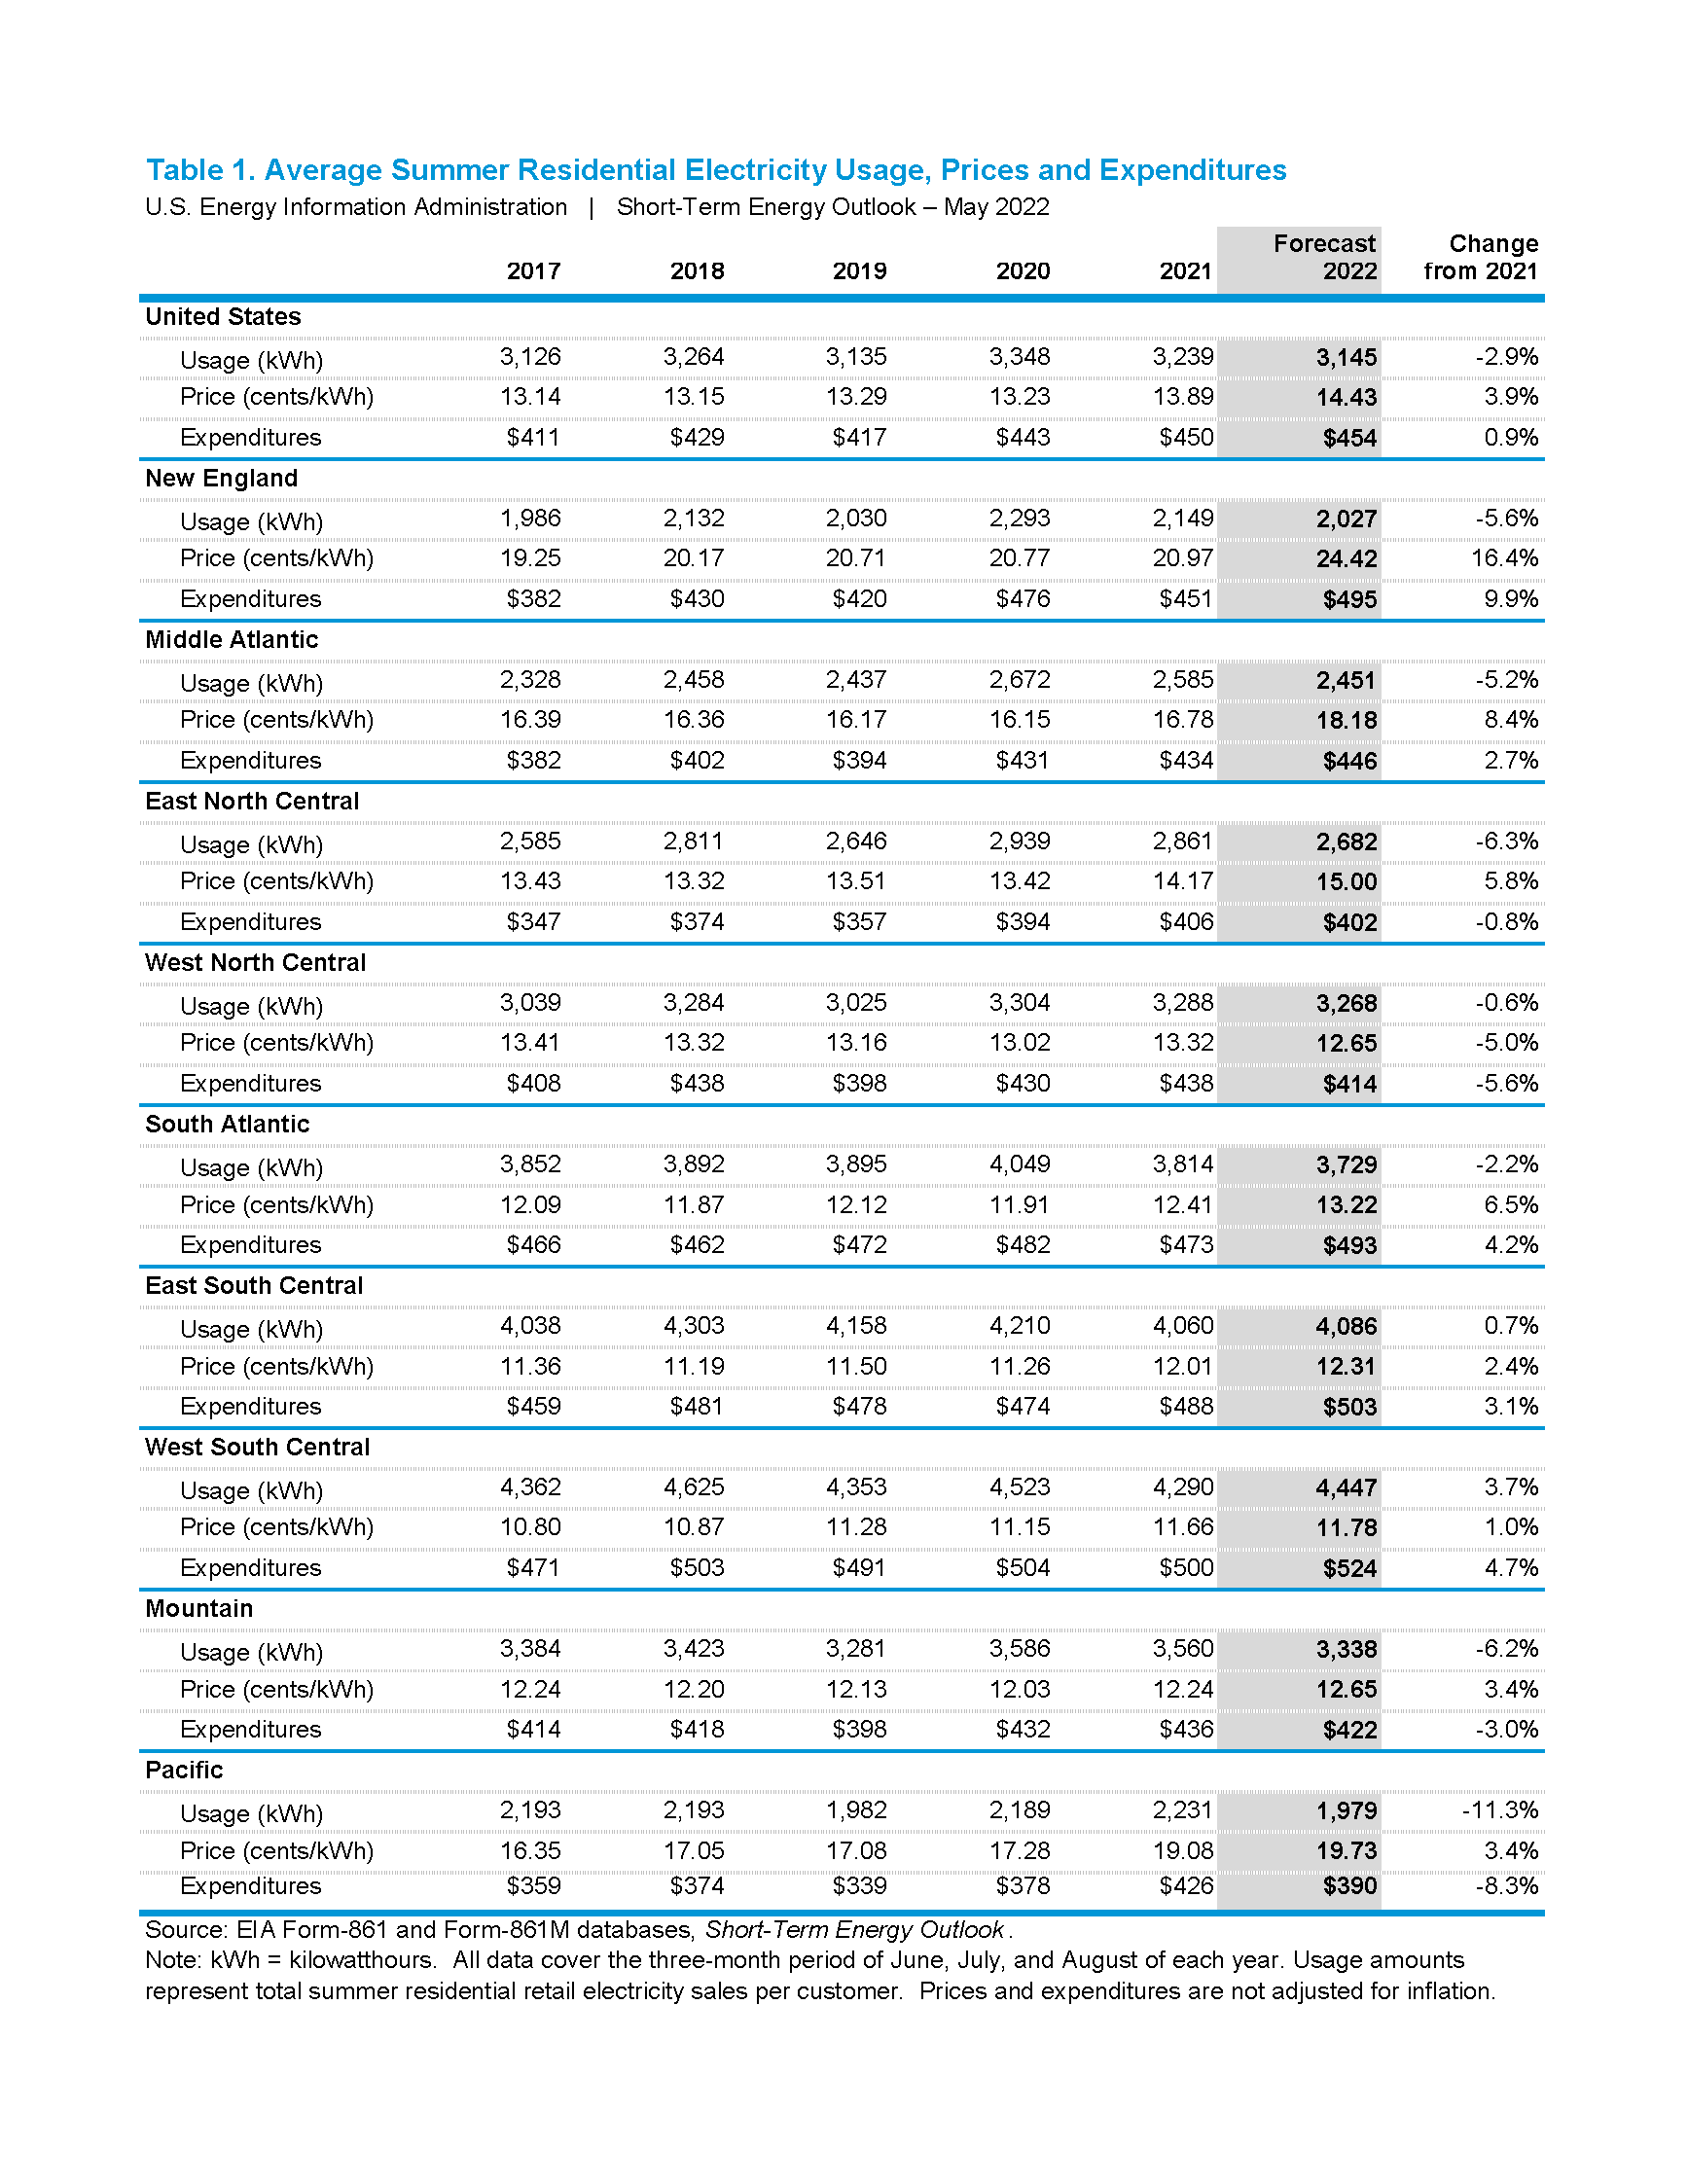
In terms of the amount of electricity consumed by a typical home, we forecast electricity use per residential customer will average about 1,050 kilowatthours (kWh) per month between June and August 2022, which would be 2.9% less than the summer of 2021. This forecast decline is primarily a result of our expectation that summer weather will be milder than last year. Electricity use can vary widely from household to household based on a home’s location, size, efficiency, etc. Forecast summer residential electricity use per customer ranges from an average of about 660 kWh/month in Pacific states to about 1,480 kWh/month in the West South Central region, which includes Texas, Oklahoma, Louisiana, and Arkansas.
Electricity Generation
Changes in available generating capacity and market economics are likely to alter some of the recent trends in the electric power sector's mix of energy sources for power generation this summer. Historically, natural gas and coal have been the top two fuel sources for electricity generation in the United States. Much of the year-to-year change in the relative use of these fuels and the longer-term trends in use have been determined primarily by the cost of natural gas for power generation, which is much more volatile than the cost of coal.
The long-term trends in the changing mix of coal and natural gas generating capacity will have an impact on the supply of electricity this summer. One of the main drivers for the evolving types of power generating capacity was a sustained period of historically low natural gas prices. Between 2016 and 2020, the average annual cost of natural gas delivered to electric generators ranged between $2.40and $3.55 per million British thermal units (MMBtu). However, that trend was broken in 2021 when the delivered cost of natural gas averaged $4.97/MMBtu, more than double the 2020 average price.
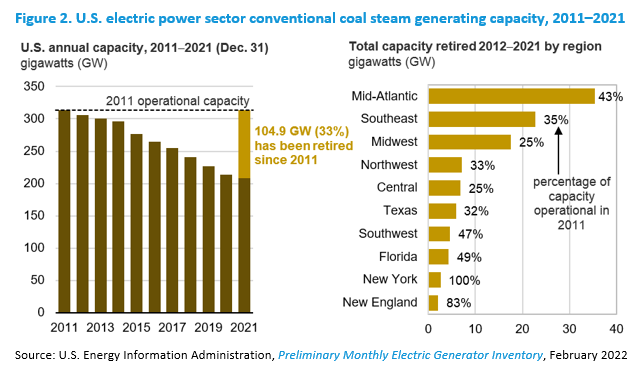
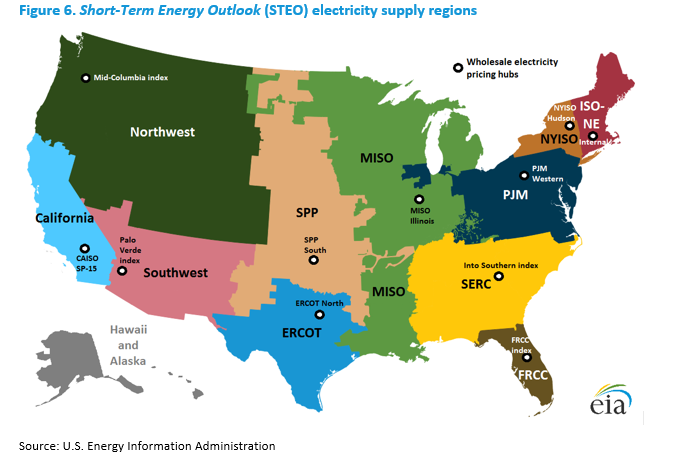
The sustained low natural gas prices and environmental policies discouraged the use of other fossil fuel sources, especially coal. These economic and regulatory factors have led not just to the changes in the dispatch of existing capacity, but also to the permanent closure of many coal-fired power plants. Over the past 10 years, the U.S. electric power sector has retired 105 gigawatts (GW) of conventional coal steam generating capacity, equivalent to 33% of the coal-fired capacity that was operational in 2011. Most of these coal capacity retirements have been concentrated in the Mid-Atlantic, Southeast, and Midwest electricity supply regions (Figure 6). However, even Texas and states in the West have retired between 30% and 50% of their coal-fired generating fleet in the past decade.
As a result of the reduction in coal demand for electricity generation, the number of producing coal mines in the United States has also been steadily declining [2]. Although coal production could rise at some idled facilities, it is unlikely that coal supply from most of the closed mines will return. Limited mine production capacity and the increase in coal generation last year have left coal power plants with inventories that are near record low levels [3]. The strong demand for coal and limited supply have increased coal prices, with the cost of coal delivered to U.S. electric generators averaging $2.18/MMBtu in February 2022, which is 13% higher than the same time last year.
In contrast, historically low natural gas prices in recent years have led to the addition of more natural gas-fired generating capacity [4]. Between 2011 and 2021, the U.S. electric power sector added 75 GW of natural gas-fired generating capacity, an increase of 19% from the 2011 level. Typically, natural gas generators are not run at as high a utilization rate as coal-fired power plants, but many of the new natural gas generating units installed in recent years use more efficient combined-cycle technology and can be run at higher capacity factors to fulfill baseload electricity demand [5].
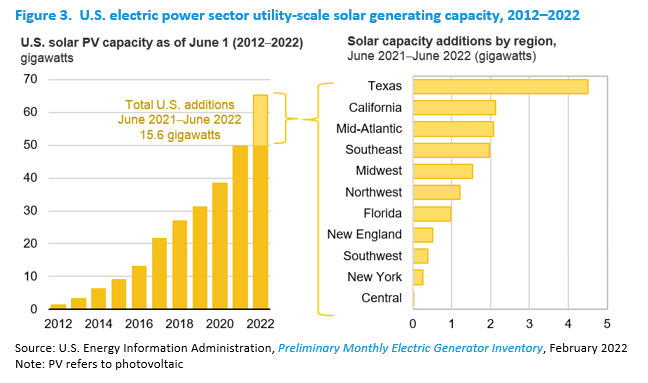
Another significant factor affecting U.S. electricity supply this summer is the recent addition of new generating capacity from renewable energy sources, which have increased because of declining capital costs and policies that encourage development of those technologies. In particular, utility-scale solar photovoltaic (PV) capacity has been rising rapidly with almost exponential growth in the last 10 years. At the beginning of summer 2012, the U.S. electric power sector had 1.4 GW of utility-scale solar PV generating capacity, but by summer of 2021 that capacity had grown to 49.8 GW.
Although solar generation from the electric power sector provides less than 5% of total U.S. generation, growing capacity is especially important in some regions. Because solar power is usually most available during the peak demand hours, it can displace more expensive fuel sources for meeting peak electricity demand.
In recent months, natural gas prices have risen to significantly higher levels compared with past years. The Henry Hub spot price in April 2022 averaged $6.59/MMBtu, which is two and a half times the average monthly price at this time last year. In past years, such high prices encouraged the use of more coal for power generation instead of natural gas. However, so far in 2022, early estimates indicate that the share of total U.S. generation from coal-fired power plants is slightly lower than the first four months of 2021, while the share provided by natural gas has remained relatively steady.
Both changes in the industry’s existing generating capacity mix and the current level of natural gas prices are expected to play important parts in how electricity is supplied this summer. For summer 2022, we forecast that the U.S. electric power sector will generate 1,150 billion kWh of electricity, which is almost the same as the level generated last summer.
We forecast that the cost of natural gas delivered to U.S. power generators will average $8.81/MMBtu during summer 2022, up 124% from last summer. Our forecast for higher natural gas prices this year reflects both the relative inflexibility in gas-to-coal switching for power generation along with constraints that are limiting increases in natural gas production.
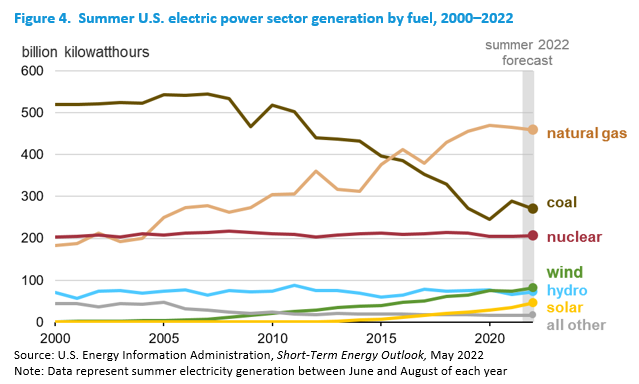
The only energy sources that we expect will experience gains in electricity generation this summer, compared with summer 2021, are solar and wind power. The electric power sector has reported that it plans to have a total of 65 GW of utility-scale solar generating capacity available online by June 1, 2022, which would be a 31% increase above the solar capacity operational at the beginning of last summer [6]. We expect wind power capacity on June 1 to total 138 GW, an increase of 12% over last year.
Renewable energy sources generally have lower operating costs than fossil fuel-fired power plants, so they are dispatched to supply electricity whenever the resources are available and there is sufficient demand to accept the power. We expect that the increased buildout in new solar and wind capacity will increase generation from those sources by a similar amount this year. During summer 2021, wind and solar contributed 9.6% of the electric power sector’s total generation. We forecast that the renewable generation share will grow to 11.1% this summer.
The growth in solar capacity will likely greatly affect the generation mix in certain regions, especially in the ERCOT market in Texas where nearly 30% of the nation’s new solar capacity is being installed. Texas already has the most wind power capacity installed of any state, and the addition of new solar will add to its available renewable energy capability [7]. We forecast that utility-scale solar power projects in Texas will provide 7.2% of electric power sector generation in the region this summer, up from a share of 3.9% last summer. Our forecast for wind’s share of generation in Texas grows from 16% last summer to almost 19% this summer.
California’s electricity market is also likely to see large increases in solar generation this summer. The electric power sector in that region plans to have a total of 17 GW of utility-scale solar PV generating capacity available by June 1, which would be a 14% increase from last summer. We forecast that utility-scale solar projects will contribute 23% of California’s summer generation in 2022 compared with a solar generation share of 20% in summer 2021.
In addition to large-scale solar projects, California also has more than 12 GW of small-scale solar PV capacity, such as the types of systems that are installed on residential or commercial building rooftops. Small-scale projects in California account for more than one-third of the total small-scale solar capacity currently installed in the United States. However, the large amounts of solar capacity in California and the unique characteristics of the technology (for example, solar panel output tends to rapidly increase during the morning hours) have led to operational challenges in efficiently and reliably dispatching generating resources during the day [8].
Another major factor currently affecting electricity supply in California is the severe drought that has been affecting the region over the past few years [9]. The historically low levels of water supply are likely to lead to lower-than-normal generation from hydroelectric power plants this summer, although slightly better than last year. We expect that California will use its hydroelectric facilities to supply 10% of the region’s total generation this summer, compared with 8% in summer 2021. In a forthcoming STEO Supplement, we examine how hydroelectric generation in California during a drought year (such as this year) compares with generation during a year with normal water supply.
Utility-scale solar capacity additions are also very high this year in the Mid-Atlantic region (which represents the PJM electricity market) and in the Southeast region. These areas of the country have not historically had much penetration of intermittent renewable energy resources. Even with the expected increases, in both regions, solar will likely provide no more than 2% or 3% of total regional generation.
The effects of coal plant retirements and higher natural gas prices are likely to be a more significant factor in summer electricity supply in the East Coast regions because they rely most on those two fuels for power generation. As discussed above, the Mid-Atlantic region has retired almost half of the coal-fired generating capacity that was operational 10 years ago, and the Southeast region has retired 35% of its coal capacity over the same period.
We forecast that coal-fired electricity generation in the Mid-Atlantic region this summer will fall from a share of 26% last summer to a forecast share of 23% this summer. This forecast reduction in coal-fired generation occurs even though we expect higher sustained natural gas fuel costs as a result of less coal generating capacity along with constraints on receiving more supplies of the fuel. Despite higher forecast natural gas prices, the constraints on coal-fired generation are unlikely lead to a large reduction in regional natural gas generation. We expect natural gas will provide 40% of Mid-Atlantic generation this summer, about the same as last year. The loss of coal and natural gas generation in the Mid-Atlantic region this summer will be offset by increased imports from neighboring power markets as well as increased renewable energy capacity.
Electricity Prices
Wholesale electricity prices reflect the overall state of the power market at a given point in time, including the costs and availability of supply, the level of demand, and any system constraints. In general, the competing generation resources available to meet demand set the price, resulting in the use of more costly supply options as demand increases. One of the major determinants of wholesale prices is the delivered cost of natural gas, which tend to be more volatile than the cost of other power generation fuels. However, the availability of more efficient natural gas generators, such as those using modern combined-cycle technology, can keep wholesale prices down. In addition, as intermittent solar and wind resources come online, they can mitigate the need to run other generating units, reducing wholesale power prices in some circumstances.
Electricity demand also affects wholesale electricity prices, especially during the summer months when demand is highest. On especially hot summer days with high air-conditioning load, the electric power sector may need to run its most expensive units to fulfill peak hourly load. And if local generation resources are inadequate to fulfill peak demand, transmission lines may become constrained leading to higher electricity prices as a result of the congestion on the grid.
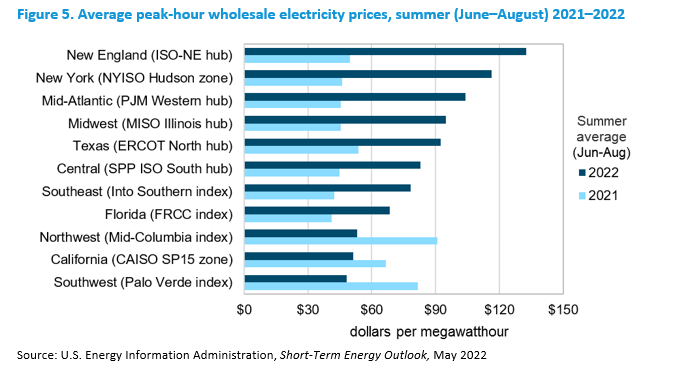
Wholesale electricity prices began moving higher in the second half of 2021 in line with rising natural gas fuel costs. In the western regions last year, prices reached peak levels in July when the monthly price at the Mid-Columbia hub in the Pacific Northwest averaged $119 per megawatthour (MWh), the Palo Verde hub in the Southwest averaged $92/MWh, and the CAISO SP-15 hub price averaged $79/MWh.
Our peak-period wholesale price forecasts provide information about expected trends in the cost of electricity based on assumed market conditions and the regulatory structure for the various regions; however, realized prices can be extremely volatile, and average price forecasts can be very uncertain [10]. Electricity prices can spike when electric power systems become constrained or unbalanced, such as under conditions of extremely high peak-hour loads or unexpected outages of generating capacity. For example, real-time electricity prices in Texas’s ERCOT market spiked during February 2021 to a preset maximum of $9,000/MWh and stayed at that level for more than three consecutive days [11]. These high peak-hour prices at the ERCOT North hub contributed to a $1,800/MWh average price for the month. Such extreme scenarios are difficult to forecast and usually affect specific regions or sub-regions of the U.S. for limited periods.
For summer 2022, we expect that the significantly higher natural gas fuel costs will be a main driver of wholesale power prices in coming months, along with the increased difficulties experienced by U.S. power suppliers in responding to prices in recent months. Forecast electricity demand between June and August 2022 is relatively similar to the level of demand last summer. We expect summer temperatures, as reflected in the outlook for cooling degree days from the National Oceanic and Atmospheric Administration, to be slightly milder than last summer, except in Texas, which may experience slightly warmer temperatures. However, even a few days with hot weather could lead to spikes in wholesale prices if electricity supplies are strained.
We forecast that average monthly wholesale electricity prices between June and August 2022 will range from $48/MWh at the Palo Verde hub in the Southwest (41% lower than last summer) to a high of $133/MWh at the ISO New England internal hub (167% higher). The forecast summer prices over $100/MWh in the northeastern regions reflect a higher probability of constrained fuel supplies causing temporary price spikes during peak demand hours.
Retail electricity prices are generally less volatile than wholesale electricity prices due to the effects of contracts, rate regulation, and non-wholesale rate elements, but they often depend directionally on the same drivers, especially the cost of fuels for generating electricity. In particular, the rise in natural gas prices over the past year is likely to lead to some degree of higher electricity prices for most retail customers.
We forecast the U.S. residential electricity price will average 14.4 cents/kWh between June and August 2022, up 3.9% from summer 2021. The forecast summer commercial sector price averages 12.0 cents/kWh (up 4.5%) and the forecast industrial sector price averages 7.7 cents/kWh (up 2.9%). Although these summer-over-summer growth rates are higher than in past years, they are lower than the growth in retail electricity rates between summer 2020 and summer 2021. Over that period, residential prices grew 5.0%, commercial prices grew 5.5%, and industrial prices grew 6.0%.
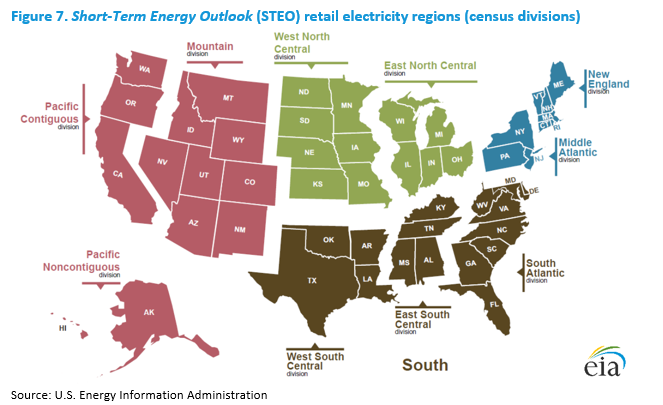
Electricity prices charged by specific utilities and retail distribution companies can vary widely, depending on the cost of the electricity they supply and other costs such as investment in new generation or transmission infrastructure. We expect the summer increases in retail residential electricity prices will vary from an increase of about 1% in the West South Central region to a 16% increase in New England (Figure 7).
Although we forecast residential electricity prices to be higher this summer throughout the United States, lower-than-average electricity use compared with last summer may, in some cases, offset the effect of higher prices on some household electricity bills. We forecast the typical residential customer’s summer electricity bill will be relatively similar to last summer; our estimate of average expenditures from June through August 2021 totals $454, up less than $5 from last summer (Table 1). Year-over-year changes in average summer residential electricity expenditures vary from a forecast decline of 8% in the Pacific region to a forecast increase of 10% in the New England region.
2022 Summer Electricity Outlook