U.S. Petroleum products
U.S. retail gasoline and diesel prices
U.S. retail prices for both diesel and gasoline increased in September. Retail gasoline prices averaged $4.35 per gallon (gal), and retail diesel prices averaged $6.29/gal. The increase in retail prices was driven by higher crude oil prices in addition to rising crack spreads. Most of the increase in gasoline crack spreads occurred at the beginning of the month and distillate crack spreads increased throughout the month.
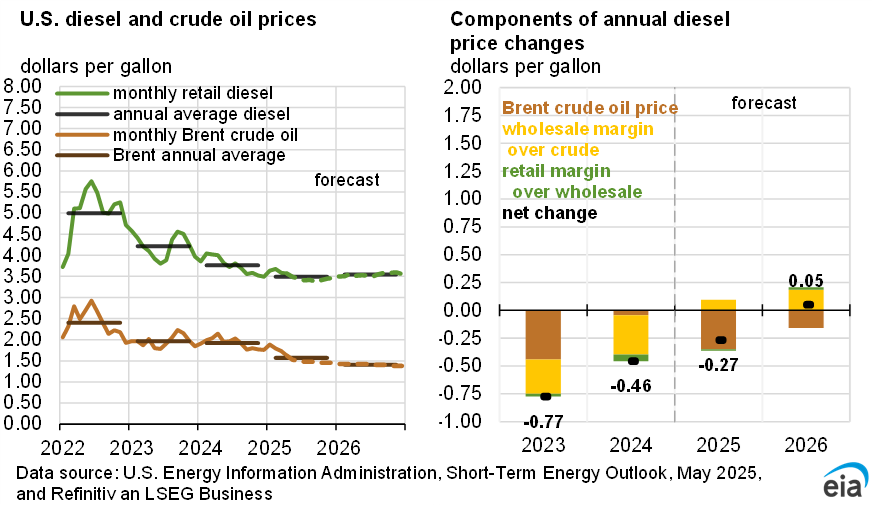
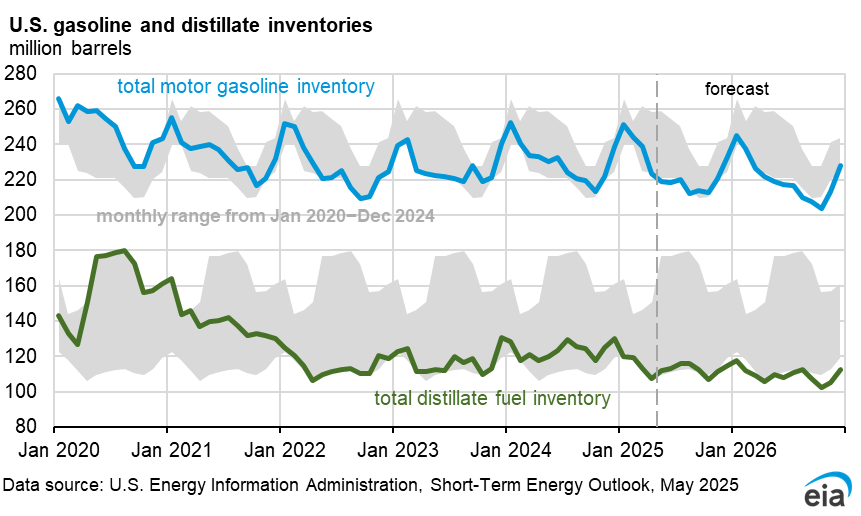
We forecast retail distillate prices will remain above $6/gal in October and then come down gradually with crude oil prices and a slight recovery in inventories, which we expect will help lower crack spreads. Although we expect crack spreads will decrease, we forecast they will remain high relative to historical averages. We expect U.S. distillate fuel inventories to remain below the 2021–2025 average throughout the forecast period, however, keeping diesel crack spreads elevated and retail prices above $4/gal through 2027.
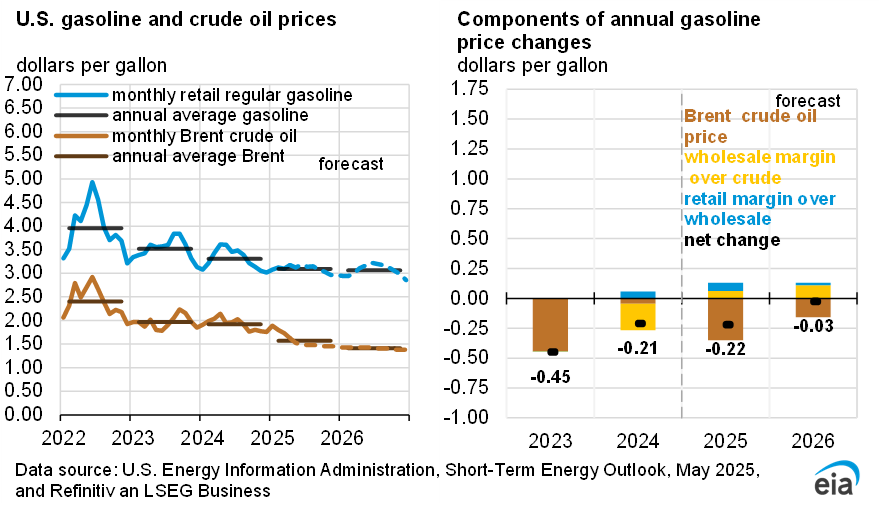
We forecast retail gasoline prices will be about the same in October as September and then slowly decrease with crude oil prices. We expect the gasoline crack spread to decrease but remain above seasonal averages through the beginning of 2027 due to low U.S. inventories.
Decreases in wholesale crack spreads will not immediately translate into lower retail prices. Crack spreads reflect the difference between crude oil prices and wholesale prices. However, the difference between our wholesale price estimates and retail prices reflect the added cost of fuel taxes and margins for retail and distribution. So far in 2026, these retail and distribution margins have been depressed because of surging wholesale prices, but we expect them to increase back above the five-year average in 2027 after wholesale prices begin to decrease.
East Coast distillate inventories
Distillate inventories on the U.S. East Coast (PADD 1) were 32% below their five-year (2021–2025) seasonal average in September, and we forecast inventories in the region to remain between 10% and 30% below that five-year average in 2027.
Because of limited regional refinery capacity, the East Coast region consumes more distillate fuel than it produces. To meet consumption needs, the region supplements local production with a combination of shipments from the U.S. Gulf Coast—mostly via the Colonial Pipeline but also via waterborne shipments—and imports from other countries. In 2025, the East Coast imported 124,000 barrels per day (b/d) of distillate fuel oil, about 10% of regional consumption. Imports mostly come from Canada to the Northeast and typically peak between December and February. Imported distillate fuel oil accounts for about 15% of regional consumption during those months.
We forecast East Coast distillate inventories to remain between 20% and 30% below the five-year average through the upcoming winter. With low global distillate fuel inventories, we expect East Coast importers will face difficulty boosting imports enough to bring inventory levels closer to normal during the winter heating season. After a brief recovery in 4Q26, East Coast distillate inventories reach their 2027 low point in April at 22.6 million barrels, 21% below the 2021–2025 average. We expect normalization in global oil markets and wider availability of distillate fuel next year will push the region’s stocks to 31.2 million barrels by December 2027, which would be about 15% below average.