
Elevated crack spreads and crude oil prices contribute to higher prices at the pump
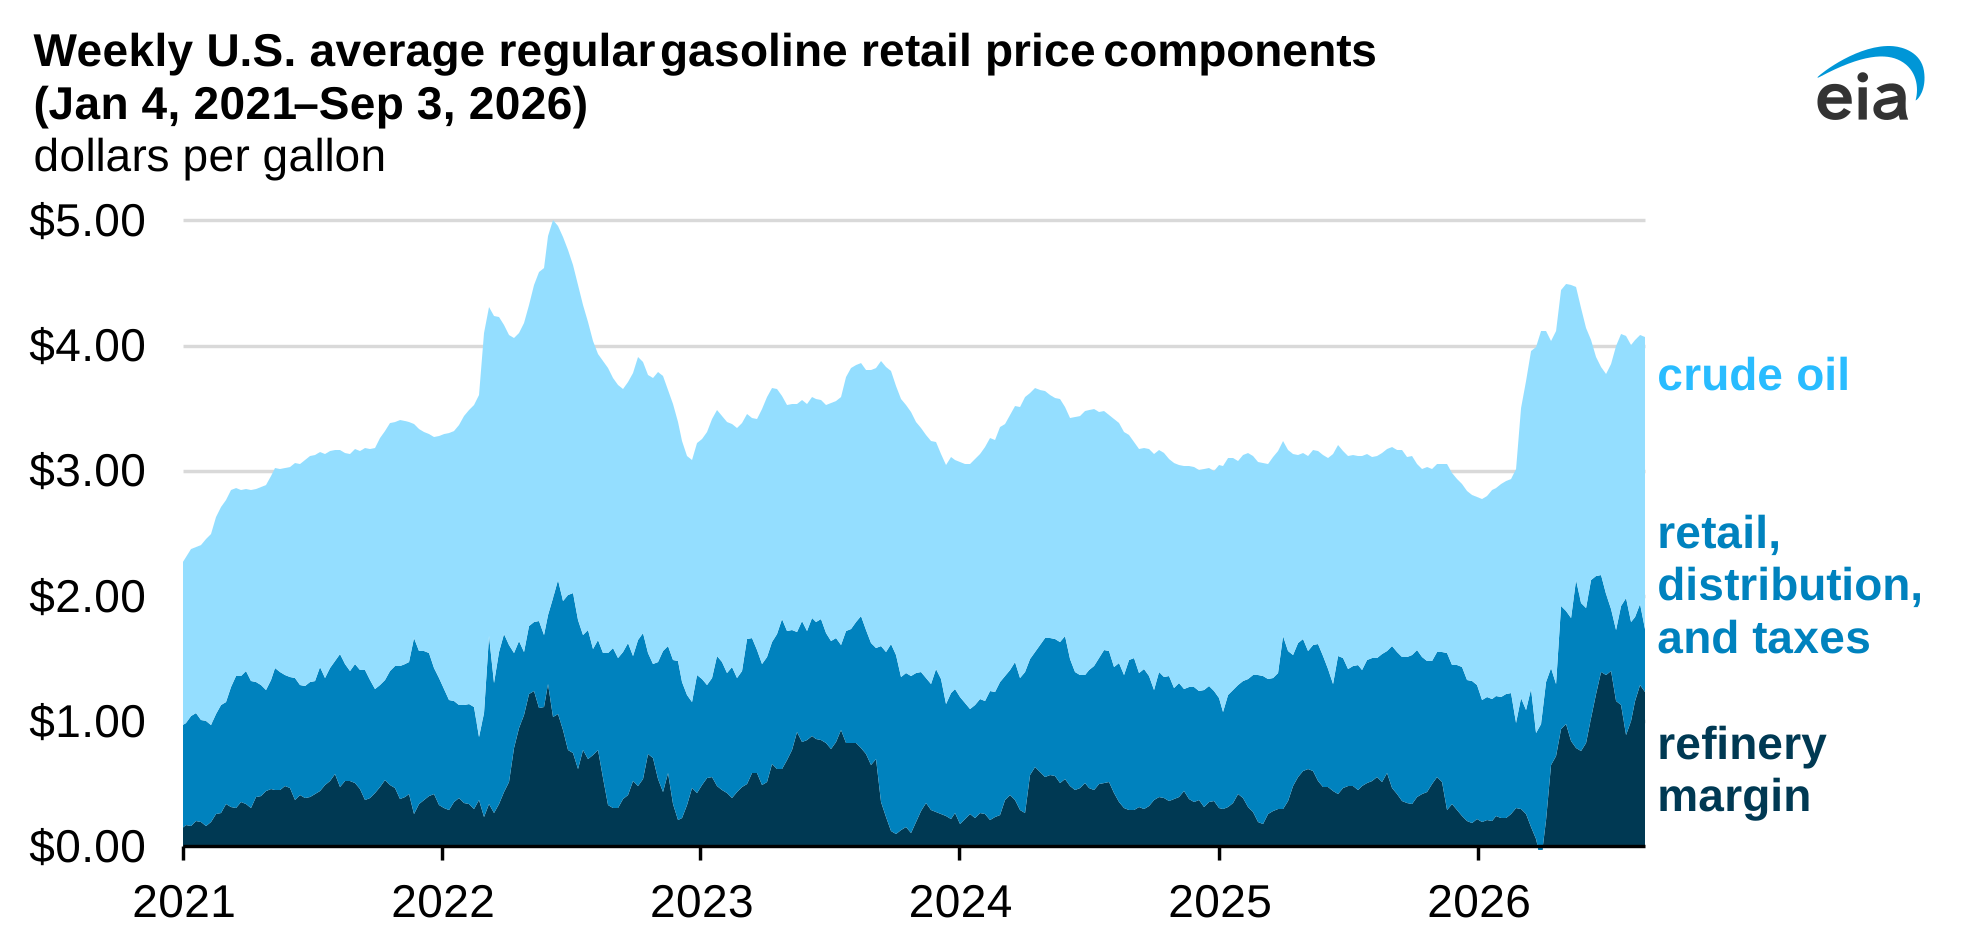
Note: The data for the week ending September 5 are estimated based on data through September 3. Refinery margin is calculated as the difference between the price of a gallon of wholesale gasoline at New York Harbor and the spot market price of a gallon of Brent crude oil. Retail, distribution, and taxes captures retail margins, distribution costs, and federal and state taxes; it is calculated as the difference between the U.S. average regular gasoline retail price and the wholesale gasoline price at New York Harbor. Crude oil reflects the spot market price of a gallon of Brent crude oil.
What are crack spreads and why are they elevated?
Crack spreads are indicators of the profitability of refining crude oil into petroleum products such as gasoline and diesel. One common crack spread is calculated by subtracting the spot market price of a gallon of crude oil from the wholesale price of a gallon of refined product. Since May, the gasoline crack spread in New York Harbor has averaged about $1 per gallon (gal) higher than in 2025, when the crack spread peaked around 60 cents/gal. Gasoline crack spreads are elevated primarily because of tight gasoline supplies globally.
Why are gasoline supplies tight?
Gasoline supplies are tight because of disruptions to global refining activities in Russia, China, and the Middle East.
Tighter global supplies and higher prices have both increased the cost of imported gasoline and increased demand for gasoline exports from the United States.
The East Coast and West Coast rely on imports to supplement local production. Since March, total U.S. imports of gasoline—including finished gasoline and blending components—have been 32% below the five-year (2021–2025) average. Shipments from the U.S. Gulf Coast on vessels operating under limited Jones Act waivers have partially offset reduced imports.
Crack spreads are even higher for distillate fuel oil and jet fuel because the disrupted refining activities tended to supply larger volumes of these fuels to global markets than they did gasoline. U.S. refiners have shifted product yields to maximize production of distillate and jet fuel because of the higher cracks. Since March, the crack spread for New York Harbor distillate fuel oil has averaged 74 cents/gal more than that of gasoline.
In the week ending August 28, U.S. distillate inventories were 14% below the five-year (2021–2025) average, compared with gasoline inventories, which were 6% below average. Internationally, demand for distillate fuel is particularly elevated because of lost production from refineries in Russia and the Middle East that produce relatively large yields of distillate fuel.
What is the average cost of a gallon of gasoline in different U.S. regions?
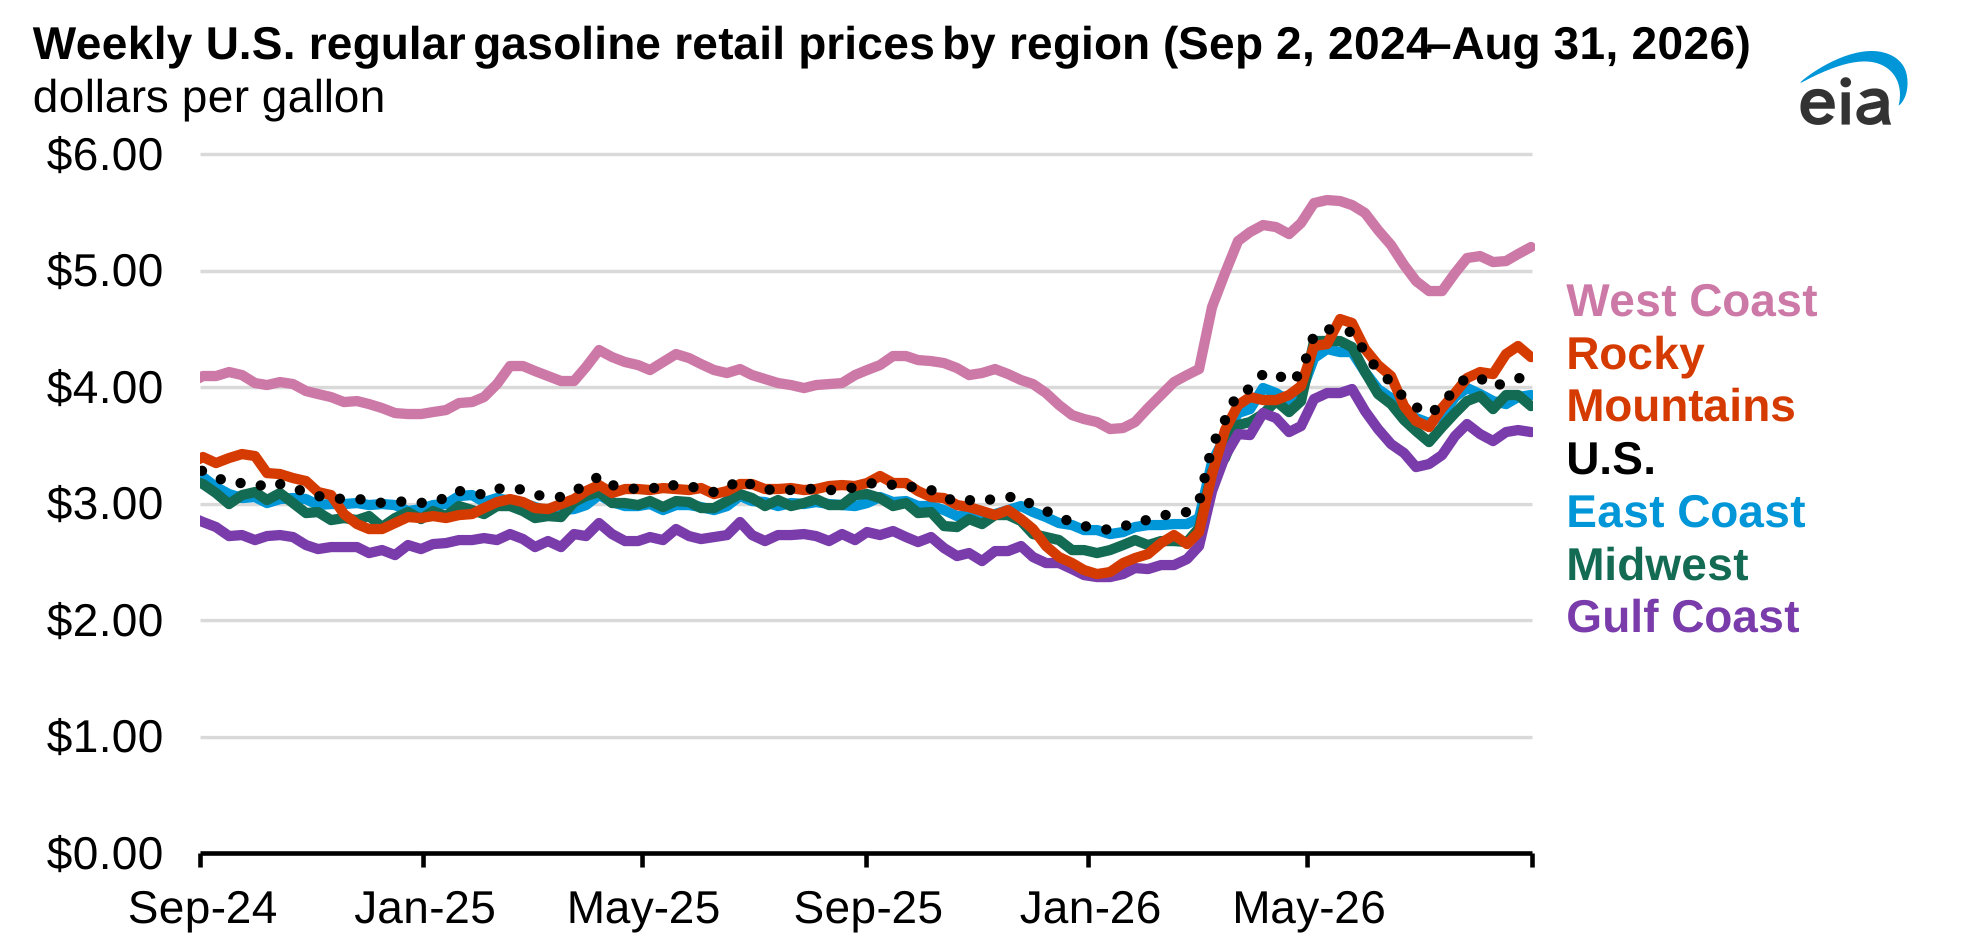
U.S. gasoline prices vary regionally, reflecting local supply and demand conditions, state fuel specifications, and state taxes. Compared with the U.S. retail price for regular-grade gasoline of $4.07/gal on the Monday before Labor Day, average prices were higher on the West Coast, at $5.21/gal, and in the Rocky Mountains, at $4.27/gal. Other regions were lower than the U.S. average, with the Midwest averaging $3.85/gal, East Coast averaging $3.94/gal, and Gulf Coast averaging $3.62/gal.
Principal contributor: Jimmy Troderman
Tags: prices, crack spread, crude oil, gasoline