
What goes into diesel prices?
The price of distillate fuel oil, often sold as diesel, is driven by the price of crude oil, retail margins, distribution costs, taxes, and crack spreads, the indicator we use for refining margins. Tight global supplies of distillate fuel oil and elevated crude oil prices have driven prices higher in recent months.
Crack spreads are indicators of the profitability of refining crude oil into petroleum products such as gasoline and diesel and are used as a proxy for refinery margins. We calculate the diesel crack spread by subtracting the spot market price of a gallon of crude oil from the wholesale price of a gallon of diesel. The high crack spread for diesel on top of the elevated price of a barrel of crude oil has driven retail prices up. High diesel prices can contribute to higher on-road and rail freight costs for all goods. The fuel also has significant seasonal uses in agriculture and home heating in the northeastern United States.
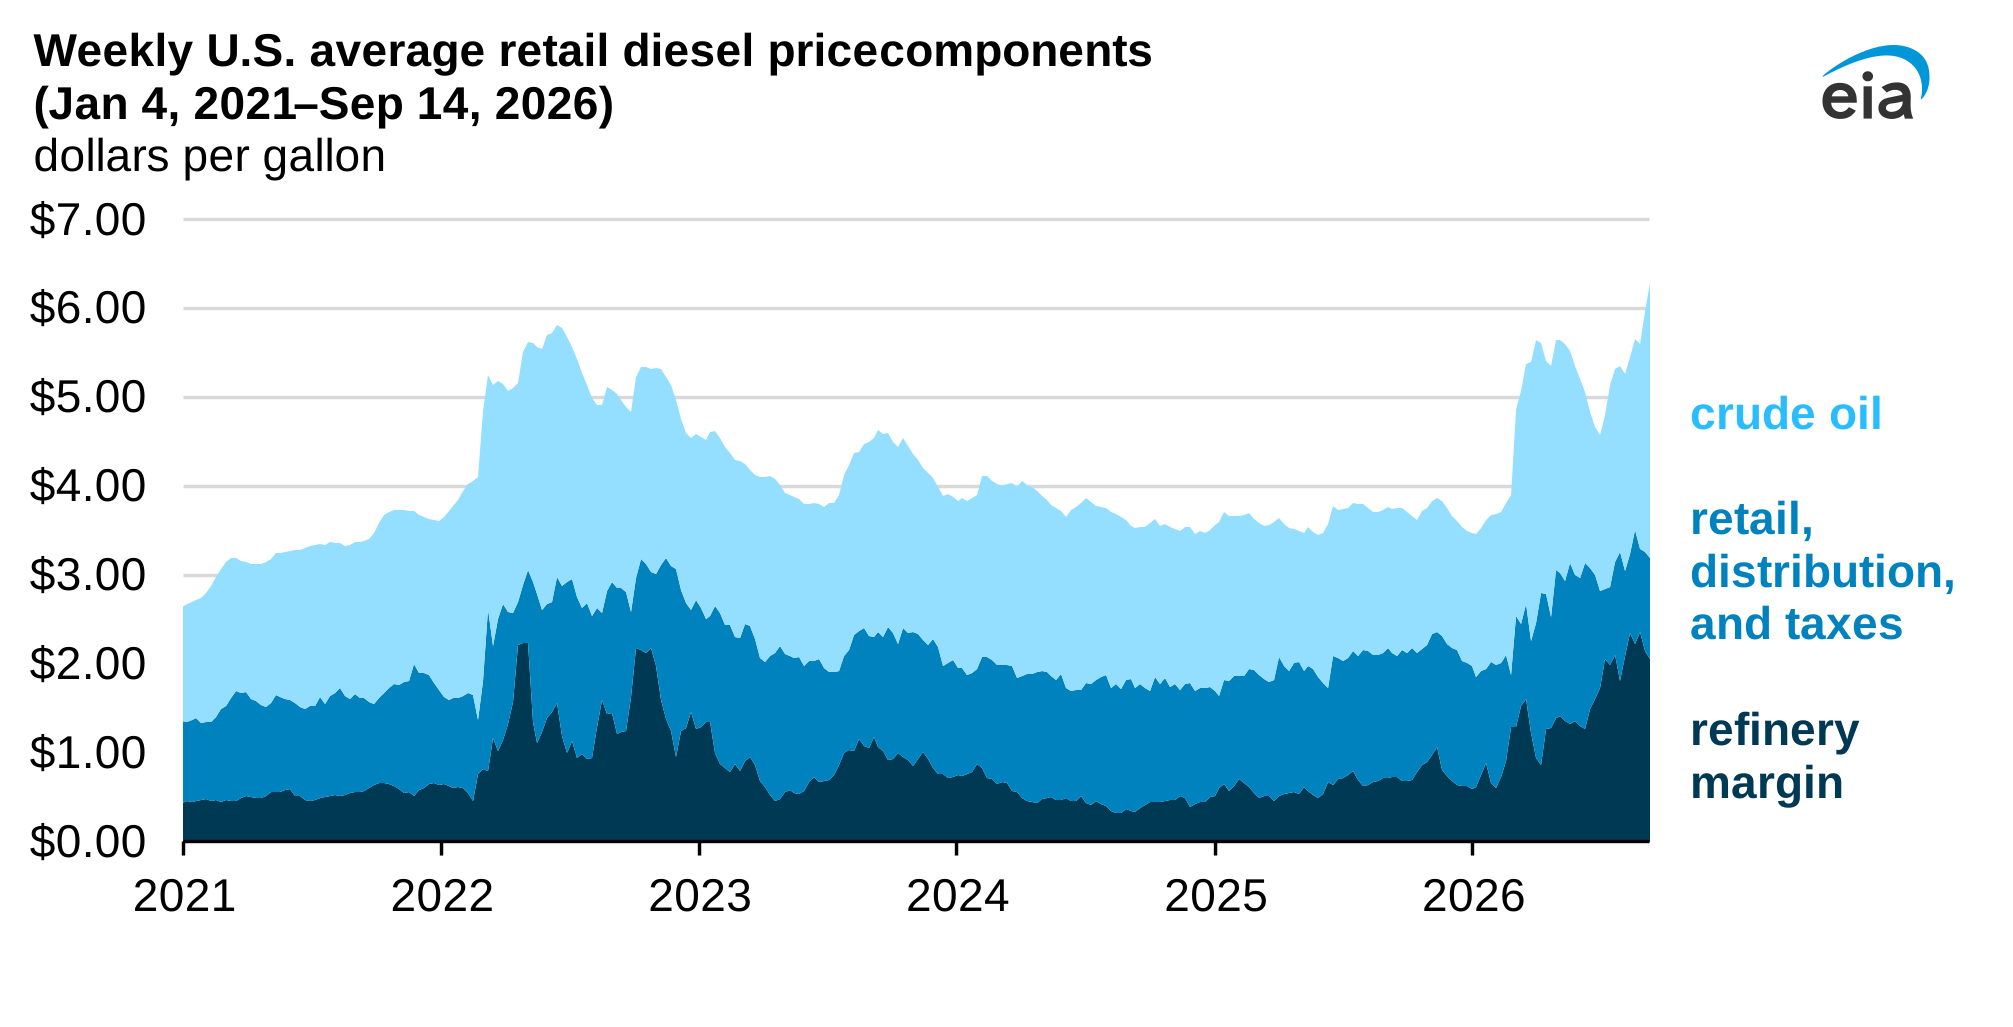
Note: Refinery margin is calculated as the difference between the price of a gallon of wholesale diesel at New York Harbor and the spot market price of a gallon of Brent crude oil. Retail, distribution, and taxes captures retail margins, distribution costs, and federal and state taxes; it is calculated as the difference between the U.S. average diesel retail price and the wholesale diesel price at New York Harbor. Crude oil reflects the spot market price of a gallon of Brent crude oil.
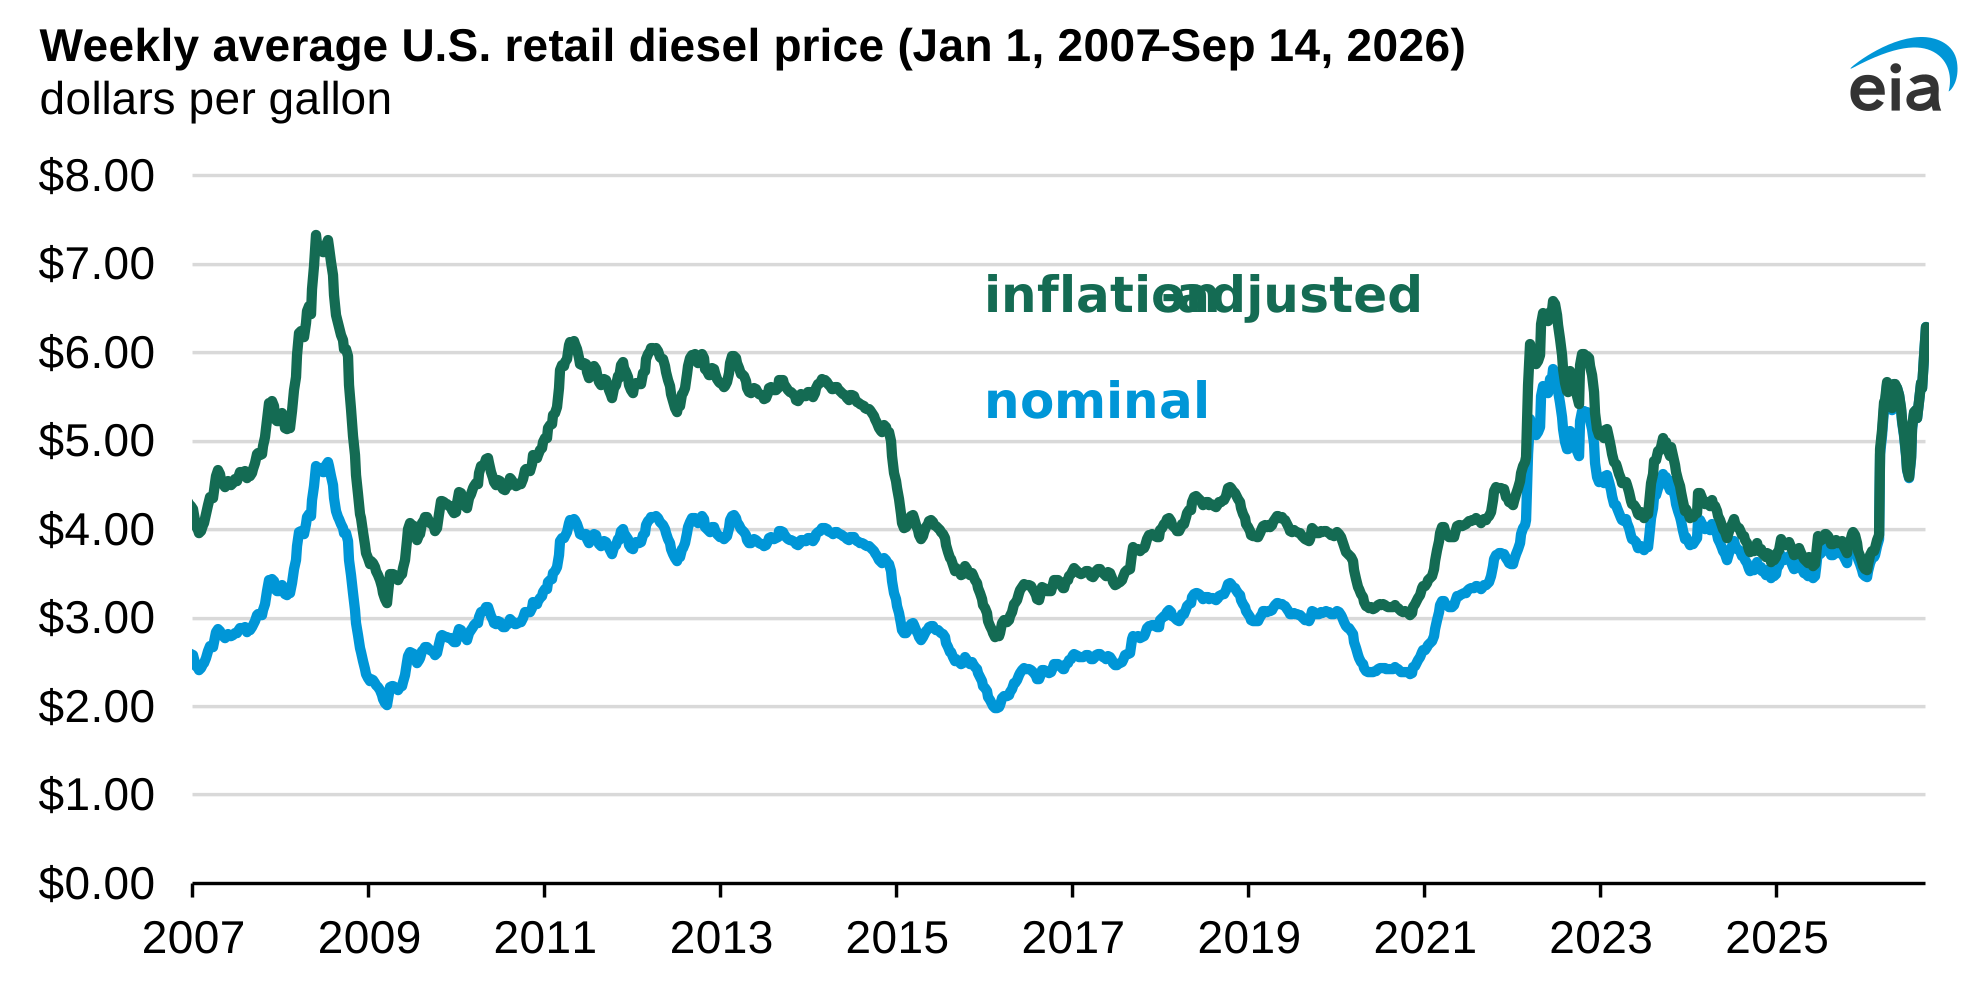
As of Monday, September 14, U.S. retail diesel prices averaged $6.29 per gallon (gal), according to our weekly Gasoline and Diesel Fuel Update. On an inflation-adjusted basis, this is the highest price since 2022, and the number is the highest on record in nominal price terms since EIA started publishing this series in 1994.
What's driving global distillate prices?
Global distillate fuel (including diesel) supplies are tight because of reduced global refining activity in Russia, China, and the Middle East. Reduced distillate production abroad has caused international prices to increase, driving up both the cost to import diesel to the United States and increasing demand for diesel exports from the United States.
What’s happening to supply in the United States?
U.S. distillate production between January and August of this year averaged 5.1 million barrels per day (b/d), the most since 2019. Refineries in the United States are also running at near-maximum levels with utilization of 97% the week ending September 11, according to our Weekly Petroleum Status Report.
Because of import and export dynamics, distillate net exports from the United States have remained near or above the previous five-year (2021–2025) high since February. As U.S. net exports increased, particularly during March and April, U.S. distillate inventories declined. Although distillate inventories typically build in the summer months, inventories have remained relatively flat this year. In the week ending September 11, U.S. distillate inventories were 15.8 million barrels, or 13%, below the five-year (2021–2025) seasonal average. Low distillate inventories have driven refining margins up.
In our September Short-Term Energy Outlook (STEO), we assume that global production of distillate fuel will remain below last year’s levels in the coming months, contributing to sustained high net exports, inventories remaining low, and prices remaining elevated.
Principal contributor: Hannah Breul
Tags: diesel, gasoline, crack spread, rail