Winter Fuels Outlook 2023–24
- Winter Fuels Outlook forecasts updated April 9, 2024
- Winter Fuels Outlook monthly forecast updates updated April 9, 2024
- Winter Fuels Outlook progress tracker updated April 9, 2024
- Winter Fuels Outlook webinar held October 16, 2023 (PowerPoint)
- Winter Fuels Outlook webinar held October 16, 2023 (YouTube)
For each Short-Term Energy Outlook (STEO) released during the winter of 2023–24, we will update our forecast values and compare them in the Monthly Forecast Updates table below.
Monthly Forecast Updates
| Monthly Expenditures | % change from prev. winter | ||||||
|---|---|---|---|---|---|---|---|
| Nov | Dec | Jan | Feb | Mar | total | ||
| Natural Gas | $102 | $133 | $143 | $118 | $105 | $601 | -21% |
| Electricity | $187 | $222 | $241 | $218 | $194 | $1,063 | -1% |
| Propane | $208 | $293 | $331 | $279 | $232 | $1,343 | -3% |
| Heating Oil | $287 | $395 | $451 | $384 | $335 | $1,851 | +8% |
| Monthly Heating Degree Days | % change from prev. winter | ||||||
| Nov | Dec | Jan | Feb | Mar | total | ||
| U.S. Average | 489 | 729 | 809 | 658 | 537 | 3,223 | 0% |
| Monthly Expenditures | % change from prev. winter | ||||||
|---|---|---|---|---|---|---|---|
| Nov | Dec | Jan | Feb | Mar | total | ||
| Natural Gas | $105 | $137 | $147 | $121 | $107 | $616 | -19% |
| Electricity | $187 | $222 | $242 | $219 | $195 | $1,065 | -1% |
| Propane | $205 | $290 | $330 | $279 | $234 | $1,338 | -3% |
| Heating Oil | $273 | $391 | $446 | $382 | $333 | $1,824 | +6% |
| Monthly Heating Degree Days | % change from prev. winter | ||||||
| Nov | Dec | Jan | Feb | Mar | total | ||
| U.S. average | 488 | 730 | 809 | 659 | 537 | 3,222 | 0% |
| Monthly Expenditures | % change from prev. winter | ||||||
|---|---|---|---|---|---|---|---|
| Nov | Dec | Jan | Feb | Mar | total | Natural Gas | $108 | $135 | $145 | $119 | $105 | $611 | -20% |
| Electricity | $190 | $224 | $243 | $220 | $196 | $1,072 | -1% |
| Propane | $201 | $305 | $339 | $287 | $242 | $1,328 | -4% |
| Heating Oil | $290 | $370 | $406 | $349 | $307 | $1,722 | 0% |
| Monthly Heating Degree Days | % change from prev. winter | ||||||
| Nov | Dec | Jan | Feb | Mar | total | ||
| U.S. average | 498 | 725 | 809 | 659 | 537 | 3,227 | 0% |
| Monthly Expenditures | % change from prev. winter | ||||||
|---|---|---|---|---|---|---|---|
| Nov | Dec | Jan | Feb | Mar | total | ||
| Natural Gas | $109 | $125 | $148 | $120 | $105 | $608 | -20% |
| Electricity | $193 | $214 | $249 | $218 | $195 | $1,069 | -1% |
| Propane | $203 | $274 | $360 | $299 | $252 | $1,345 | -3% |
| Heating Oil | $300 | $335 | $413 | $350 | $304 | $1,701 | -1% |
| Monthly Heating Degree Days | % change from prev. winter | ||||||
| Nov | Dec | Jan | Feb | Mar | total | ||
| U.S. average | 503 | 649 | 830 | 658 | 537 | 3,178 | -1% |
| Monthly Expenditures | % change from prev. winter | ||||||
|---|---|---|---|---|---|---|---|
| Nov | Dec | Jan | Feb | Mar | total | ||
| Natural Gas | $113 | $125 | $154 | $122 | $105 | $620 | -19% |
| Electricity | $199 | $212 | $254 | $225 | $195 | $1,085 | +1% |
| Propane | $203 | $263 | $367 | $309 | $253 | $1,351 | -2% |
| Heating Oil | $300 | $313 | $397 | $366 | $308 | $1,685 | -2% |
| Monthly Heating Degree Days | % change from prev. winter | ||||||
| Nov | Dec | Jan | Feb | Mar | total | ||
| U.S. average | 505 | 620 | 846 | 677 | 535 | 3,183 | -1% |
| Monthly Expenditures | % change from prev. winter | ||||||
|---|---|---|---|---|---|---|---|
| Nov | Dec | Jan | Feb | Mar | total | ||
| Natural Gas | $113 | $127 | $155 | $117 | $102 | $614 | -20% |
| Electricity | $199 | $221 | $257 | $216 | $192 | $1,085 | +1% |
| Propane | $203 | $264 | $364 | $276 | $250 | $1,317 | -5% |
| Heating Oil | $300 | $314 | $390 | $353 | $284 | $1,641 | -5% |
| Monthly Heating Degree Days | % change from prev. winter | ||||||
| Nov | Dec | Jan | Feb | Mar | total | ||
| U.S. average | 504 | 624 | 840 | 616 | 503 | 3,087 | -4% |
| Monthly Expenditures | % change from prev. winter | ||||||
|---|---|---|---|---|---|---|---|
| Nov | Dec | Jan | Feb | Mar | total | ||
| Natural Gas | $113 | $127 | $150 | $109 | $101 | $601 | -21% |
| Electricity | $199 | $221 | $258 | $210 | $192 | $1,080 | 0% |
| Propane | $203 | $264 | $365 | $259 | $234 | $1,299 | -6% |
| Heating Oil | $300 | $314 | $390 | $329 | $277 | $1,611 | -6% |
| Monthly Heating Degree Days | % change from prev. winter | ||||||
| Nov | Dec | Jan | Feb | Mar | total | ||
| U.S. average | 505 | 624 | 840 | 573 | 500 | 3,042 | -5% |
Note: Propane expenditures are a household-weighted average of the Northeast, Midwest, and South regions.
Progress Tracker
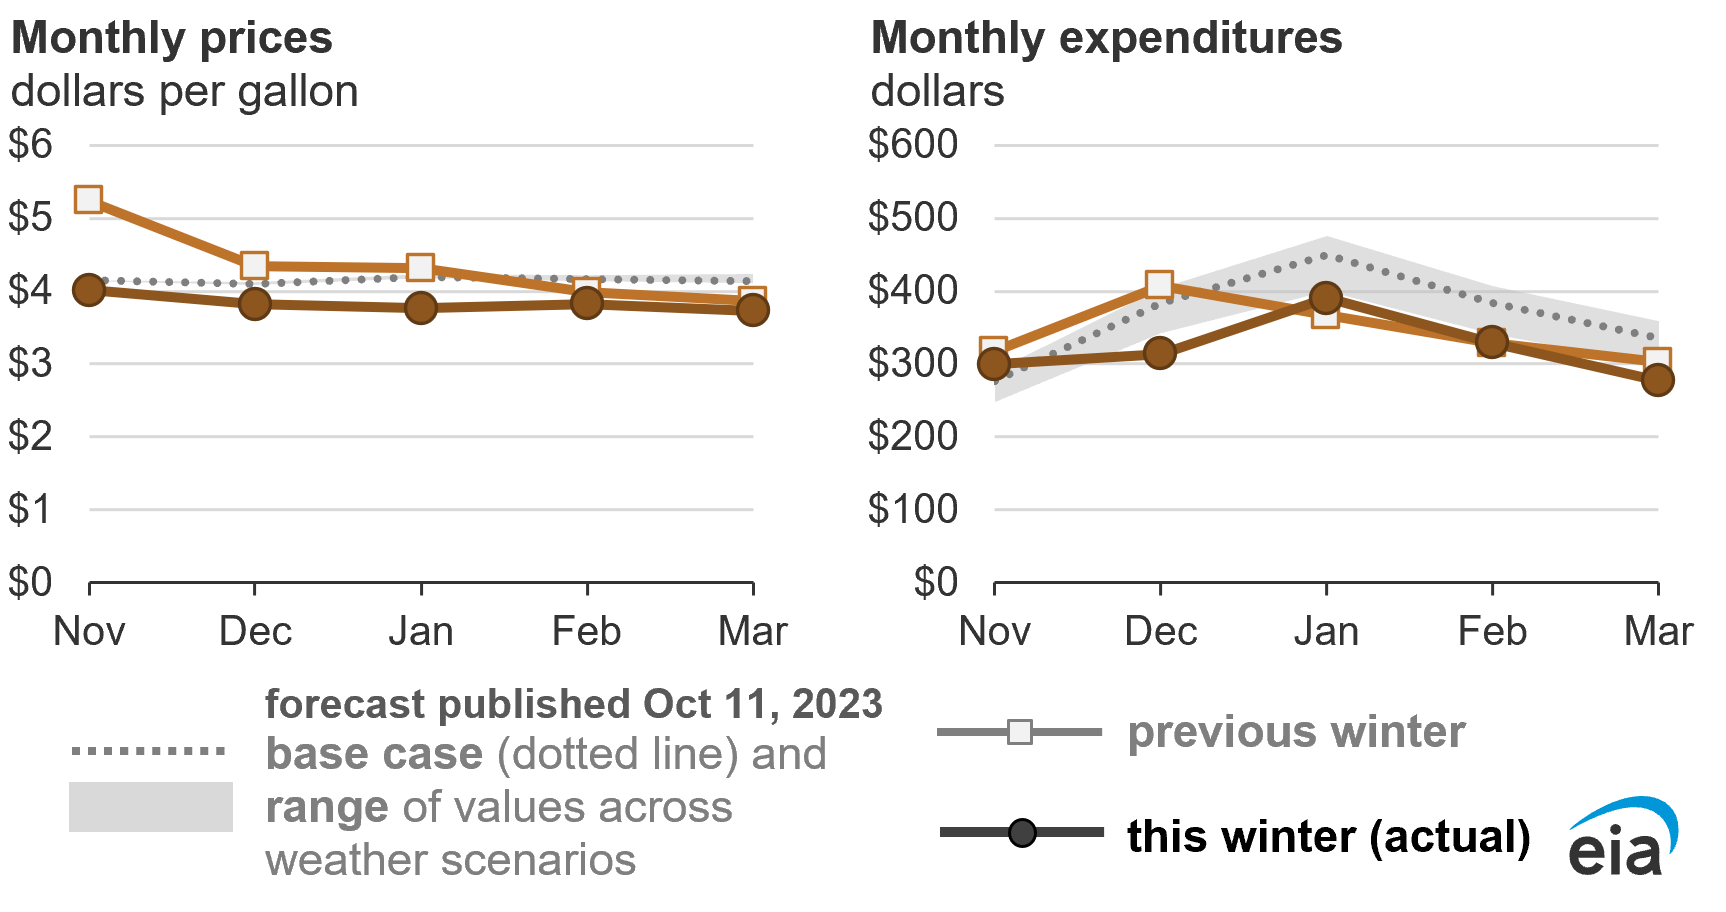
The data values and analysis below were published with the October 2023 edition of the Short-Term Energy Outlook on October 11, 2023.
Winter heating prices for U.S. households are expected to remain relatively flat or decrease this season, depending on main heating fuel households use and the region in which they are located. Because we expect natural gas prices will be lower than last year, the 46% of U.S. households that use natural gas as their main heating fuel will likely spend less on heating this winter compared with last winter.
This winter, we expect temperatures in the western United States to be warmer than the previous winter, which was much colder than average. As a result, households in the West, regardless of fuel, will likely spend less on heating this winter compared with last winter. Combined, households that heat with natural gas and those that are in the West account for a total of 56% of all U.S. households.
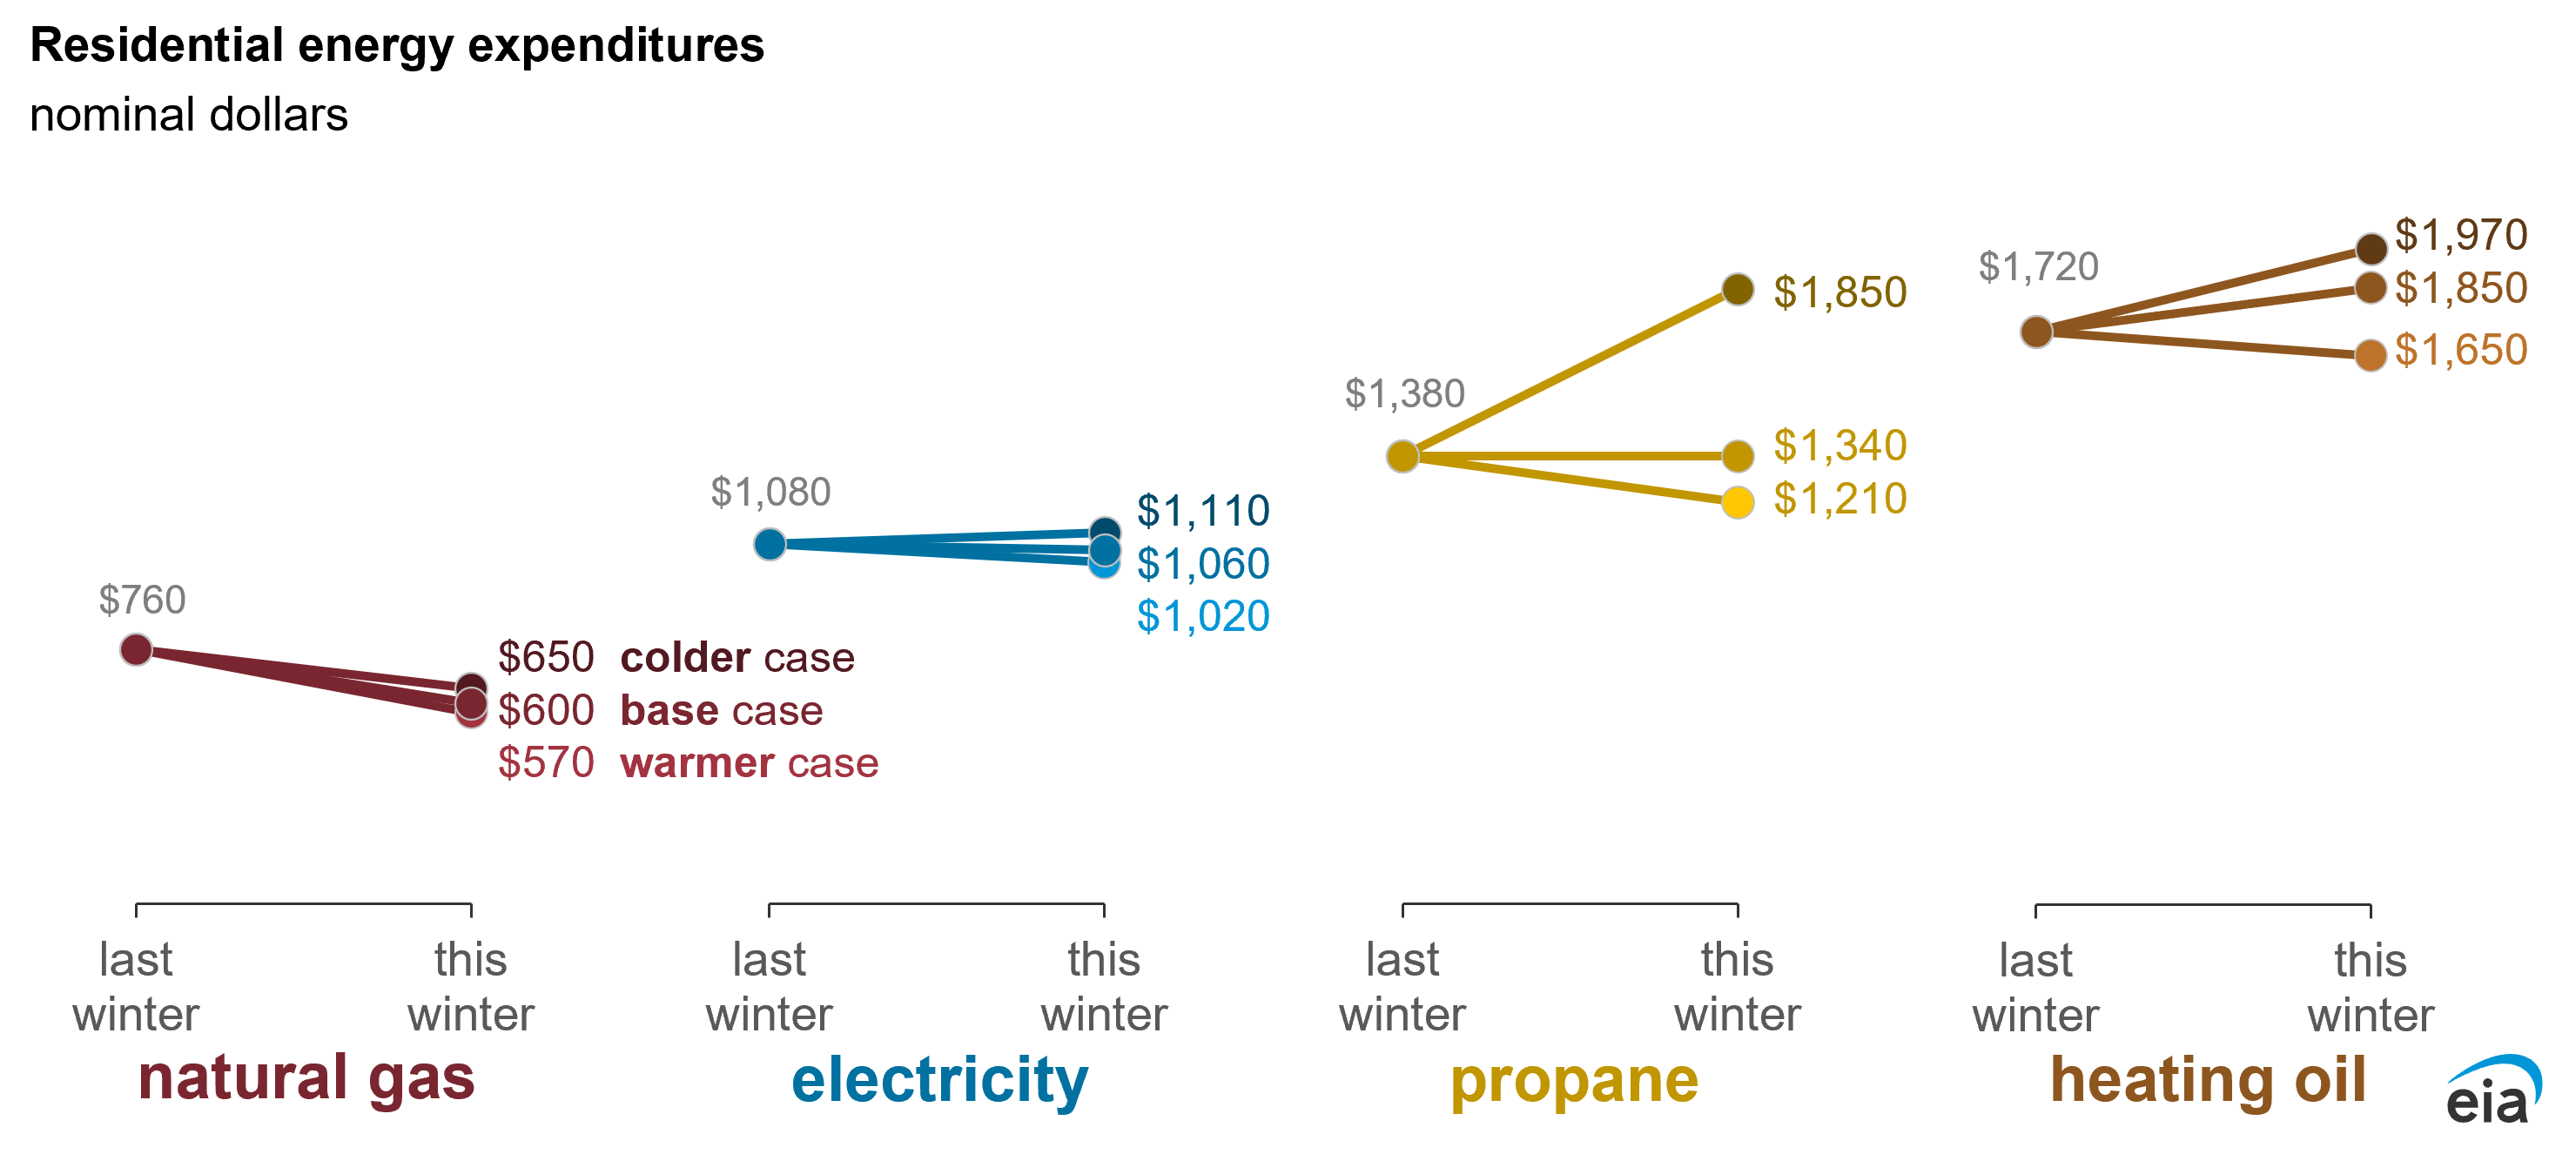
For homes that primarily heat using electricity, we expect expenditures mostly in line with last winter that do not vary much based on weather outcomes. In our base temperature case, we expect spending by homes heating primarily with propane will decrease slightly, but expenditures for homes using propane will vary significantly based on region and actual weather outcomes. Expenditures for homes heating primarily with heating oil are up from last year in our forecast unless actual winter temperatures are warmer than expected.
| Base Case |
% change |
10% Colder |
% change |
10% Warmer |
% change |
|
|---|---|---|---|---|---|---|
| Northeast | $761 | -18% | $827 | -10% | $719 | -22% |
| Midwest | $581 | -21% | $618 | -15% | $561 | -23% |
| South | $494 | -15% | $527 | -9% | $476 | -18% |
| West | $590 | -30% | $644 | -24% | $552 | -34% |
| United States | $601 | -21% | $647 | -15% | $574 | -25% |
| Base Case |
% change |
10% Colder |
% change |
10% Warmer |
% change |
|
|---|---|---|---|---|---|---|
| Northeast | $1,465 | +4% | $1,545 | +9% | $1,403 | -1% |
| Midwest | $1,213 | -2% | $1,280 | +3% | $1,162 | -6% |
| South | $1,001 | +2% | $1,047 | +7% | $965 | -2% |
| West | $1,007 | -9% | $1,058 | -5% | $967 | -13% |
| United States | $1,063 | -1% | $1,114 | +3% | $1,024 | -5% |
| Base Case |
% change |
10% Colder |
% change |
10% Warmer |
% change |
|
|---|---|---|---|---|---|---|
| Northeast | $1,696 | +1% | $2,057 | +23% | $1,398 | -17% |
| Midwest | $1,294 | -11% | $2,030 | +40% | $1,269 | -13% |
| South | $1,184 | +6% | $1,524 | +36% | $1,021 | -9% |
| United States | $1,343 | -3% | $1,847 | +34% | $1,205 | -13% |
| Base Case |
% change |
10% Colder |
% change |
10% Warmer |
% change |
|
|---|---|---|---|---|---|---|
| United States | $1,851 | +8% | $1,969 | +14% | $1,648 | -4% |
Note: Percentage change values are relative to previous winter. Propane expenditures are a household-weighted average of the Northeast, Midwest, and South regions.
Because average demand for heating fuels in the winter exceeds production in the United States, inventories are an important source of winter supply. U.S. natural gas and propane inventories are above the five-year (2018–2022) average going into this winter heating season because of natural gas production growth and because a mild winter in the eastern part of the country last year left inventories for natural gas and propane high. These relatively high inventories have helped keep prices for those fuels below year-ago levels. However, distillate fuel inventories, a category which includes heating oil, are well below the five-year average.
Energy expenditures
Three main factors determine spending on space heating fuel: household characteristics, weather, and energy prices. The following three sections give a broad overview of those determinants for this winter, followed by a more specific discussion for each of the four main heating fuels.
The forecast price and winter energy spending presented in this report are mostly in nominal (i.e., not inflation-adjusted) terms. Based on forecasts for the Consumer Price Index from the S&P Global macroeconomic model, we assume inflation will average 3% this winter, meaning an average basket of consumer goods will cost 3% more compared with last winter. Given that rate of inflation, increases in expenses and prices adjusted for inflation would need to be about 3% higher than the values reported to indicate increases beyond inflation.
Household characteristics
The average household expenses discussed in the Winter Fuels Outlook (WFO) are broad measures for comparing recent winters. Fuel expenditures depend on the size and energy efficiency of individual homes, their heating equipment and thermostat settings, and the weather conditions. Each fuel also has its own market structure, physical infrastructure, regulations, and limitations that can affect how retail prices move in relationship to wholesale prices.
Data values: Table CE4.16: Annual household end-use expenditures by fuel in the U.S. - averages
We use our Residential Energy Consumption Survey (RECS) as a base to estimate average energy consumption during the winter in each region. This WFO is the first edition to incorporate the recently released 2020 RECS. We group households by primary space heating fuel: natural gas, heating oil, electricity, and propane.
| 2018 | 2019 | 2020 | 2021 | 2022 | 2023 | % change |
|
|---|---|---|---|---|---|---|---|
| Northeast | 12,295 | 12,307 | 11,959 | 11,924 | 12,052 | 12,234 | +2% |
| Midwest | 18,269 | 18,337 | 18,002 | 17,945 | 17,943 | 17,971 | +0% |
| South | 14,061 | 14,248 | 14,255 | 14,401 | 14,456 | 14,467 | +0% |
| West | 15,559 | 15,694 | 15,367 | 15,243 | 15,345 | 15,417 | +0% |
| United States | 60,184 | 60,586 | 59,583 | 59,514 | 59,795 | 60,088 | +0% |
| 2018 | 2019 | 2020 | 2021 | 2022 | 2023 | % change |
|
|---|---|---|---|---|---|---|---|
| Northeast | 3,521 | 3,509 | 3,681 | 3,958 | 3,990 | 4,069 | +2% |
| Midwest | 6,023 | 6,012 | 6,197 | 6,446 | 6,593 | 6,813 | +3% |
| South | 30,771 | 31,002 | 31,678 | 32,713 | 33,393 | 34,134 | +2% |
| West | 9,611 | 9,682 | 10,112 | 10,573 | 10,579 | 10,714 | +1% |
| United States | 49,926 | 50,205 | 51,668 | 53,690 | 54,555 | 55,730 | +2% |
| 2018 | 2019 | 2020 | 2021 | 2022 | 2023 | % change |
|
|---|---|---|---|---|---|---|---|
| Northeast | 1,031 | 1,033 | 1,118 | 1,229 | 1,213 | 1,227 | +1% |
| Midwest | 2,179 | 2,178 | 2,174 | 2,249 | 2,201 | 2,175 | -1% |
| South | 1,864 | 1,914 | 1,910 | 1,903 | 1,977 | 2,032 | +3% |
| West | 975 | 998 | 1,029 | 1,068 | 1,076 | 1,080 | +0% |
| United States | 6,048 | 6,123 | 6,232 | 6,450 | 6,466 | 6,513 | +1% |
| 2018 | 2019 | 2020 | 2021 | 2022 | 2023 | % change |
|
|---|---|---|---|---|---|---|---|
| Northeast | 4,610 | 4,694 | 4,448 | 4,155 | 4,046 | 3,923 | -3% |
| Midwest | 269 | 276 | 257 | 231 | 219 | 208 | -5% |
| South | 576 | 588 | 558 | 492 | 486 | 481 | -1% |
| West | 214 | 217 | 207 | 195 | 185 | 177 | -5% |
| United States | 5,669 | 5,775 | 5,471 | 5,072 | 4,936 | 4,789 | -3% |
| 2018 | 2019 | 2020 | 2021 | 2022 | 2023 | % change |
|
|---|---|---|---|---|---|---|---|
| Northeast | 448 | 458 | 423 | 384 | 370 | 347 | -6% |
| Midwest | 497 | 513 | 470 | 416 | 429 | 430 | +0% |
| South | 473 | 490 | 432 | 378 | 385 | 382 | -1% |
| West | 670 | 687 | 628 | 576 | 601 | 611 | +2% |
| United States | 2,088 | 2,148 | 1,953 | 1,753 | 1,785 | 1,770 | -1% |
| 2018 | 2019 | 2020 | 2021 | 2022 | 2023 | % change |
|
|---|---|---|---|---|---|---|---|
| Northeast | 451 | 459 | 517 | 554 | 561 | 592 | +5% |
| Midwest | 347 | 354 | 372 | 382 | 400 | 420 | +5% |
| South | 455 | 482 | 590 | 711 | 705 | 717 | +2% |
| West | 1,091 | 1,072 | 1,087 | 1,122 | 1,208 | 1,300 | +8% |
| United States | 2,344 | 2,367 | 2,565 | 2,769 | 2,874 | 3,029 | +5% |
Note: Percentage change value is relative to previous winter.
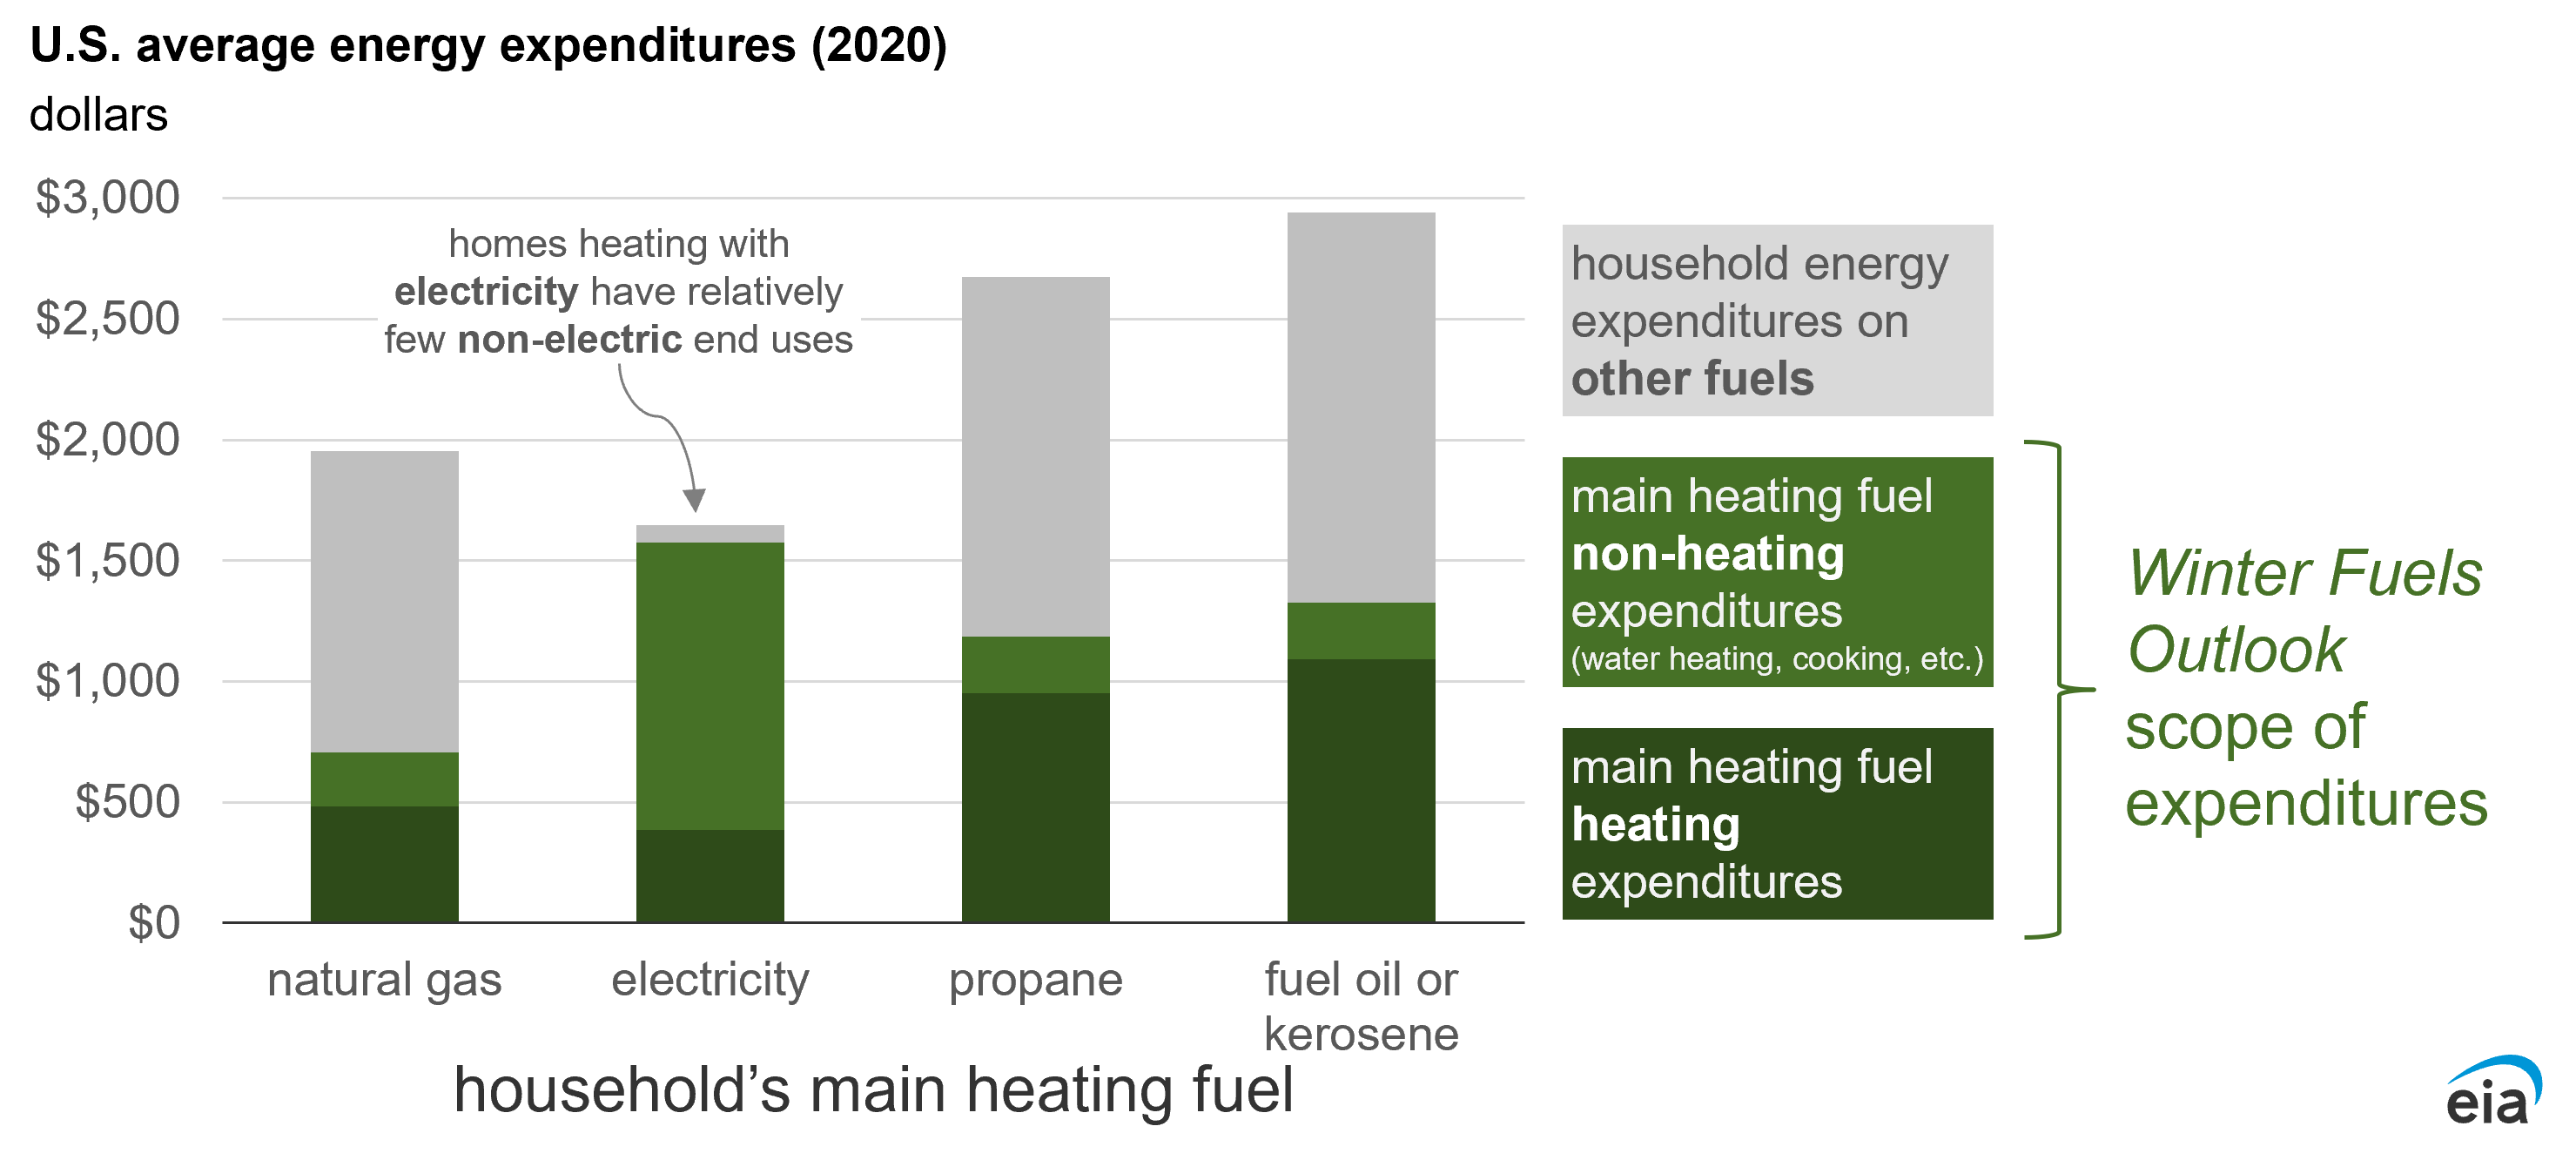
The total winter expenditure data we show represents all uses for each primary heating fuel, not just the portion attributable to heating. For example, the expenditures included for households that heat primarily with electricity in this report would also include electricity used for appliances and lighting. Because electricity has the widest range of uses among the fuels, the combined electricity consumption we use to determine expenditures tends to be less sensitive to changes in temperature than other fuels.
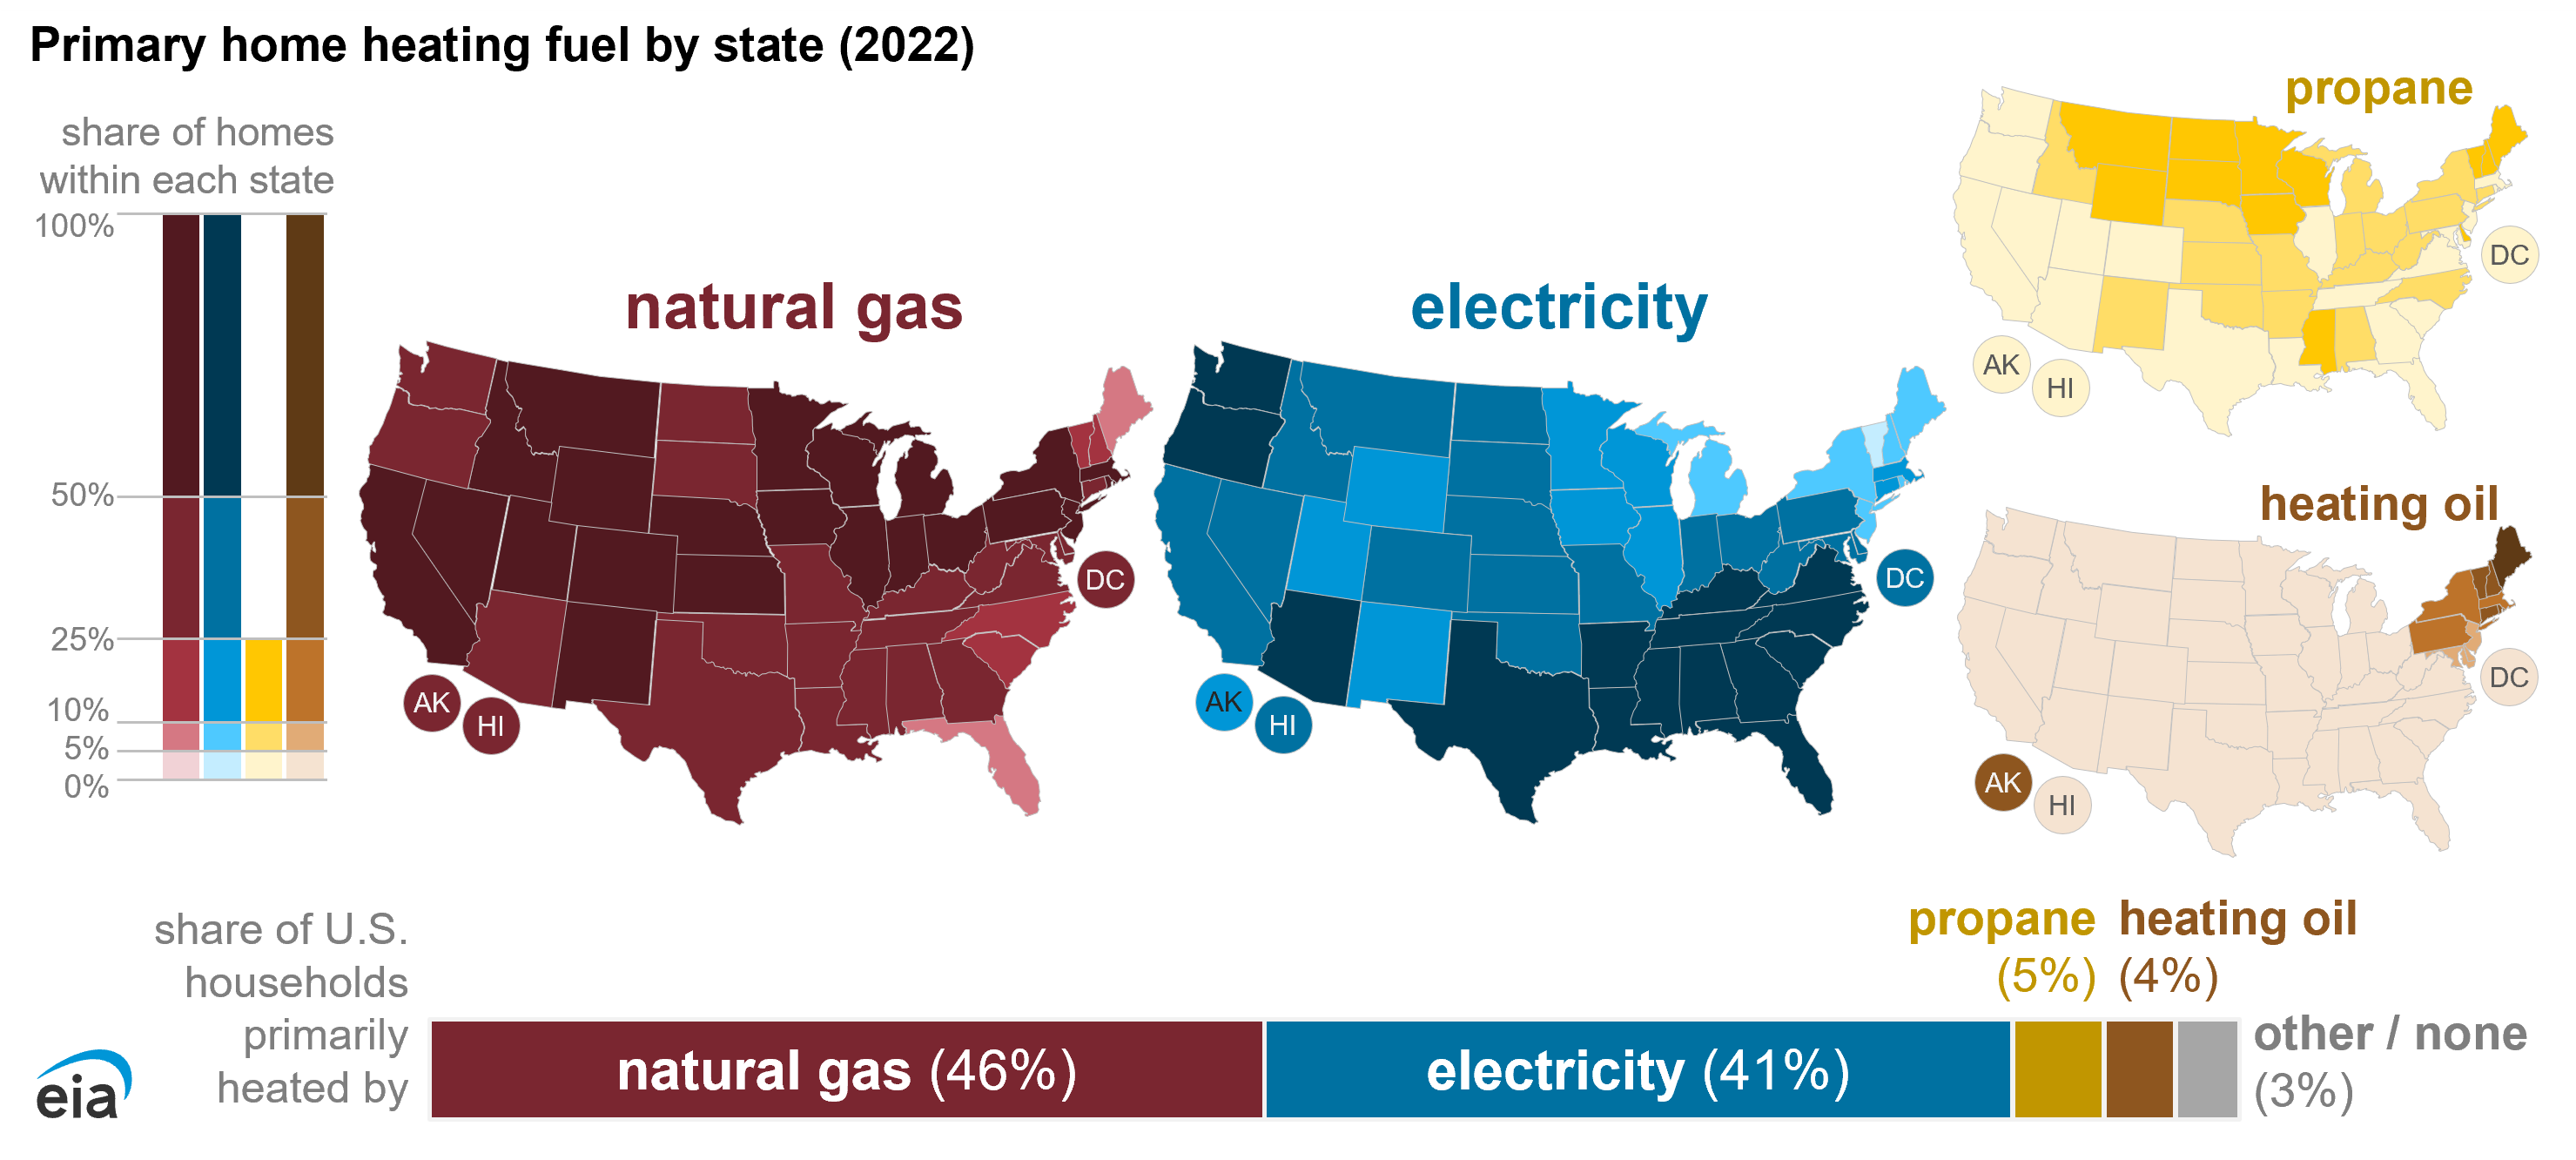
Natural gas is the main space heating fuel in 46% of U.S. homes, making it the most widely used residential heating fuel in the country. Electricity is also widely used for heating, especially in the South. The share of U.S. homes that use electricity as a primary space heating fuel has grown to 42% from 38% 10 years ago.
Propane and heating oil are the primary space heating fuels in a much smaller share of homes nationally but are used widely in regions that tend to have the some of the coldest winters. The most propane use for residential heating occurs in the upper Midwest and Northeast. Heating oil use is used for residential heating most in the Northeast.
| Expenditures (dollars) | % change | ||||||
|---|---|---|---|---|---|---|---|
| Nov | Dec | Jan | Feb | Mar | total | ||
| Northeast | 127 | 160 | 181 | 155 | 139 | 761 | -18% |
| Midwest | 100 | 129 | 137 | 115 | 100 | 581 | -21% |
| South | 87 | 111 | 125 | 94 | 77 | 494 | -15% |
| West | 101 | 137 | 137 | 113 | 102 | 590 | -30% |
| U.S. average | 102 | 133 | 143 | 118 | 105 | 601 | -21% |
| Price (dollars per thousand cubic feet) | % change | ||||||
| Nov | Dec | Jan | Feb | Mar | total | ||
| Northeast | 14.21 | 13.08 | 12.90 | 12.71 | 12.87 | 13.10 | -22% |
| Midwest | 10.24 | 9.41 | 8.85 | 8.90 | 9.33 | 9.28 | -23% |
| South | 14.08 | 12.10 | 12.15 | 11.64 | 12.57 | 12.40 | -22% |
| West | 13.62 | 13.81 | 14.15 | 13.55 | 13.62 | 13.77 | -17% |
| U.S. average | 12.53 | 11.72 | 11.49 | 11.24 | 11.73 | 11.70 | -21% |
| Consumption (million cubic feet) | % change | ||||||
| Nov | Dec | Jan | Feb | Mar | total | ||
| Northeast | 9 | 12 | 14 | 12 | 11 | 58 | +6% |
| Midwest | 10 | 14 | 15 | 13 | 11 | 63 | +3% |
| South | 6 | 9 | 10 | 8 | 6 | 40 | +9% |
| West | 7 | 10 | 10 | 8 | 8 | 43 | -15% |
| U.S. average | 8 | 11 | 12 | 10 | 9 | 51 | -0% |
| Expenditures (dollars) | % change | ||||||
|---|---|---|---|---|---|---|---|
| Nov | Dec | Jan | Feb | Mar | total | ||
| Northeast | 241 | 292 | 337 | 313 | 282 | 1,465 | +4% |
| Midwest | 213 | 253 | 272 | 250 | 224 | 1,213 | -2% |
| South | 174 | 212 | 232 | 207 | 176 | 1,001 | +2% |
| West | 187 | 210 | 221 | 199 | 189 | 1,007 | -9% |
| U.S. average | 187 | 222 | 241 | 218 | 194 | 1,063 | -1% |
| Price (cents per kilowatthour) | % change | ||||||
| Nov | Dec | Jan | Feb | Mar | total | ||
| Northeast | 21.50 | 21.30 | 22.31 | 22.85 | 22.30 | 22.07 | -0% |
| Midwest | 14.44 | 13.64 | 13.47 | 14.06 | 14.37 | 13.95 | -4% |
| South | 13.51 | 12.90 | 13.07 | 13.64 | 13.56 | 13.31 | -3% |
| West | 16.99 | 15.88 | 16.97 | 16.82 | 17.02 | 16.71 | +1% |
| U.S. average | 15.37 | 14.66 | 15.01 | 15.47 | 15.52 | 15.18 | -2% |
| Consumption (kilowatthours) | % change | ||||||
| Nov | Dec | Jan | Feb | Mar | total | ||
| Northeast | 1,121 | 1,373 | 1,509 | 1,370 | 1,264 | 6,636 | +4% |
| Midwest | 1,475 | 1,857 | 2,022 | 1,779 | 1,560 | 8,693 | +2% |
| South | 1,291 | 1,645 | 1,775 | 1,517 | 1,296 | 7,523 | +5% |
| West | 1,103 | 1,323 | 1,302 | 1,185 | 1,114 | 6,027 | -10% |
| U.S. average | 1,216 | 1,513 | 1,607 | 1,411 | 1,251 | 6,999 | +1% |
| Expenditures (dollars) | % change | ||||||
|---|---|---|---|---|---|---|---|
| Nov | Dec | Jan | Feb | Mar | total | ||
| Northeast | 263 | 354 | 404 | 356 | 319 | 1,696 | +1% |
| Midwest | 196 | 285 | 321 | 272 | 227 | 1,294 | -11% |
| South | 186 | 269 | 300 | 240 | 188 | 1,184 | +6% |
| U.S. average | 208 | 293 | 331 | 279 | 232 | 1,343 | -3% |
| Price (dollars per gallon) | % change | ||||||
| Nov | Dec | Jan | Feb | Mar | total | ||
| Northeast | 3.13 | 3.12 | 3.13 | 3.15 | 3.16 | 3.14 | -5% |
| Midwest | 1.83 | 1.92 | 1.92 | 1.94 | 1.95 | 1.91 | -13% |
| South | 2.93 | 2.92 | 2.93 | 2.95 | 2.96 | 2.94 | -3% |
| U.S. average | 2.44 | 2.46 | 2.46 | 2.48 | 2.48 | 2.47 | -7% |
| Consumption (gallons) | % change | ||||||
| Nov | Dec | Jan | Feb | Mar | total | ||
| Northeast | 84 | 113 | 129 | 113 | 101 | 540 | +6% |
| Midwest | 107 | 149 | 167 | 140 | 116 | 679 | +2% |
| South | 64 | 92 | 102 | 82 | 64 | 403 | +9% |
| U.S. average | 85 | 119 | 134 | 112 | 93 | 545 | +4% |
| Expenditures (dollars) | % change | ||||||
|---|---|---|---|---|---|---|---|
| Nov | Dec | Jan | Feb | Mar | total | ||
| U.S. average | 287 | 395 | 451 | 384 | 335 | 1,851 | +8% |
| Price (dollars per gallon) | % change | ||||||
| Nov | Dec | Jan | Feb | Mar | total | ||
| U.S. average | 4.28 | 4.23 | 4.21 | 4.17 | 4.14 | 4.20 | -2% |
| Consumption (gallons) | % change | ||||||
| Nov | Dec | Jan | Feb | Mar | total | ||
| U.S. average | 67 | 93 | 107 | 92 | 81 | 440 | +10% |
Note: Percentage change value is relative to previous winter. Propane expenditures are a household-weighted average of the Northeast, Midwest, and South regions.
Weather assumptions
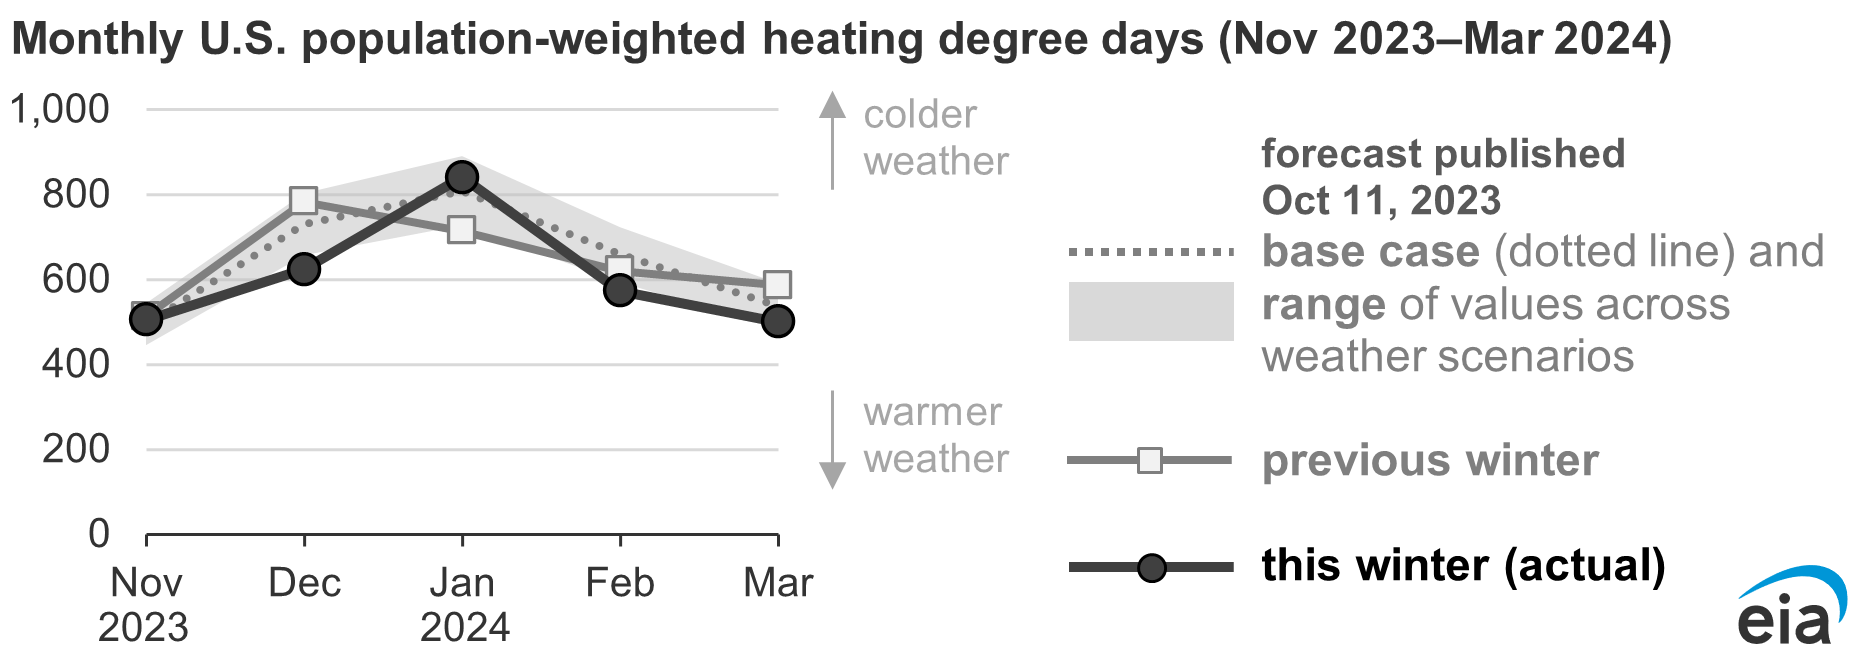
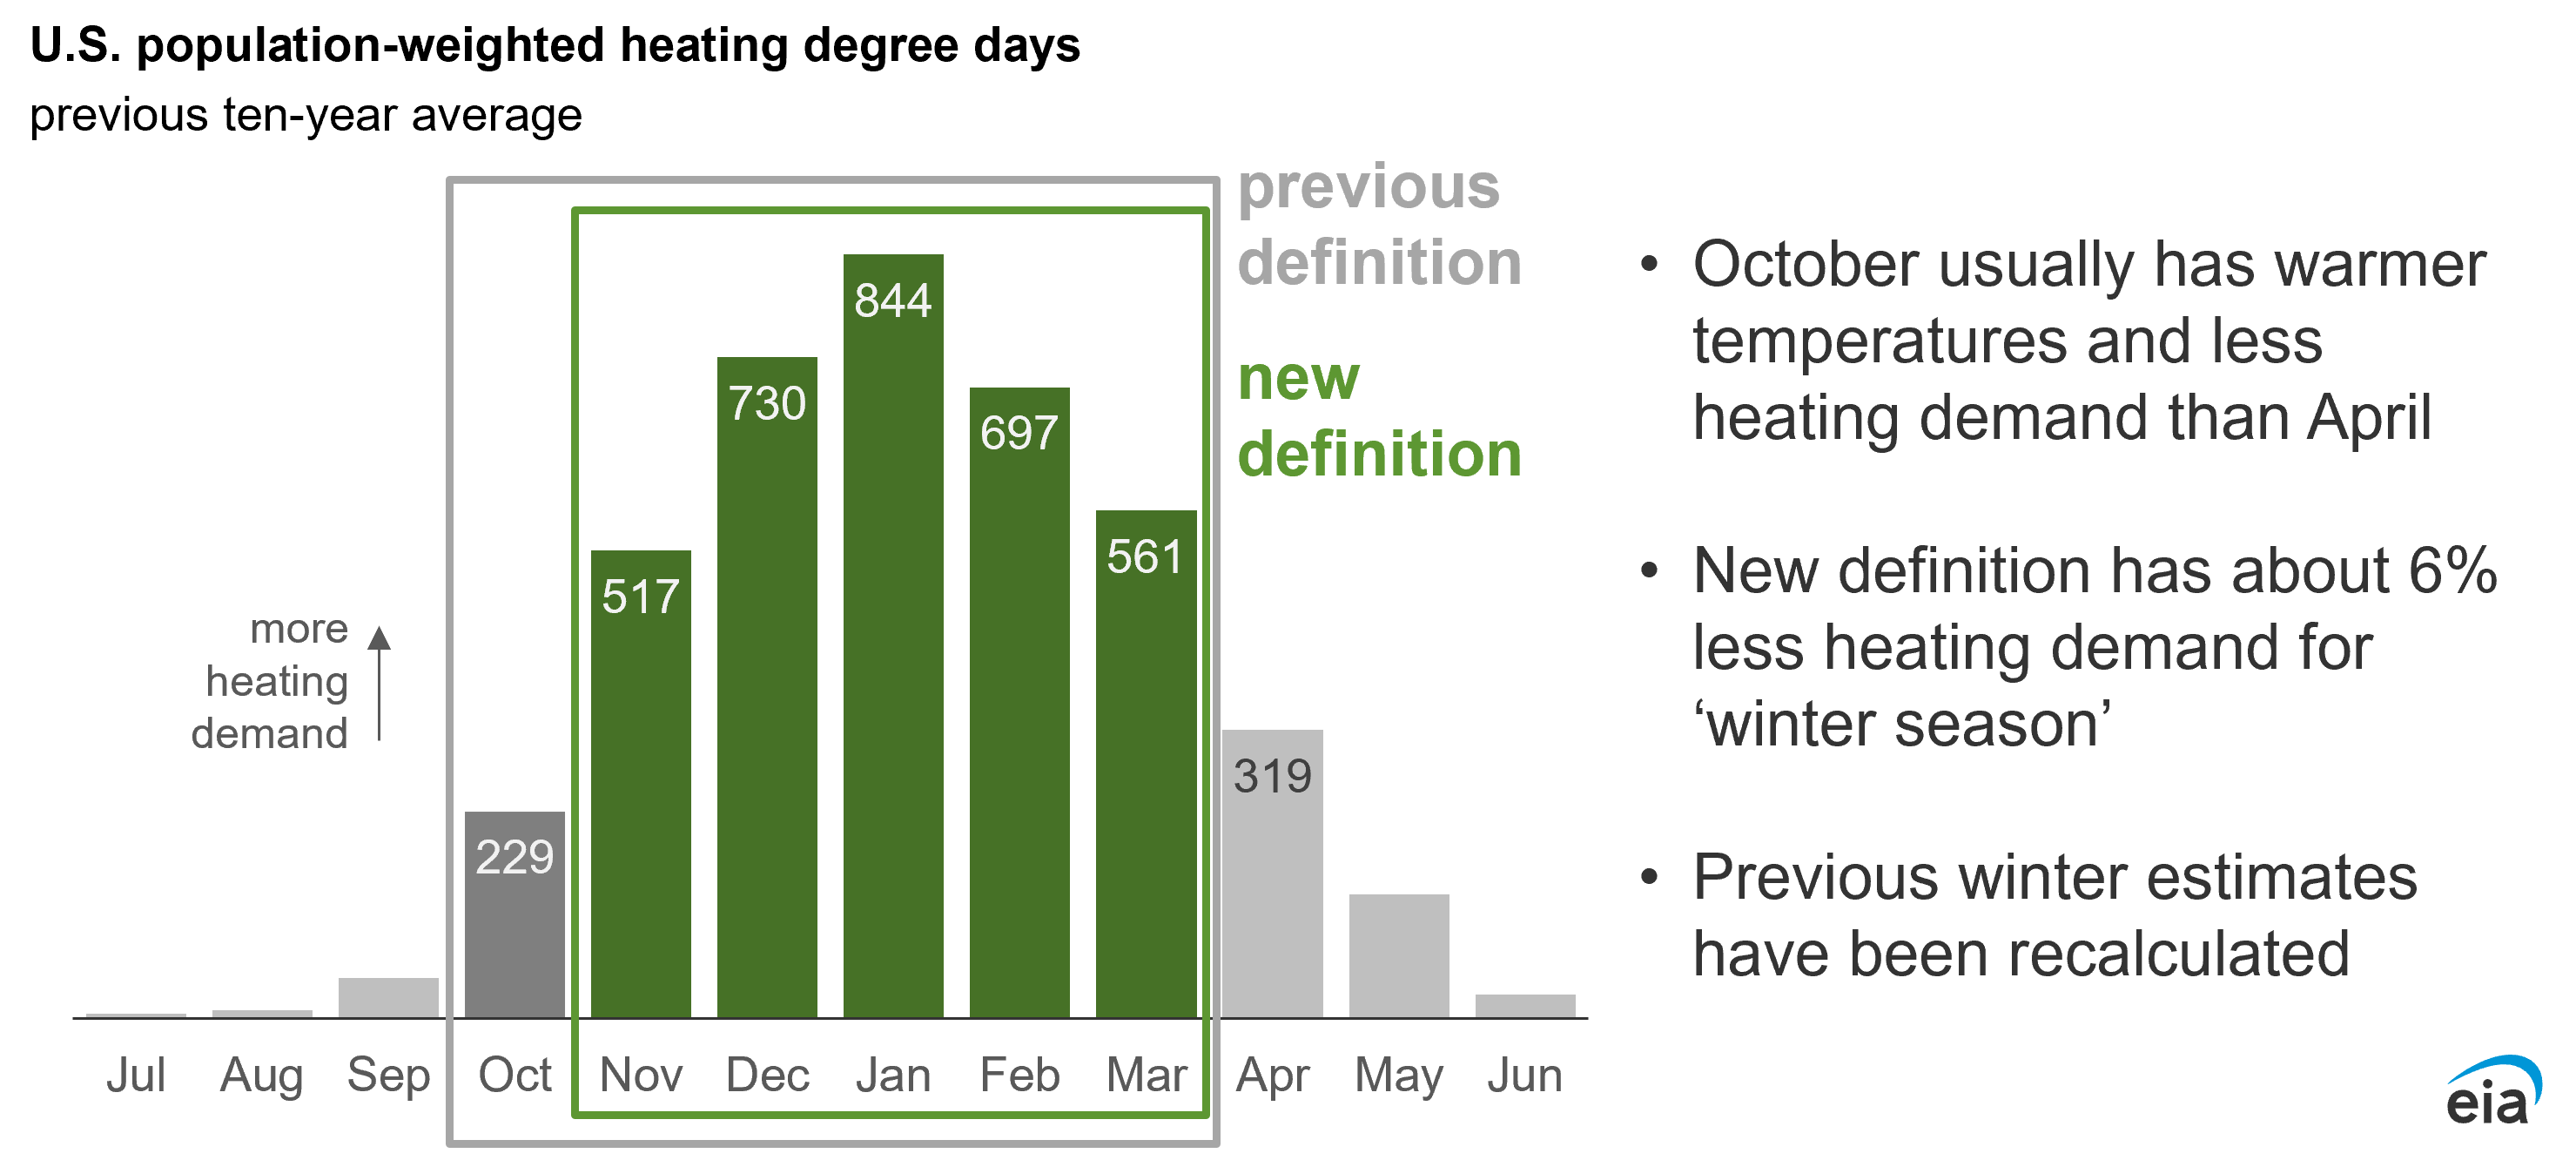
Weather assumptions in the WFO include a combination of data from the National Oceanic and Atmospheric Administration (NOAA) and the previous 30-year trend. We use heating degree days (HDDs) as a measure of how cold temperatures are compared with a base temperature—more HDDs indicate colder temperatures.
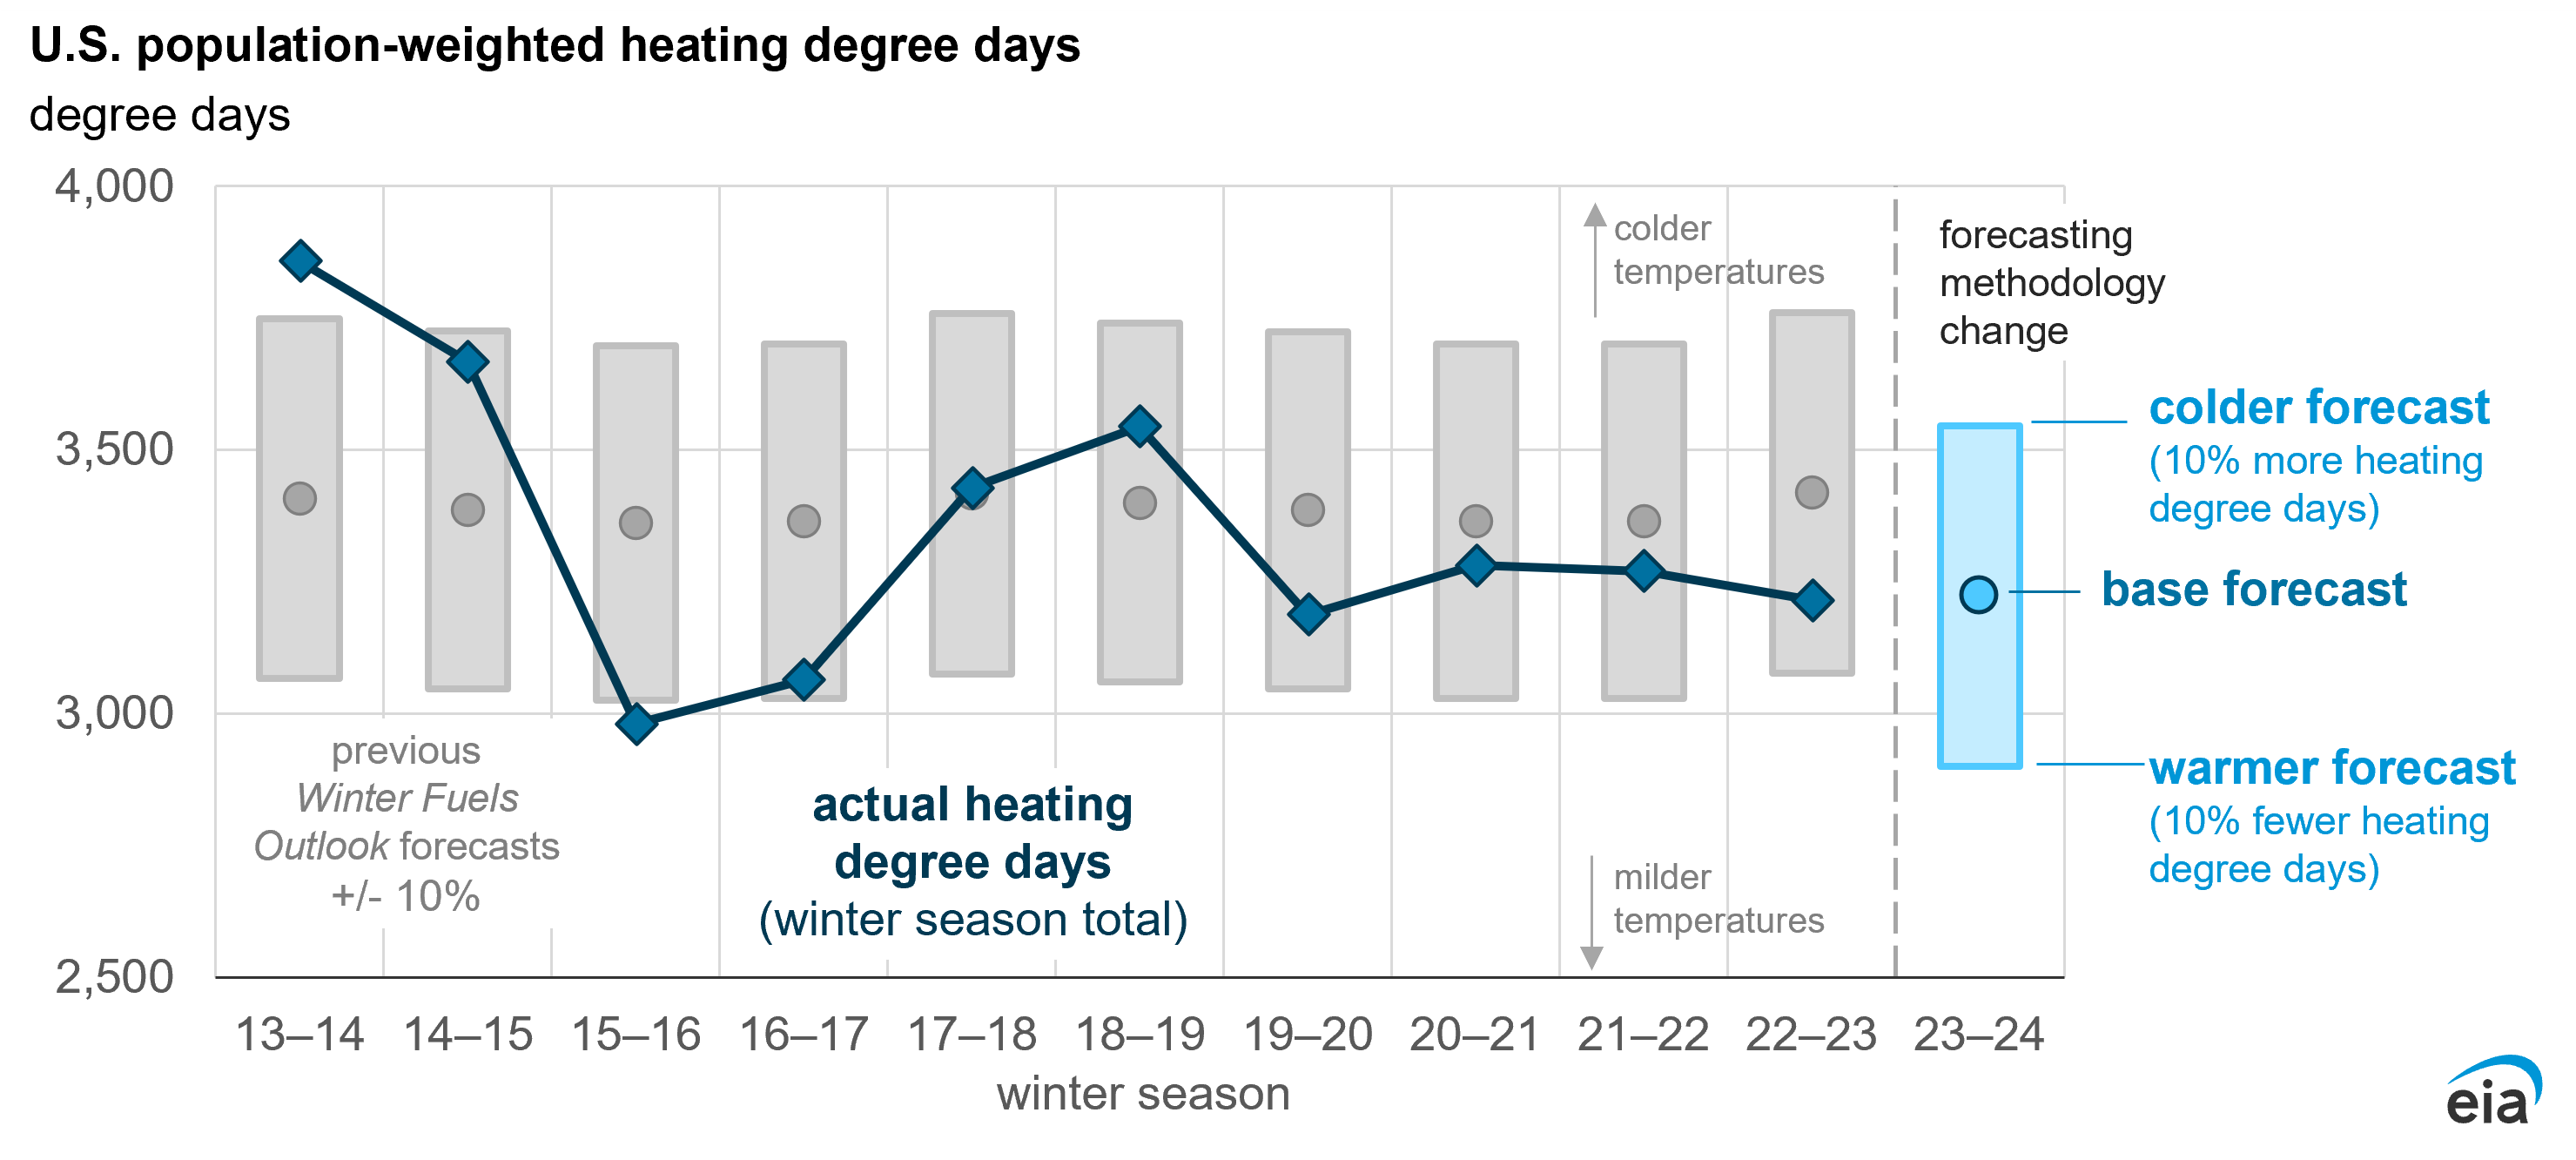
We assume temperatures for the winter of 2023–24 in the eastern part of the country will be slightly colder than last winter but warmer than the average of the previous 10 winters. However, in the West, our forecast assumes that this winter will be warmer than last winter, which was very cold, and warmer than the average of the previous 10 winters.
Beginning in this year’s WFO, we are defining winter to run from November through March. In previous years, we had considered winter to also include October. However, October only accounted for 6% of winter heating demand over the past 10 years. The previous winters referenced in this report have been recalculated to exclude October data.
Data values: U.S. Regional Weather Data
We expect this winter will have 4% fewer HDDs in the United States compared with the 10-year average, with some variation occurring between the different regions. We expect the West to be warmer than last winter with 18% fewer HDDs, while the South to be cooler with 11% more HDDs. We assume a colder winter in the Northeast with 7% more HDDs than last winter, and in the Midwest with 3% more.
Because weather is a significant source of uncertainty in these forecasts, the WFO includes side cases where, measured in HDDs, all regions are 10% colder or 10% warmer than the base forecast.
Data values: U.S. Regional Weather Data
Cold weather can affect household heating expenses in two ways. First, cold weather raises the amount of energy required to keep a house at a specific temperature. Second, because cold weather raises demand and can disrupt supply, it can cause energy prices to rise. These price increases can be more severe if fuel inventories are low, as is currently the case with heating oil. In the cases we consider, we adjust for both effects.
Because our forecast uses a 30-year trend in HDDs for any months beyond the current month, it does not factor in the potential for annual climate variations like, El Niño. Current indications show a high probability that the El Niño climate pattern in the Pacific Ocean will affect weather in the United States this winter. Although the effects of each El Niño event are different, NOAA notes that “El Niño in general acts to tilt the odds toward wetter- and cooler-than-average conditions across much of the South, and toward drier and warmer conditions in many of the northern regions.”
| Nov | Dec | Jan | Feb | Mar | total | % change |
|
|---|---|---|---|---|---|---|---|
| Northeast | 642 | 929 | 1,084 | 926 | 805 | 4,386 | +7% |
| Midwest | 743 | 1,087 | 1,239 | 1,020 | 825 | 4,913 | +3% |
| South | 306 | 495 | 563 | 425 | 308 | 2,098 | +11% |
| West | 463 | 663 | 645 | 538 | 474 | 2,783 | -18% |
| United States | 489 | 729 | 809 | 658 | 537 | 3,223 | +0% |
Note: Percentage change value is relative to previous winter.
Wholesale market conditions and prices
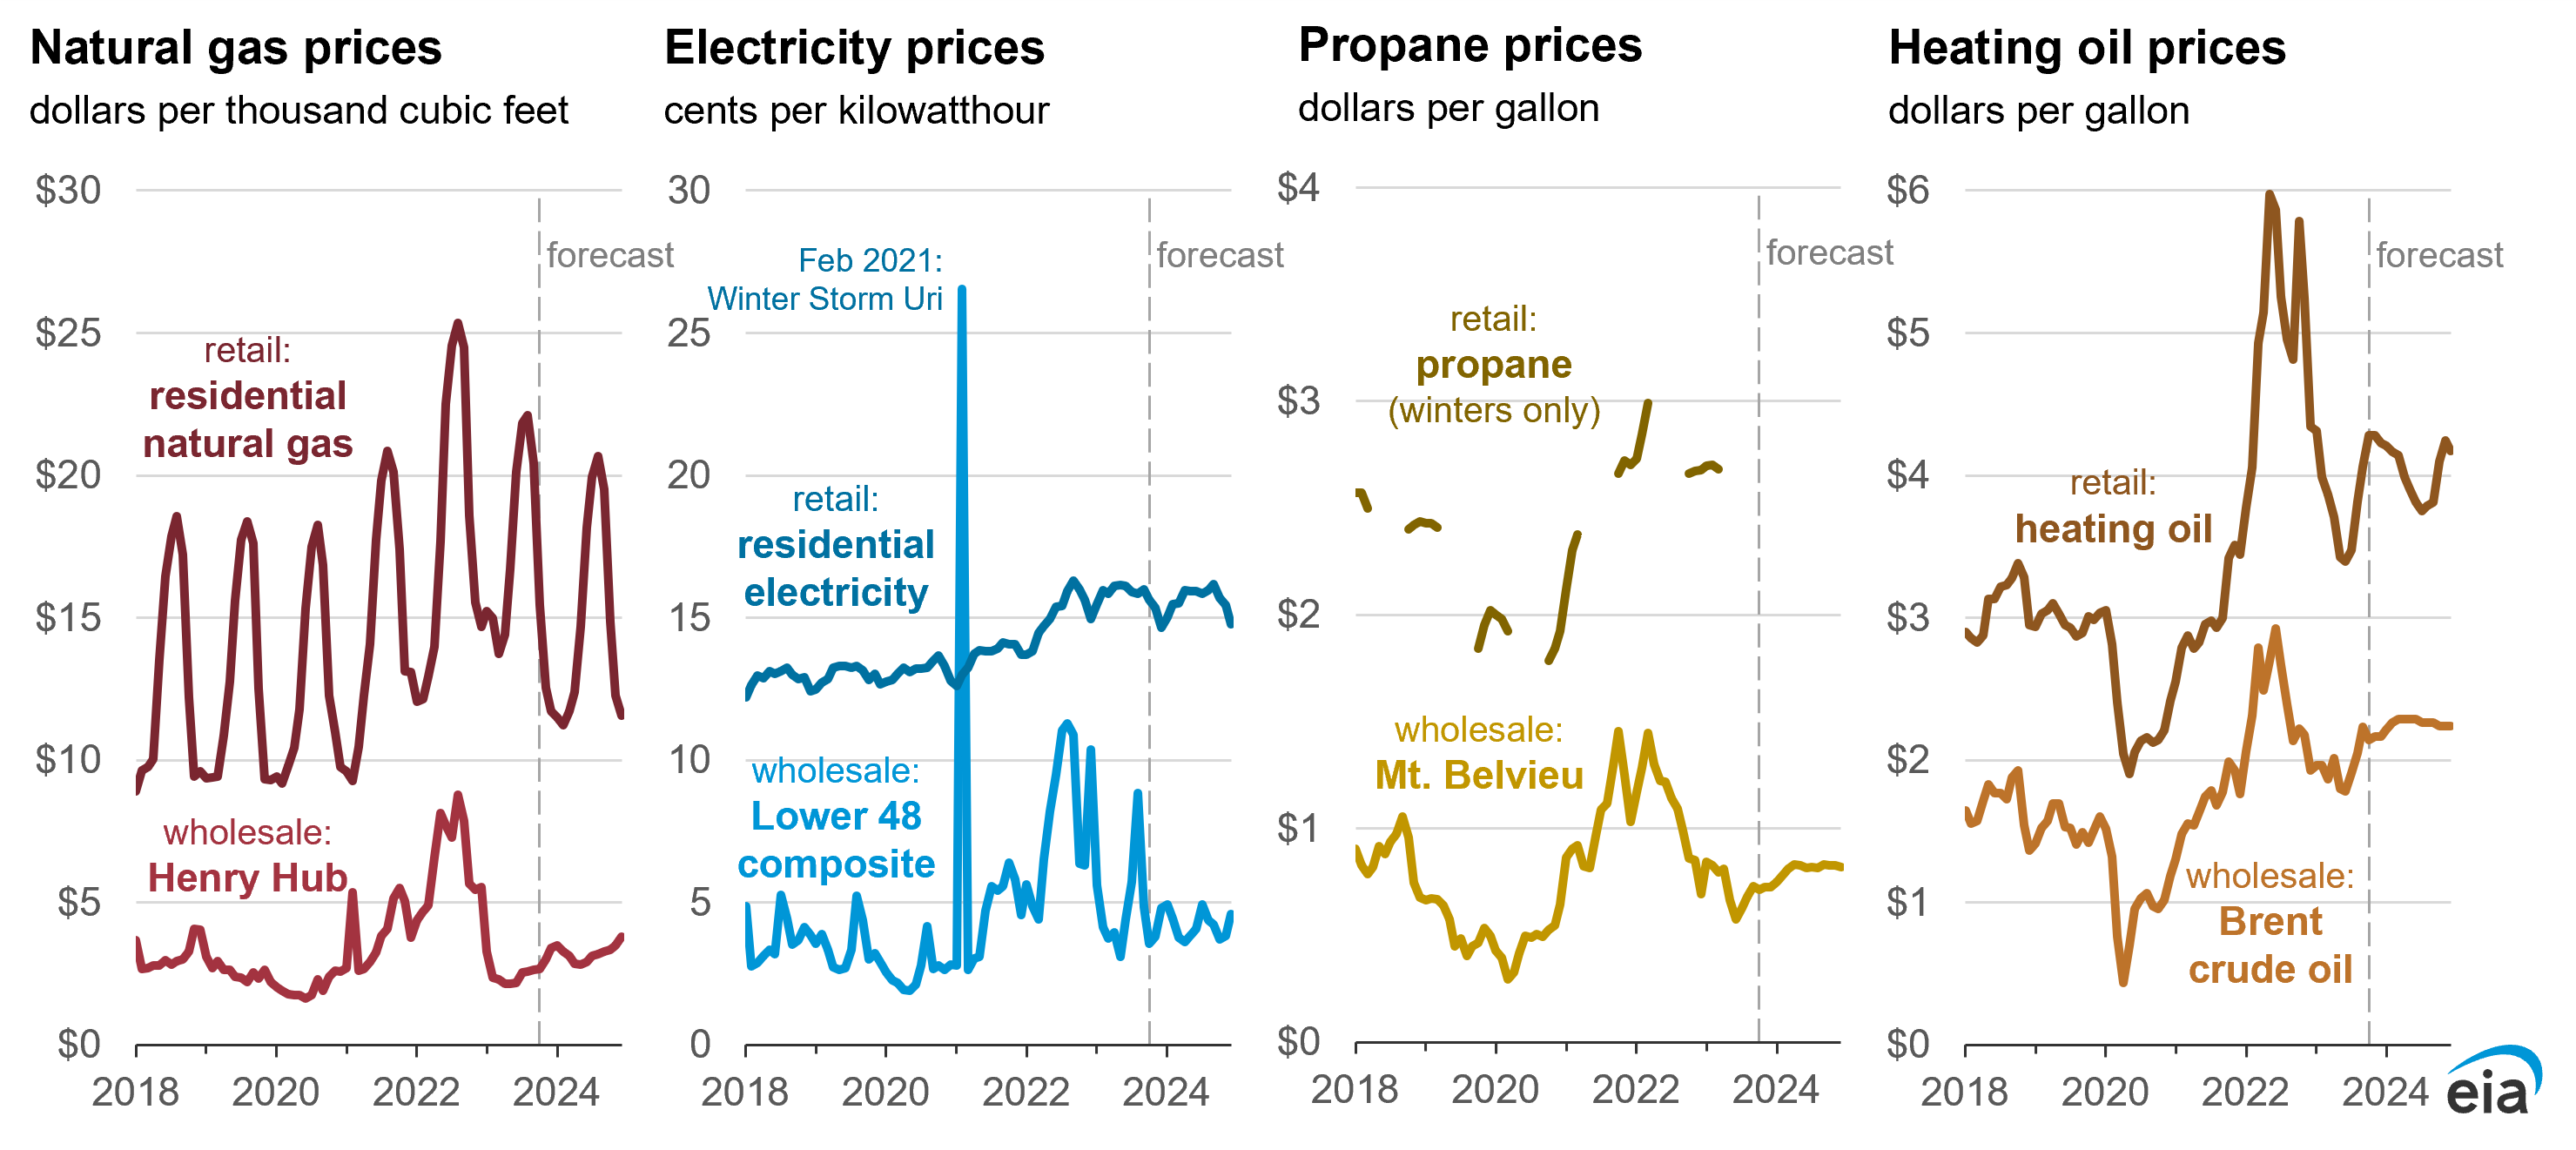
In general, we expect the prices U.S. residential consumers pay for fuels will be lower this winter than last winter. The lower prices are most notable for natural gas. Retail natural gas prices have been falling on a year-over-year basis since May, the result of a steep drop in natural gas wholesale spot prices. The wholesale spot price for natural gas at Henry Hub in Louisiana averaged $2.74 per thousand cubic feet (Mcf) in September, 66% less than September 2022 and among the lowest on an inflation-adjusted basis in the past 20 years. The average U.S. residential natural gas price in September was down 17% from a year ago.
Natural gas wholesale spot prices have fallen as natural gas inventories have risen above the five-year average in early 2023 and have stayed above average this year, supported by growth in U.S. natural gas production. U.S. natural gas production grew despite the decline in natural gas prices because of natural gas production increases associated with expanding crude oil production in the Permian Basin, which is not sensitive to natural gas prices. Although U.S. natural gas inventories remain above the five-year average, the surplus has been narrowing over the summer because of strong demand for natural gas in the electric power sector and rising U.S. liquefied natural gas (LNG) exports.
We also forecast that retail prices for heating oil and propane will be lower this winter than last. Although the crude oil prices affecting heating oil and propane retail prices are similar to crude oil prices a year ago, the prices for wholesale heating oil and propane have fallen.
Propane prices have decreased because of rising natural gas production. Propane can be produced by either a natural gas processing plant or by a petroleum refinery. With more propane production coming from natural gas processing plants in recent years, growth in natural gas production in 2023 has led to record propane inventories, putting downward pressure on propane prices.
Heating oil prices have decreased because of lower refining margins for distillate fuel, which includes heating oil and diesel. Several factors have contributed to the lower margins, including falling demand for U.S. distillate fuel, expanded U.S. and global refinery capacity, and the normalization of the distillate supply chain that was severely disrupted after Russia’s full-scale invasion of Ukraine in 2022. Despite lower refining margins compared with last year, distillate inventories remain low, and margins remain well above the five-year average. Although Russia has relaxed its recent ban of distillate exports, those exports are still partially restricted. This restriction has added uncertainty for U.S. heating oil prices heading into winter.
While the dynamics of the propane and heating oil markets are putting downward pressure on prices for these fuels, their prices also reflect the price of crude oil. We expect the Brent crude oil spot price will remain above $90 per barrel (b) range this winter. Crude oil prices rose above $90/b in recent months primarily because Saudi Arabia continued voluntary crude oil production cuts, reducing global oil inventories. We forecast that inventory draws will continue through the first quarter of 2024, as OPEC+ oil production cuts keep global oil production lower than global oil demand.
Data values: Real Prices Viewer
Wholesale market conditions affect fuels differently. Changes in retail natural gas prices lag changes in wholesale natural gas prices, largely due to the nature of utility regulation, though the impacts can vary significantly by state and even by utility within a state. Over longer periods, changes in natural gas wholesale and retail prices are closely correlated. Some state utility commissions set the rates utilities can charge for natural gas deliveries a year or more in advance of billing to reflect the cost of wholesale natural gas that utilities purchased over many months.
The timing and frequency of rate changes can vary by utility, however in times of high price volatility, some utilities make adjustments as often as several times in a year. In addition, residential prices include charges to cover utility operating costs and the cost to transport and distribute natural gas, which are not directly linked to wholesale commodity natural gas prices.
The prices residential consumers pay for electricity lags change in wholesale spot prices in a way that is similar to natural gas. Electricity prices charged to ultimate customers reflect the costs of supplying the electricity and delivering it to households. Increases in costs pass through to customers more quickly in areas of the country with deregulated markets where consumers have a choice of electricity providers. Wholesale electricity prices in the third quarter of 2023 decreased across most of the United States compared with the same period in 2022 but increased in Texas because of very hot temperatures.
The decline in wholesale prices over the past quarter largely reflects the lower cost generators paid for natural gas this year and the effect of more renewable resources on the grid with very low dispatch costs. We expect U.S. average retail electricity prices will be slightly lower than last year as wholesale changes slowly pass through to retail rates.
Wholesale price changes for heating oil and propane are passed to consumers quickly because rates in those markets are not regulated as they are for natural gas and electricity. We generally estimate that changes in wholesale fuel prices become fully reflected in retail prices over a period of four-to-six weeks.
Many heating oil and propane users buy supplies ahead of the winter and refill as needed. When forecasting expenditures, our calculations do not account for fuel that consumers purchase ahead of its use or fuel that was contracted at prices set before the start of the winter. We assume households pay the prevailing retail price for heating oil and propane at the time they use it.
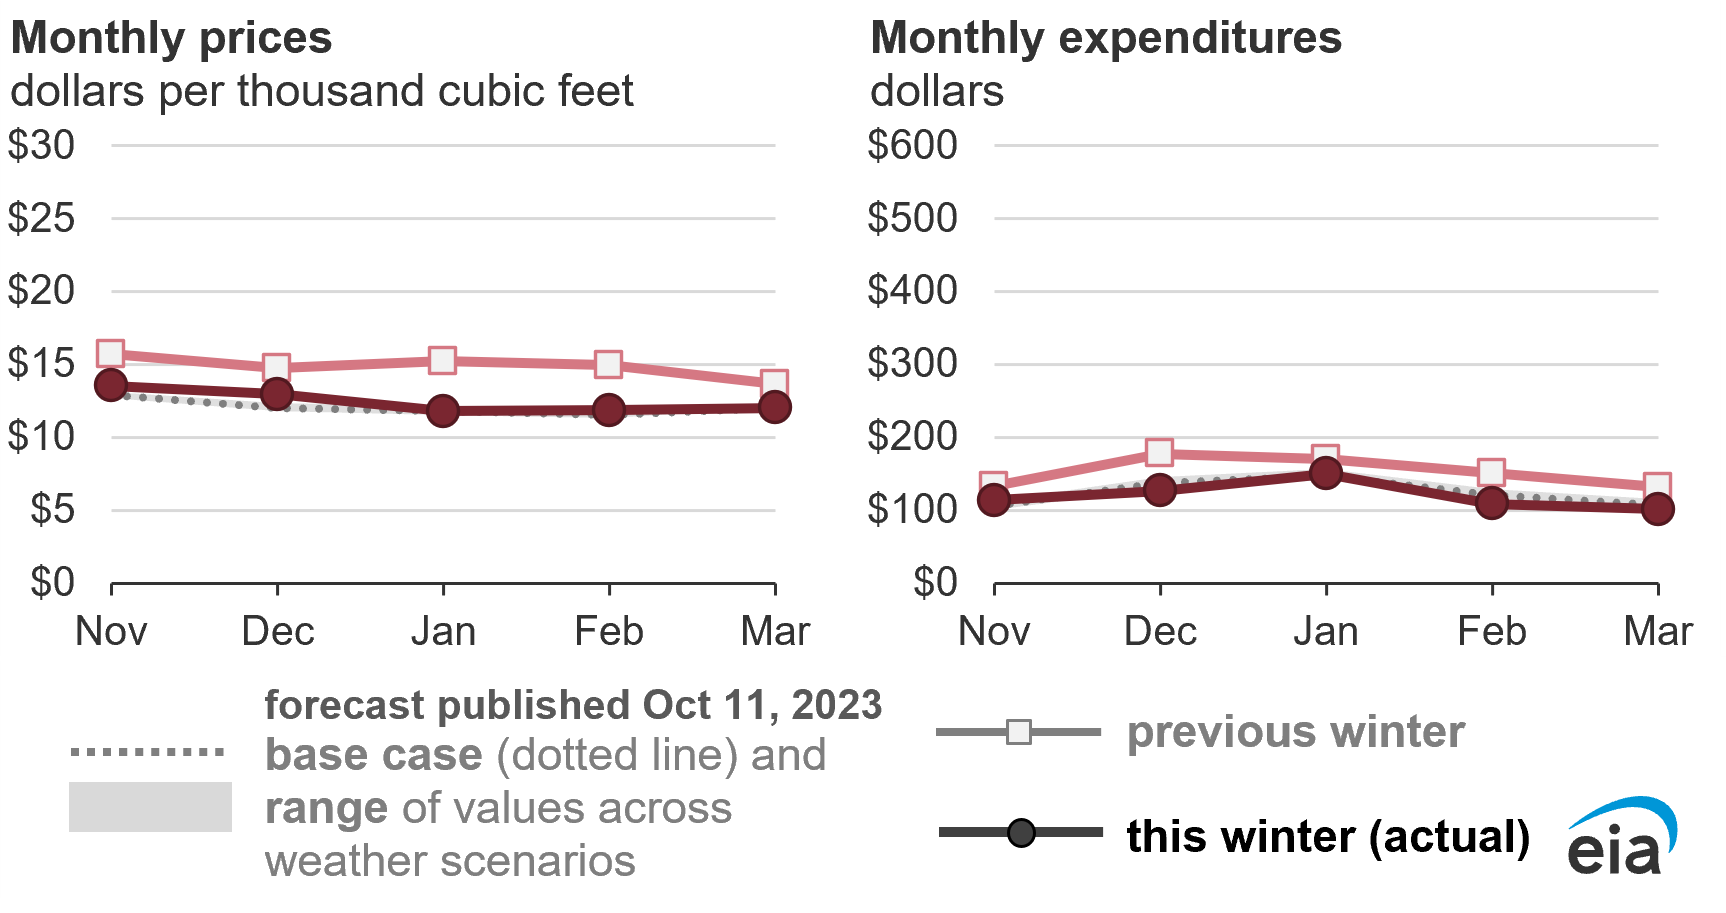
Natural gas
This winter we expect a decrease in spending on natural gas in all cases compared with last winter, driven by a more than 20% decline in natural gas prices in the base case. Because we expect consumption to be about the same as last winter, we expect the lower price will drive a more than 20% ($160) decrease in expenditures.
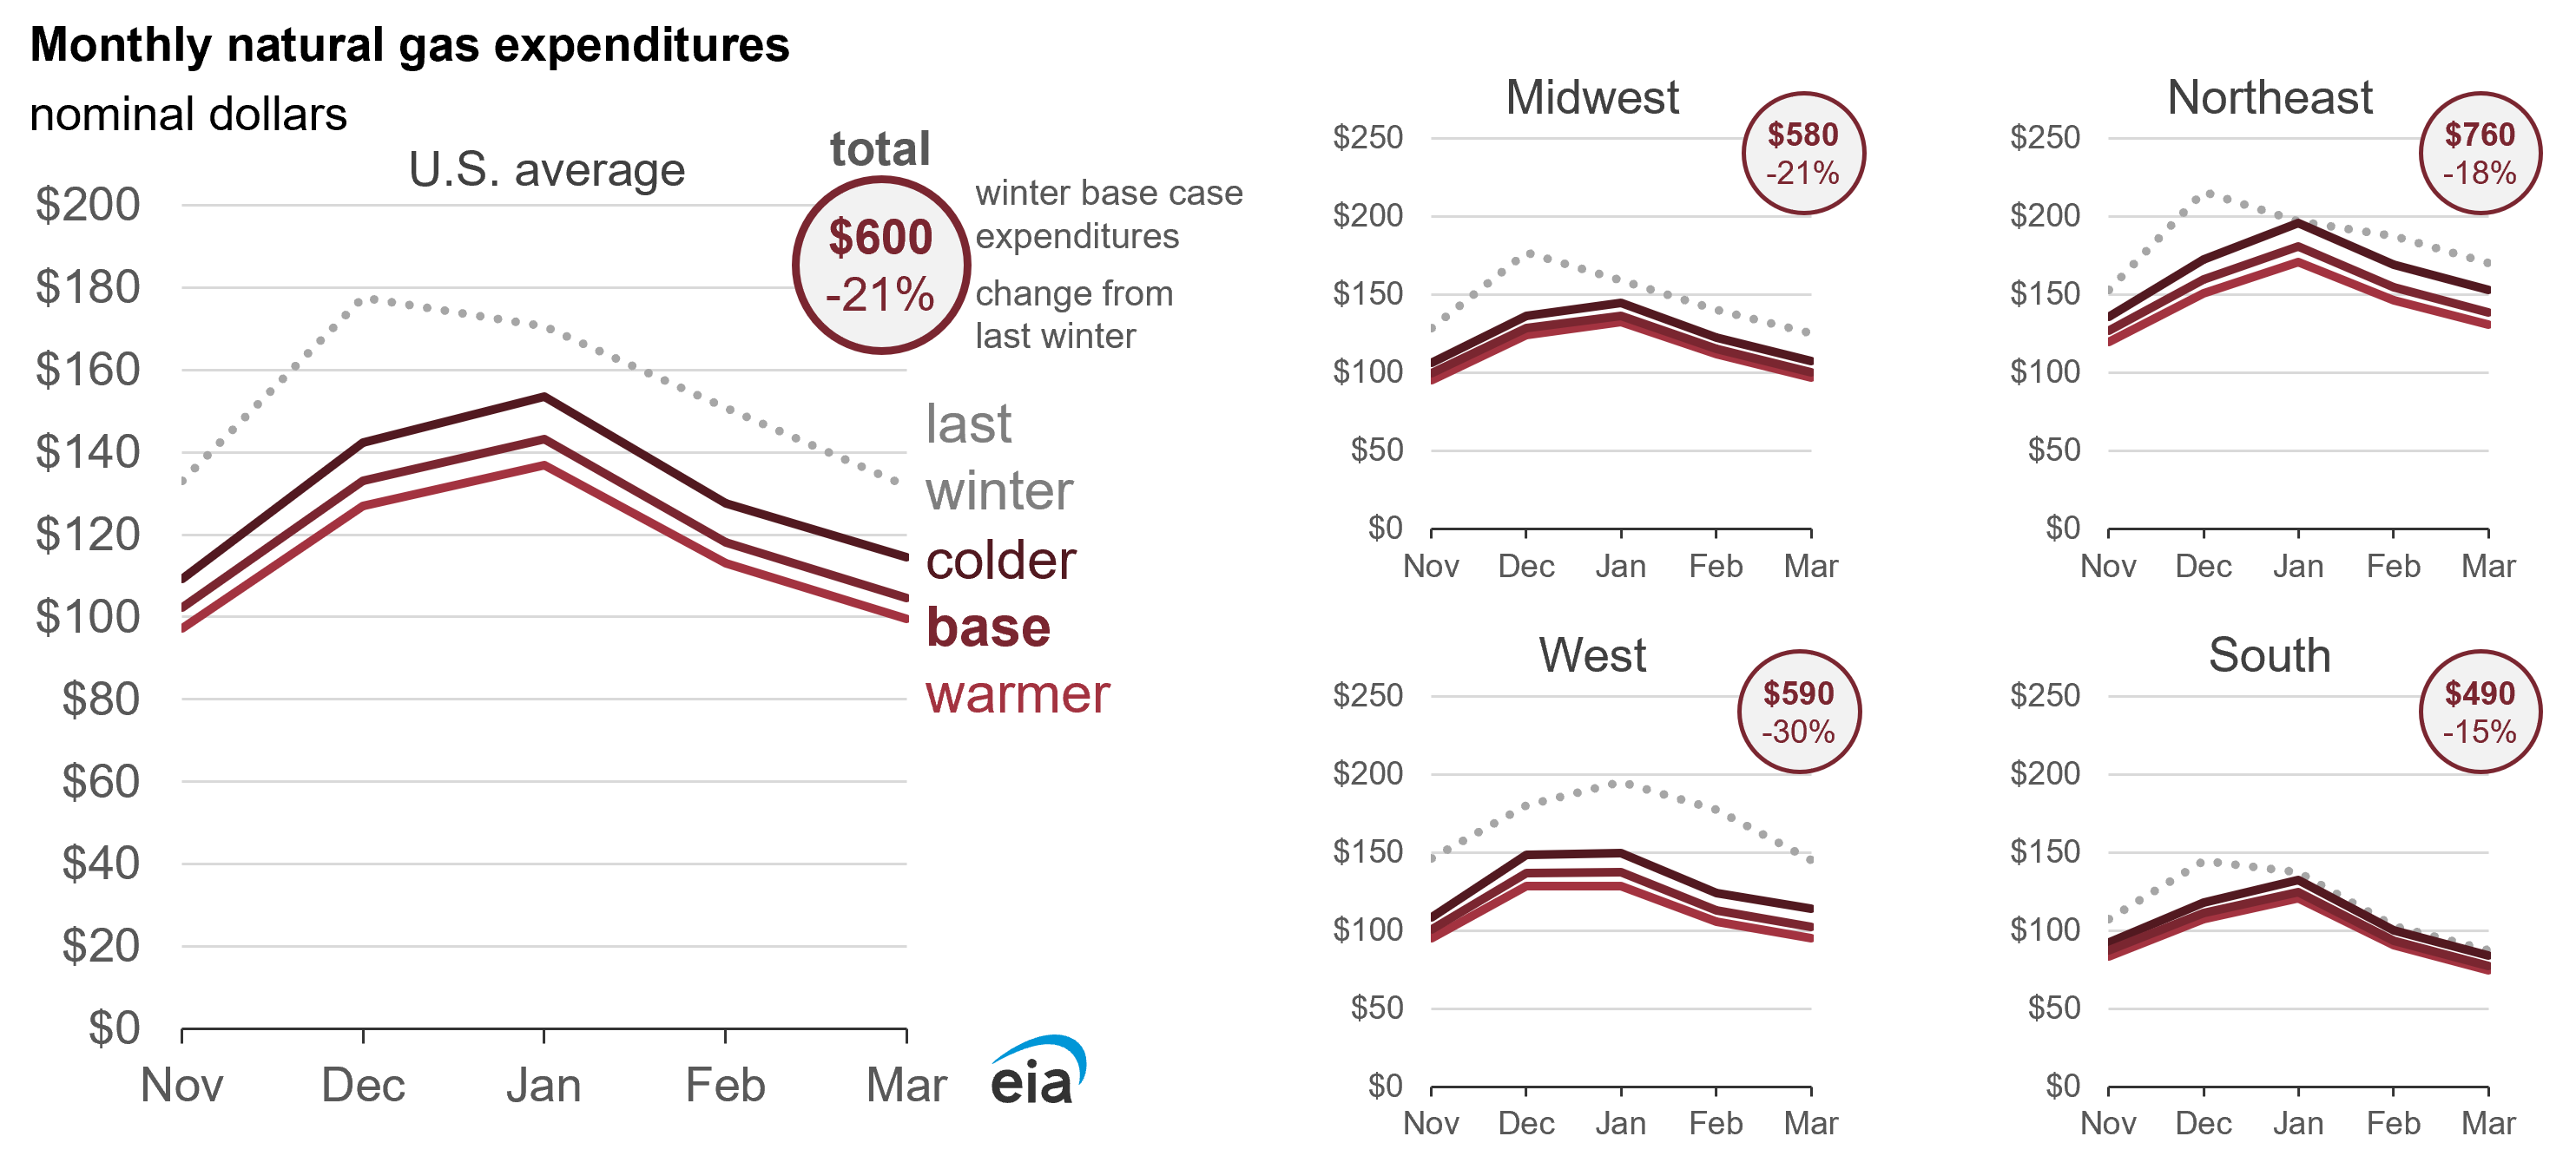
In the warmer scenario there is 7% (3 Mcf) less consumption compared with last winter. This scenario results in a 25% ($190) decrease in spending. In the colder scenario, we expect a 9% (4 Mcf) increase in consumption compared with last winter. This scenario still results in a 15% ($120) decline in spending.
Natural gas prices and spending decrease in all three cases and in every region in this year’s WFO compared with last winter. In the West, consumption decreases in every case, even the colder case, because our forecast includes more normal temperatures compared with the widespread below-normal temperatures last winter, which resulted in natural gas consumption that was 16% more than the average of the previous five winters. In contrast, consumption in the Northeast last winter was the lowest since the winter of 2015–16, similar to our forecast consumption in the warmer case.
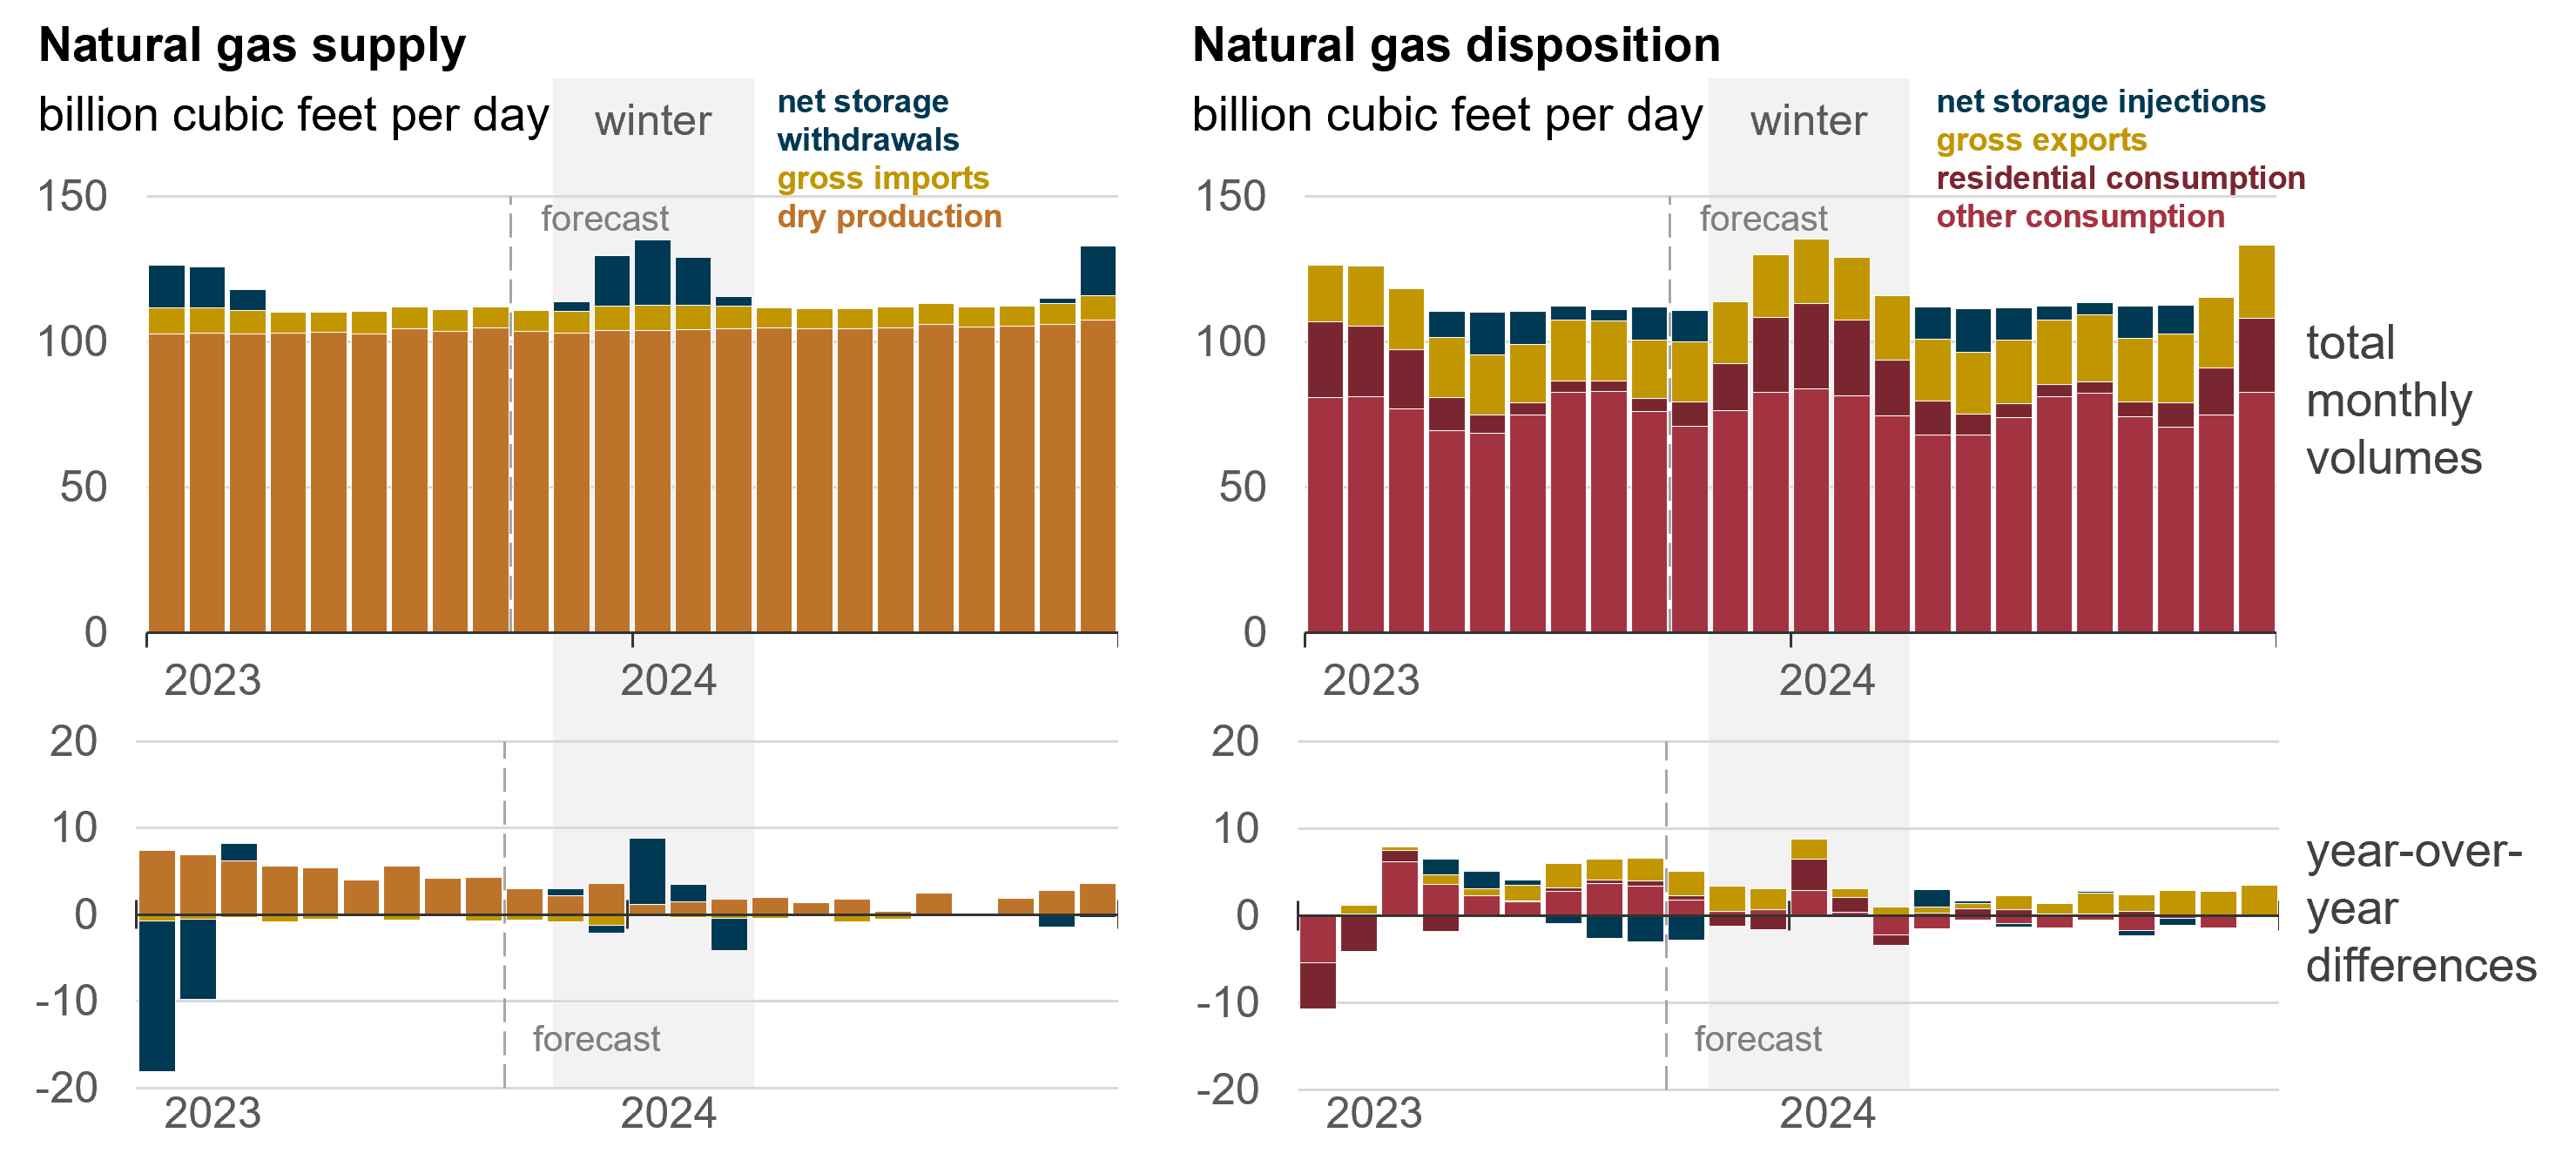
Data values: U.S. Natural Gas Supply, Consumption, and Inventories
Compared with a year ago, U.S. natural gas production growth this year has not kept pace with growth in LNG exports and record consumption in the electric power sector this summer, leading to lower-than-average storage injections in July, August, and September. Despite lower-than-average storage injections recently, natural gas inventories remain above the five-year average, and we expect natural gas supplies will be sufficient to meet winter demand in the base case.
We expect U.S. working natural gas inventories will be 3,854 Bcf at the end of October, which is 6% more than the five-year average (2018–2022) for this time of year. Inventories in all five regions of the country are above the five-year average heading into the winter heating season.
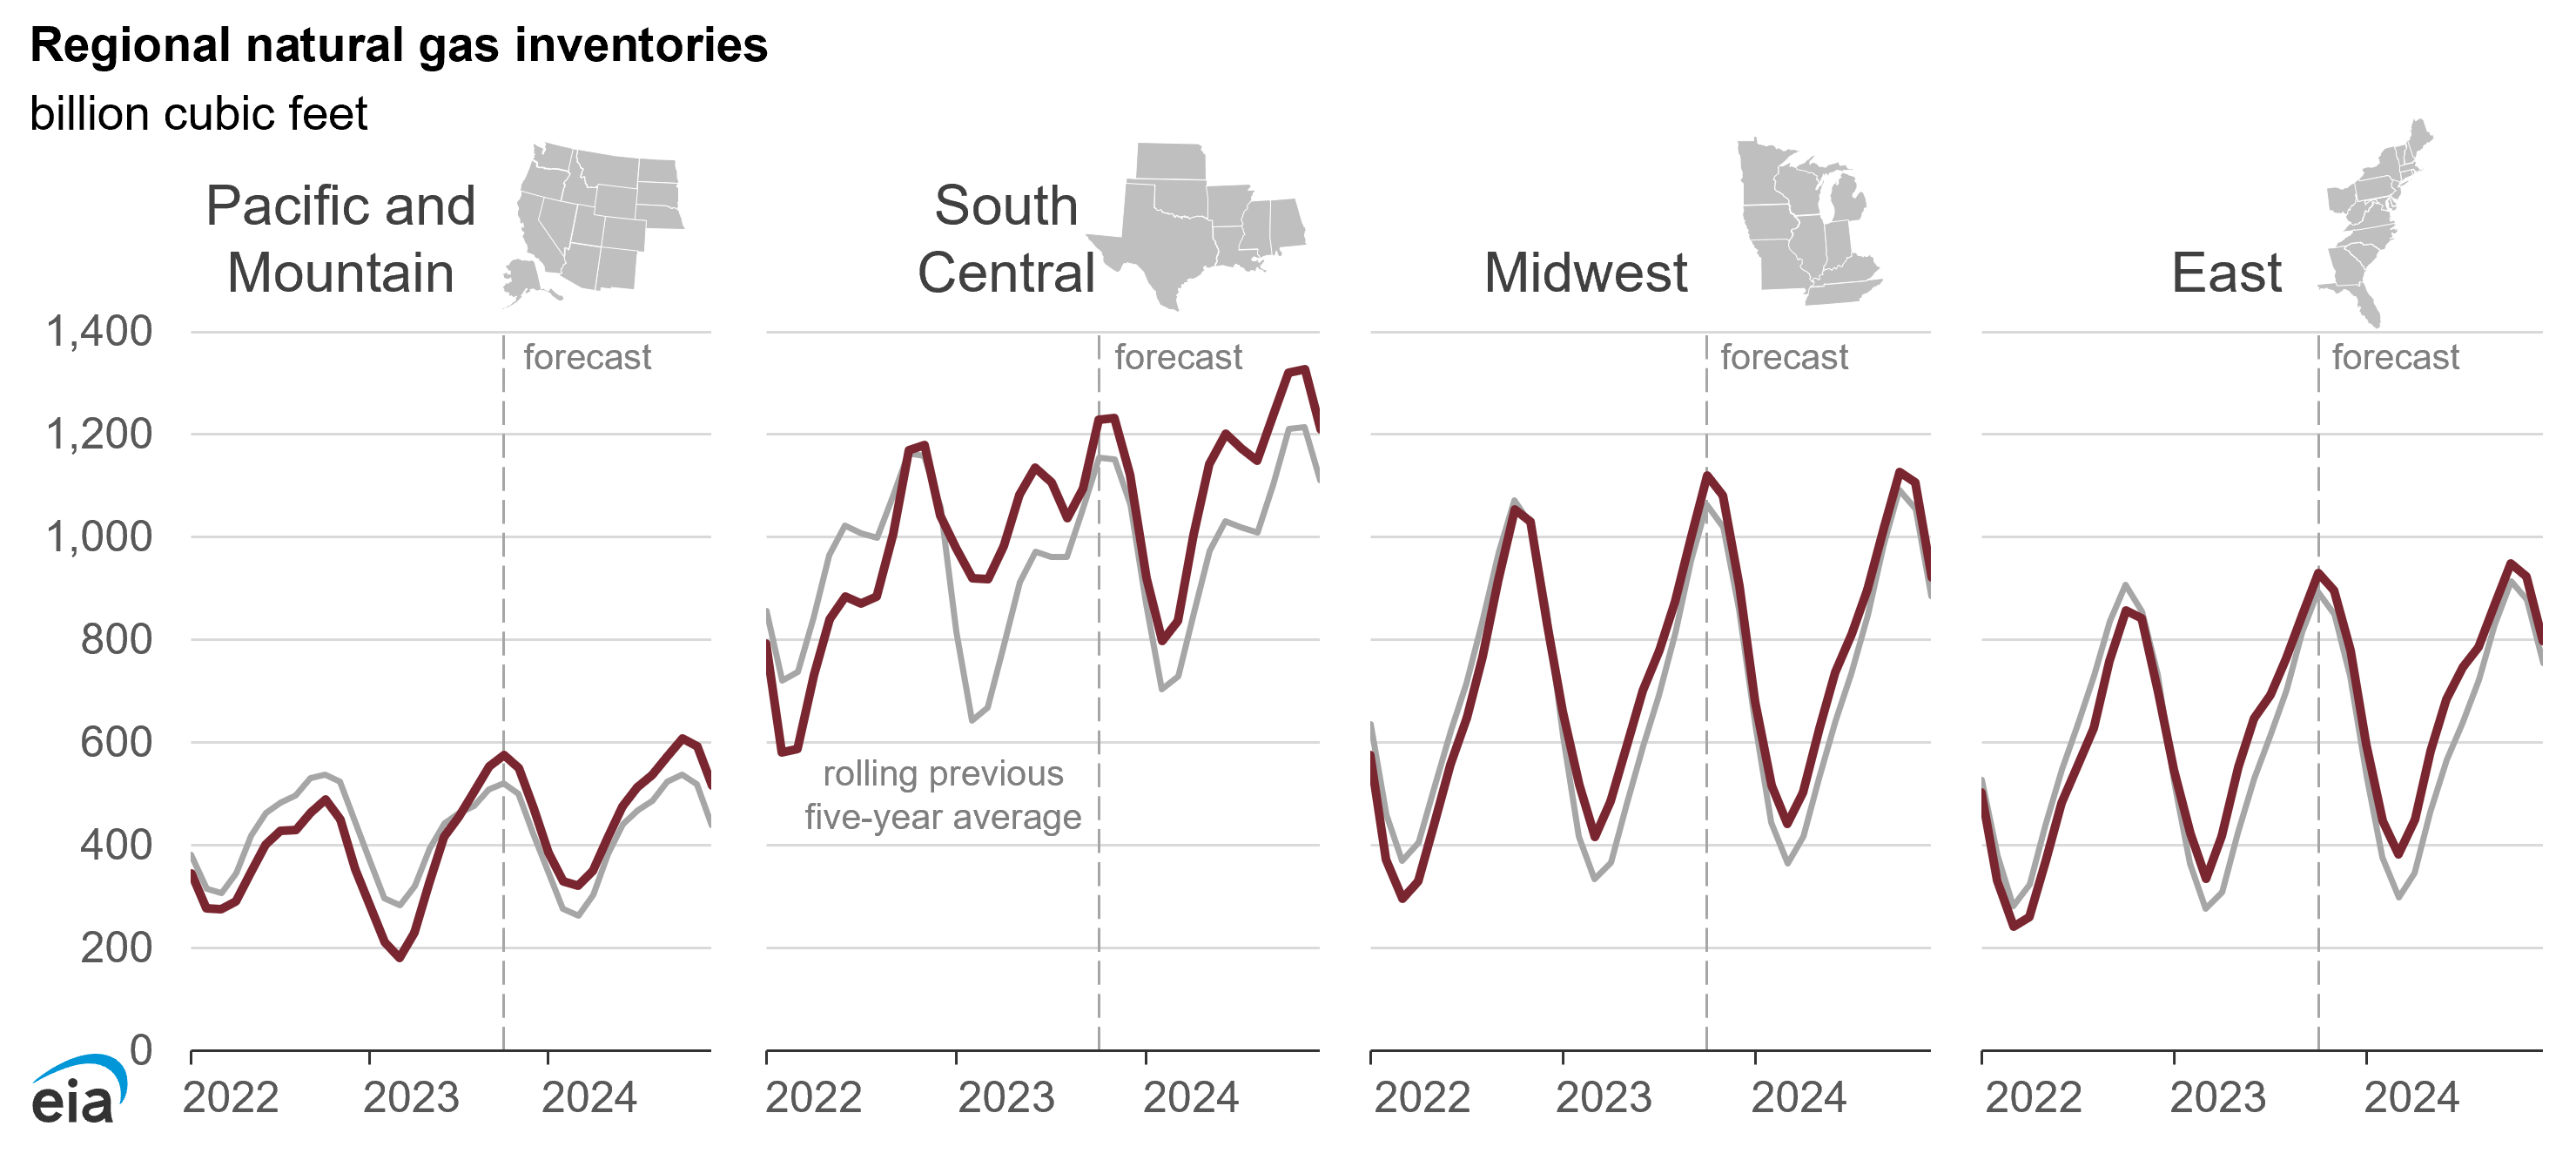
Data values: U.S. Natural Gas Supply, Consumption, and Inventories
This winter, we forecast higher temperatures in the western United States compared with last year, and lower temperatures in the eastern part of the country. In our base forecast, we expect colder weather in the East will increase natural gas consumption compared with last year, resulting in more natural gas withdrawals from storage. Inventories in the East, Midwest, and South Central regions will decline from the highs last winter, but they will remain above the five-year average.
We expect warmer weather in the West compared with last winter, decreasing natural gas consumption and reducing withdrawals of natural gas from storage. Operators in the West, in particular California, rapidly restocked their storage inventories this summer after storage levels fell to well below the five-year average at the end of last year’s winter heating season. In our base case, we expect inventories in the West to decline at a slower rate than last winter, ending the heating season close to the five-year average. The increase in storage capacity at the Aliso Canyon storage facility near Los Angeles should support inventory levels on the West Coast this winter.
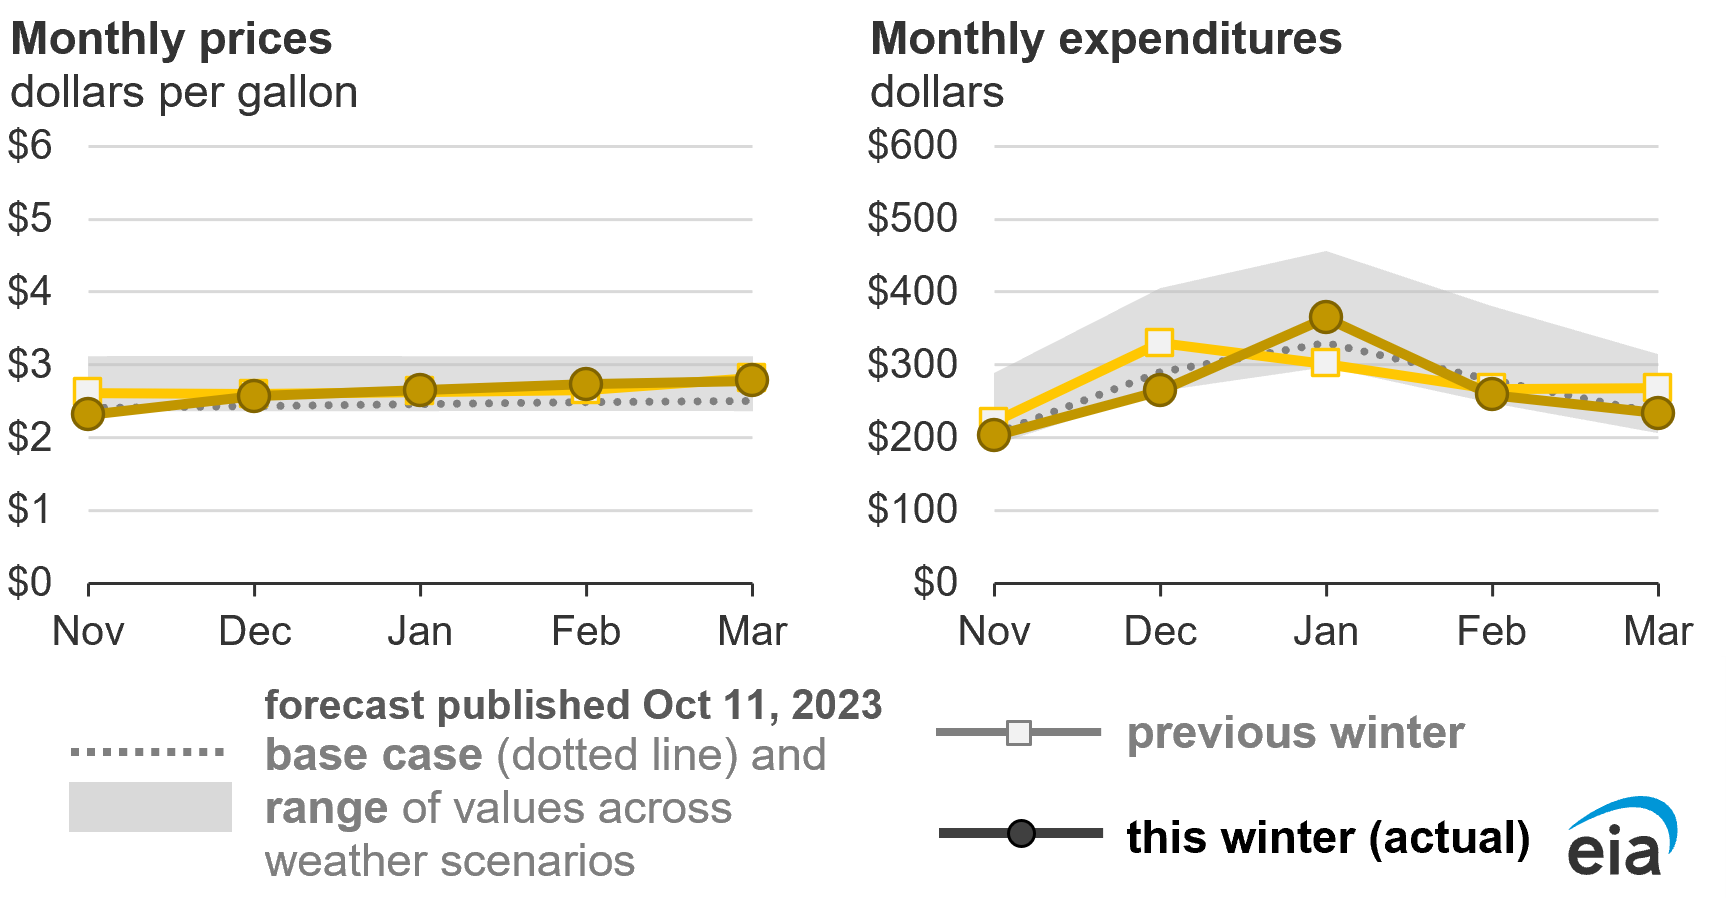
Propane
Propane is used as a winter heating fuel in 5% of U.S. households, mostly in rural areas in the Midwest, Northeast, and South. Propane is also used in commercial grain dryers and in industry as a petrochemical feedstock. We expect households heating with propane in the Northeast will spend an average of $1,700 per household, which is slightly higher than last winter. Our forecast increase in Northeast expenditures for propane-fueled heating is based on our forecast that the region’s propane prices will be 5% lower and there will be 6% more household propane consumption, on average.
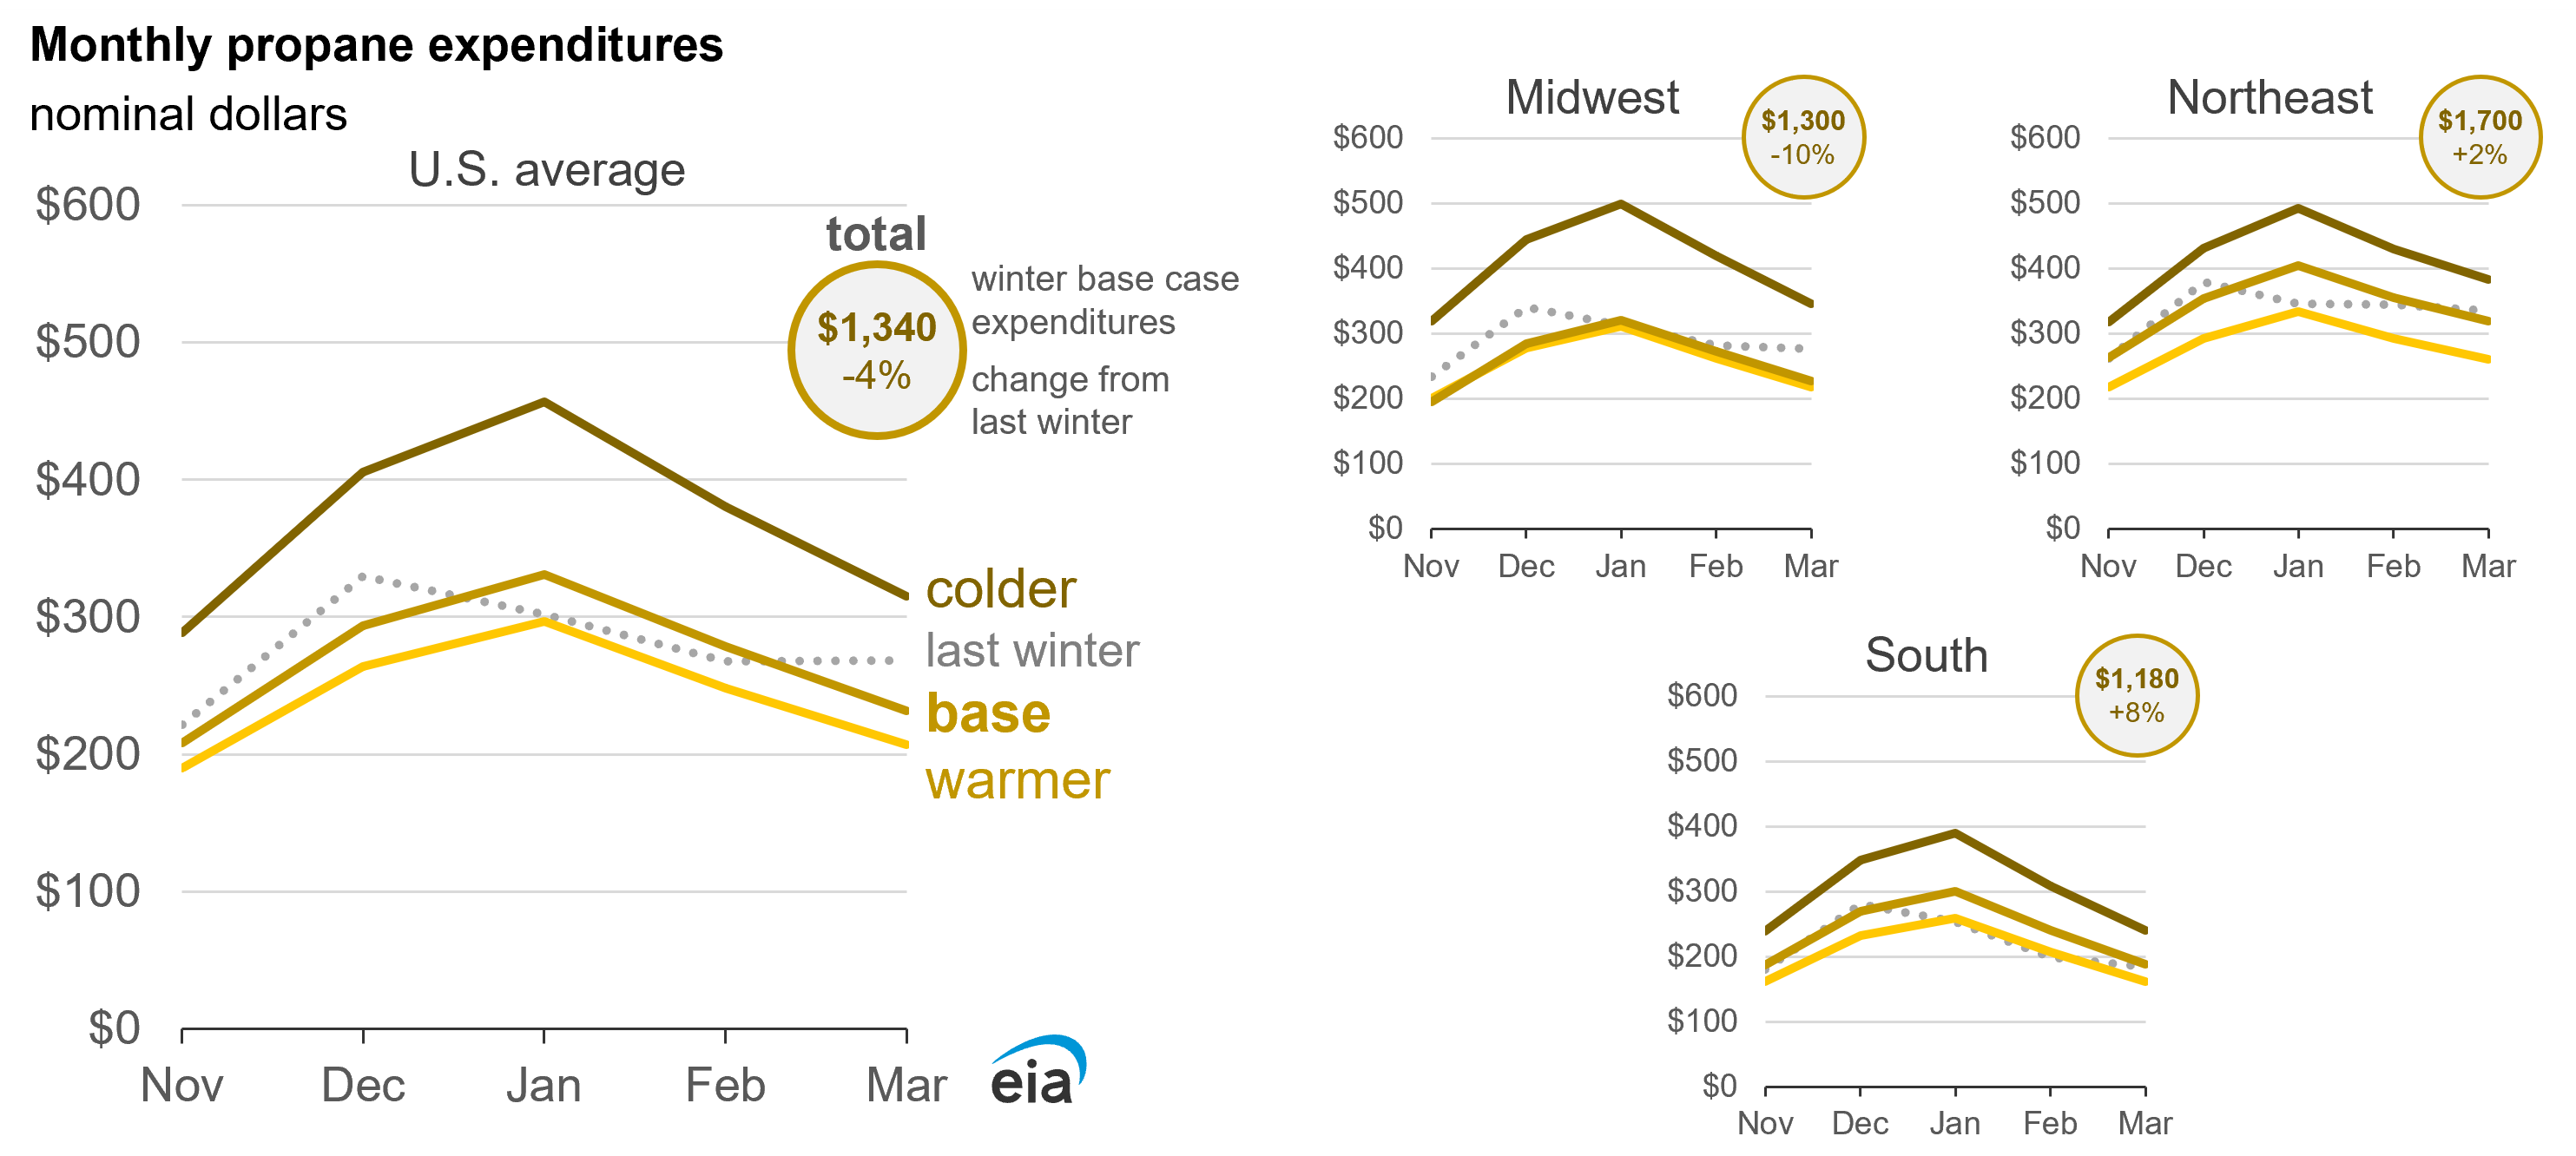
We expect households in the Midwest to spend about $1,300, 11% less than last winter, reflecting a forecast for a 13% drop in propane prices and slightly higher propane consumption. In the South, we expect households to spend about $1,180, 6% more than last winter, reflecting a 9% increase in consumption and a 3% decline in propane prices.
Weather will be a key determinant of propane market outcomes and consumer expenditures this winter. If the winter is 10% colder, measured in HDDs, we expect significant upward pressure on wholesale propane prices that would quickly be passed along to the consumer. In the colder scenario, we forecast that household expenditures for propane will be more than 20% higher than last winter in the Northeast and about 40% higher in the Midwest and in the South. In the warmer case, with 10% fewer HDDs, our forecast average U.S. expenditures will be down 13% compared with the winter of 2022–23.
Propane prices typically follow the price of crude oil and natural gas but can vary significantly depending on supply and demand conditions, particularly in response to winter weather. The propane spot price at the U.S. benchmark location of Mont Belvieu, Texas, was 73 cents per gallon (gal) in September, which is 8% less than the price in March (the end of the 2022–23 winter heating season). We forecast that the Mt. Belvieu spot price will average over 75 cents/gal throughout the winter, 5% lower than the previous winter.
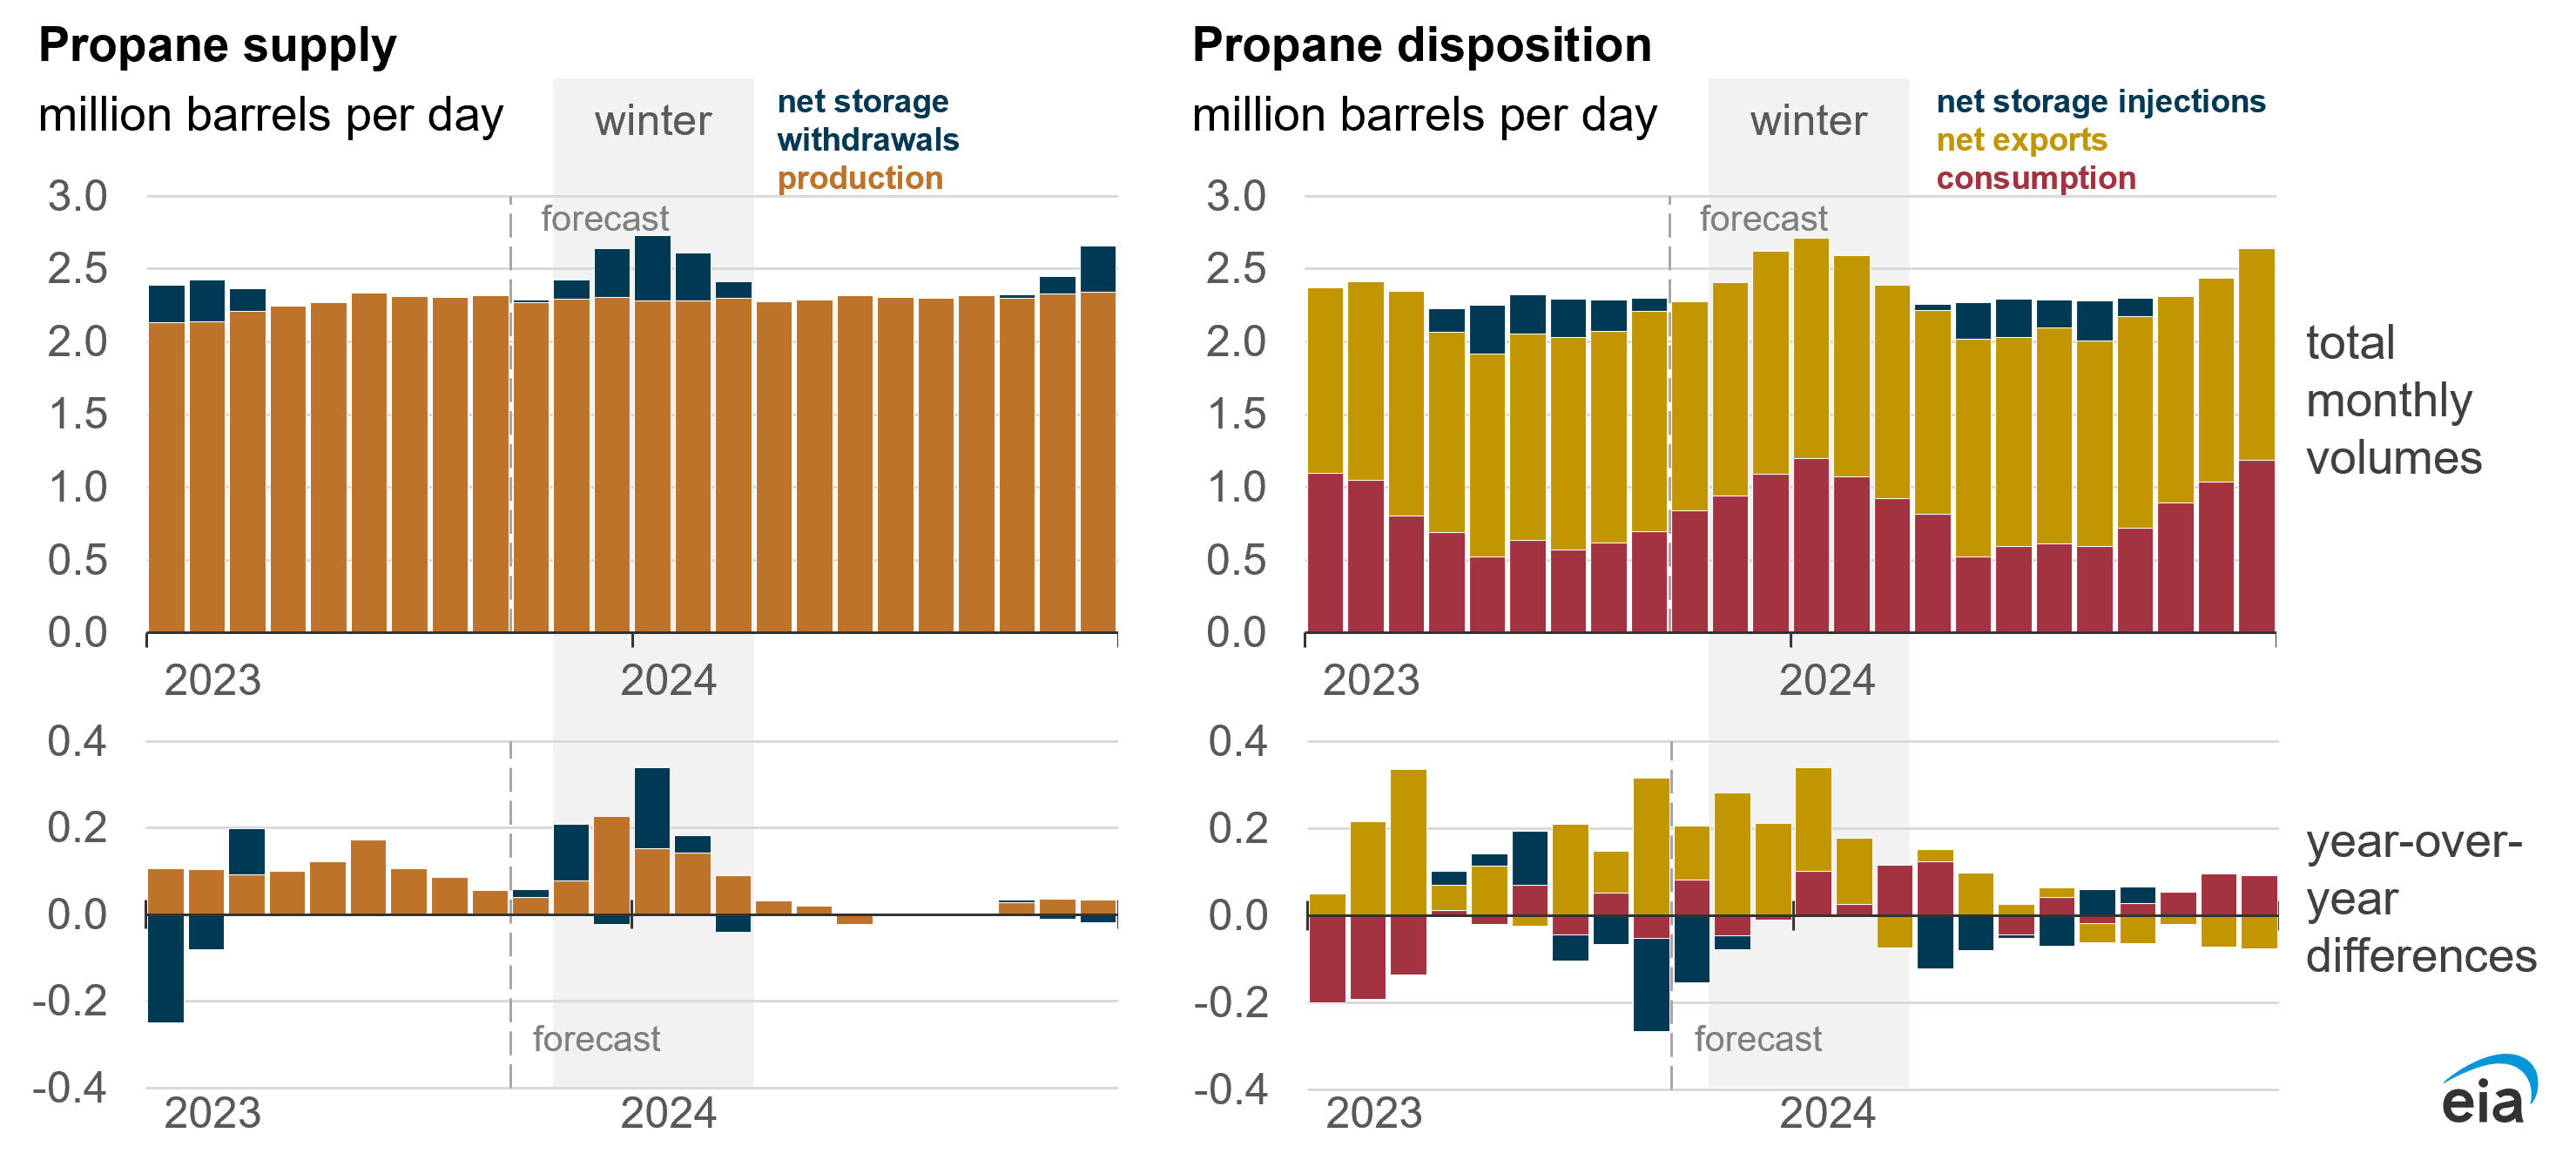
Data values: U.S. Hydrocarbon Gas Liquids (HGL) and Petroleum Refinery Balances
Note: This image was reposted on Friday, October 13 to correct the values in the year-over-year differences.
We forecast U.S. propane plant and refinery production to increase by about 6% this winter compared with last winter. We expect U.S. propane consumption across all sectors to be up about 4% this winter compared to last winter, because of increased propane use for space heating and for petrochemical production. While propane consumption in our forecast increases compared with last winter, it remains slightly lower than the 2017–22 winter average. Propane consumption last winter was the lowest in more than a decade. From October to November, propane is consumed in commercial grain dryers when the corn harvest takes place. When the corn crop reaches maturity in late September or early October, producers can allow the crop to dry in the field, reducing the demand for propane for commercial grain drying.
The current harvest is ahead of schedule compared with the five-year average, with increasingly poor crop conditions, so we expect minimal grain drying demand for propane. The United States exports more propane than it consumes, and we forecast 12% more net exports of U.S. propane this winter than last winter. Higher propane exports reflect elevated global demand for propane as a petrochemical feedstock, especially in East Asia.
Data values: U.S. Hydrocarbon Gas Liquids (HGL) and Petroleum Refinery Balances
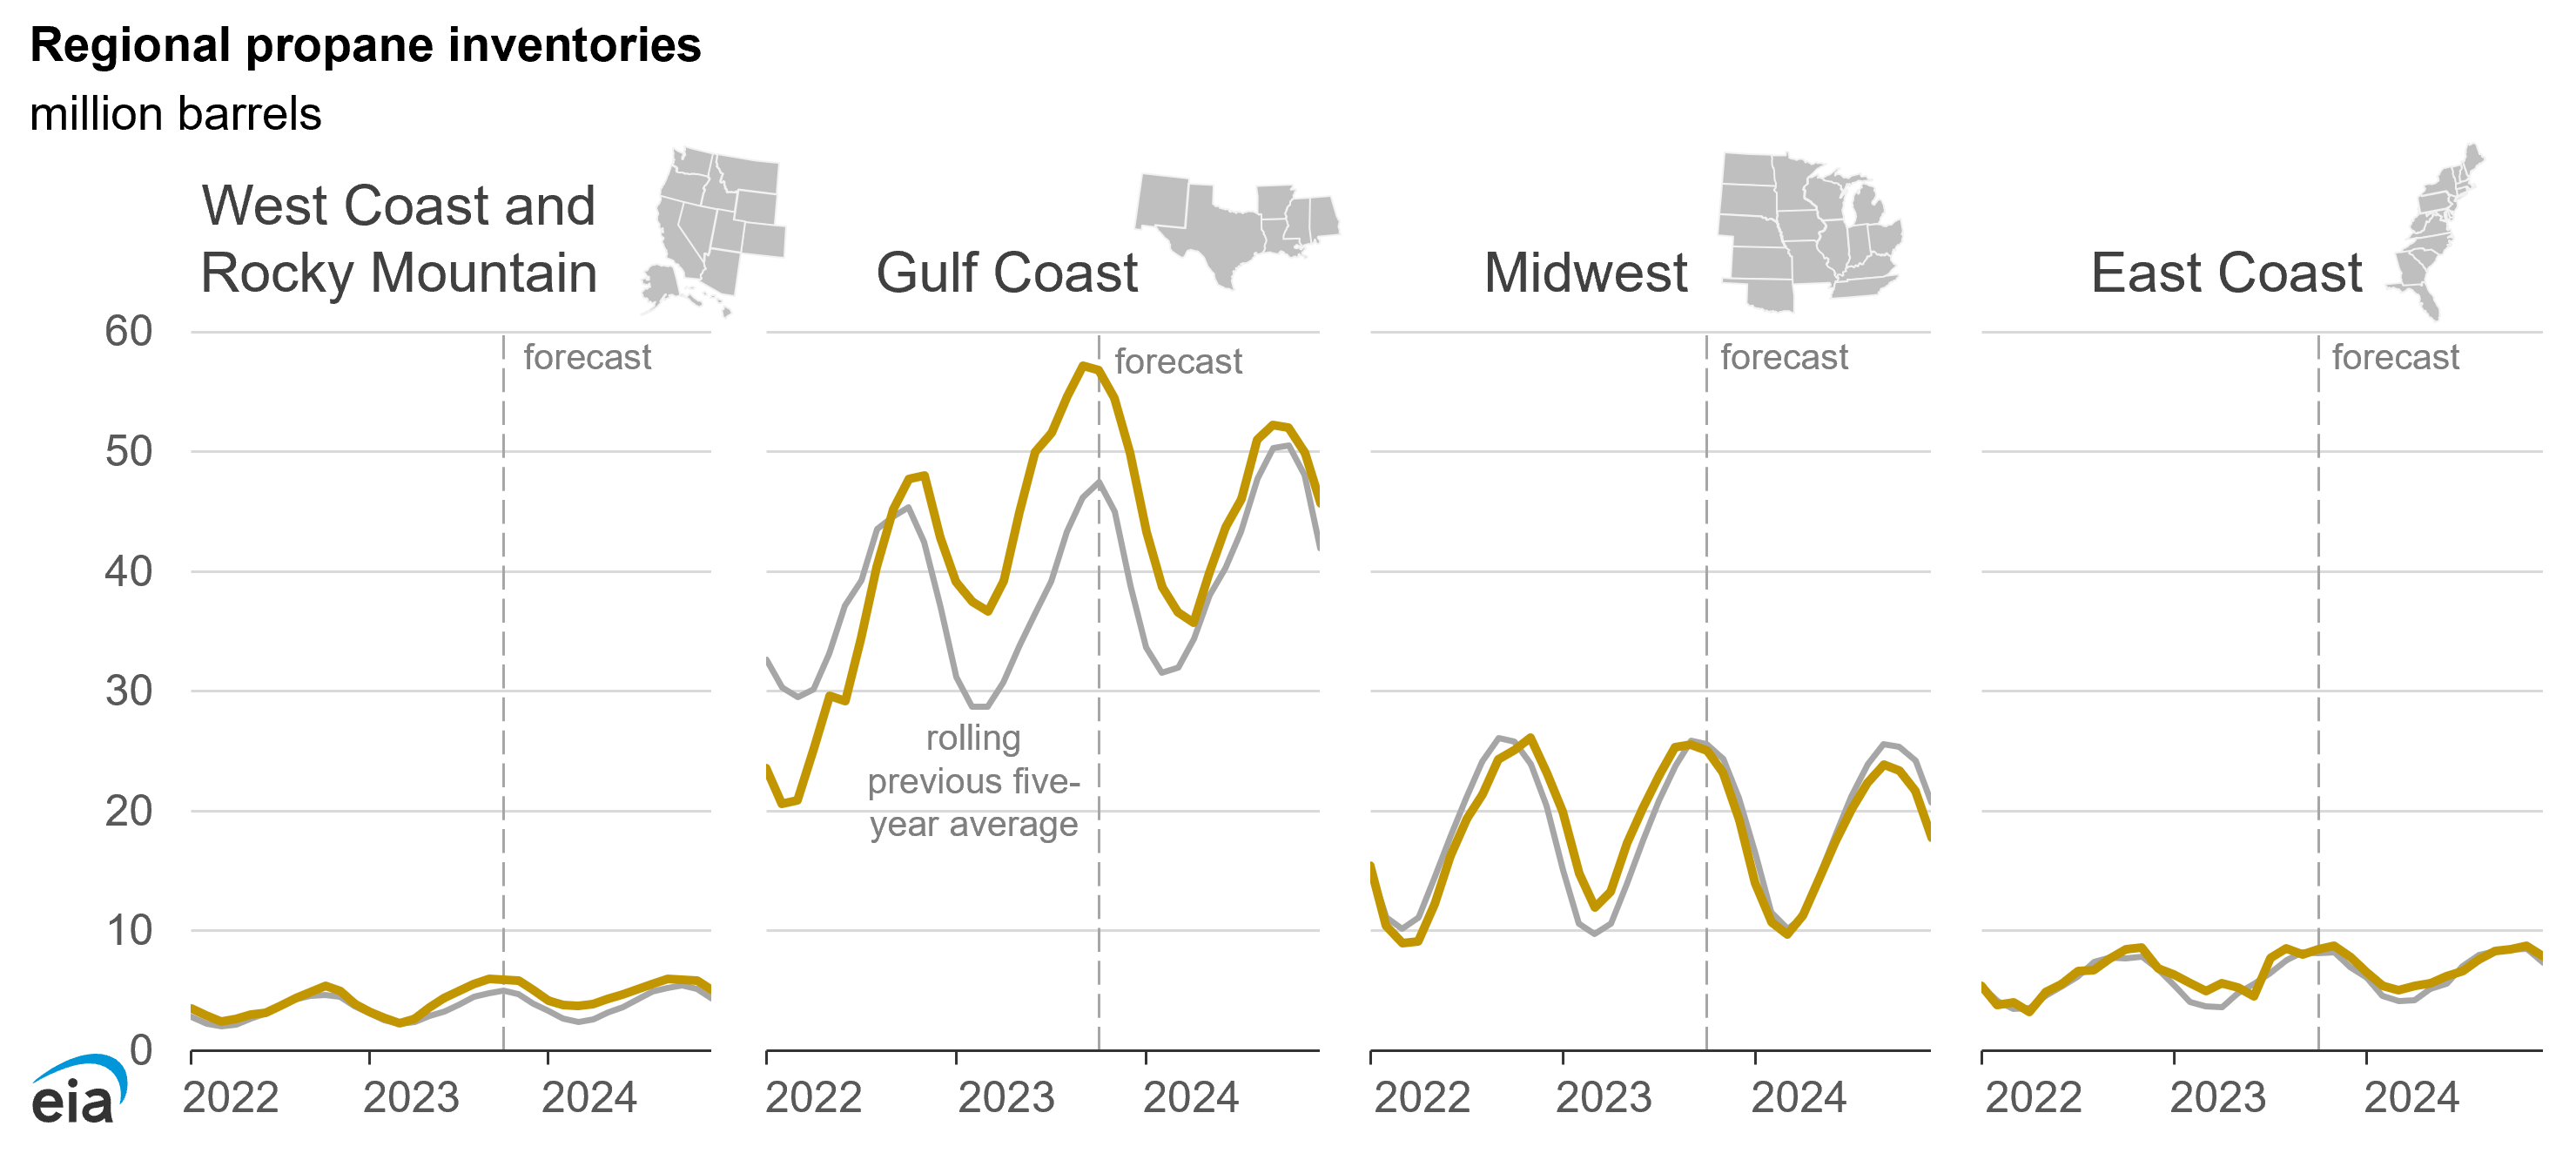
Propane inventories are highly seasonal. Inventories typically build from April to September, when propane consumption is relatively low, and fall during the winter heating season. At the end of September, U.S. propane inventories totaled 98 million barrels, 11 million barrels above the five-year average. In the Midwest (PADD 2), where most of the U.S. households that heat with propane and most of the demand for grain drying are located, inventories are 26 million barrels, which is 1 million barrels more than the five-year average. We forecast that propane inventories will remain well above their previous five-year average.
Heating oil
Heating oil, a variation of distillate fuel, is the primary space heating fuel for 4% of U.S. households. We forecast households that heat primarily with heating oil will use about 440 gallons on average this winter. At an average price of about $4.20/gal, we estimate average winter expenditures for those homes will be $1,850. Although we forecast heating oil prices will be about 10 cents/gal less than last winter, increased consumption means spending will be $130 higher this winter.
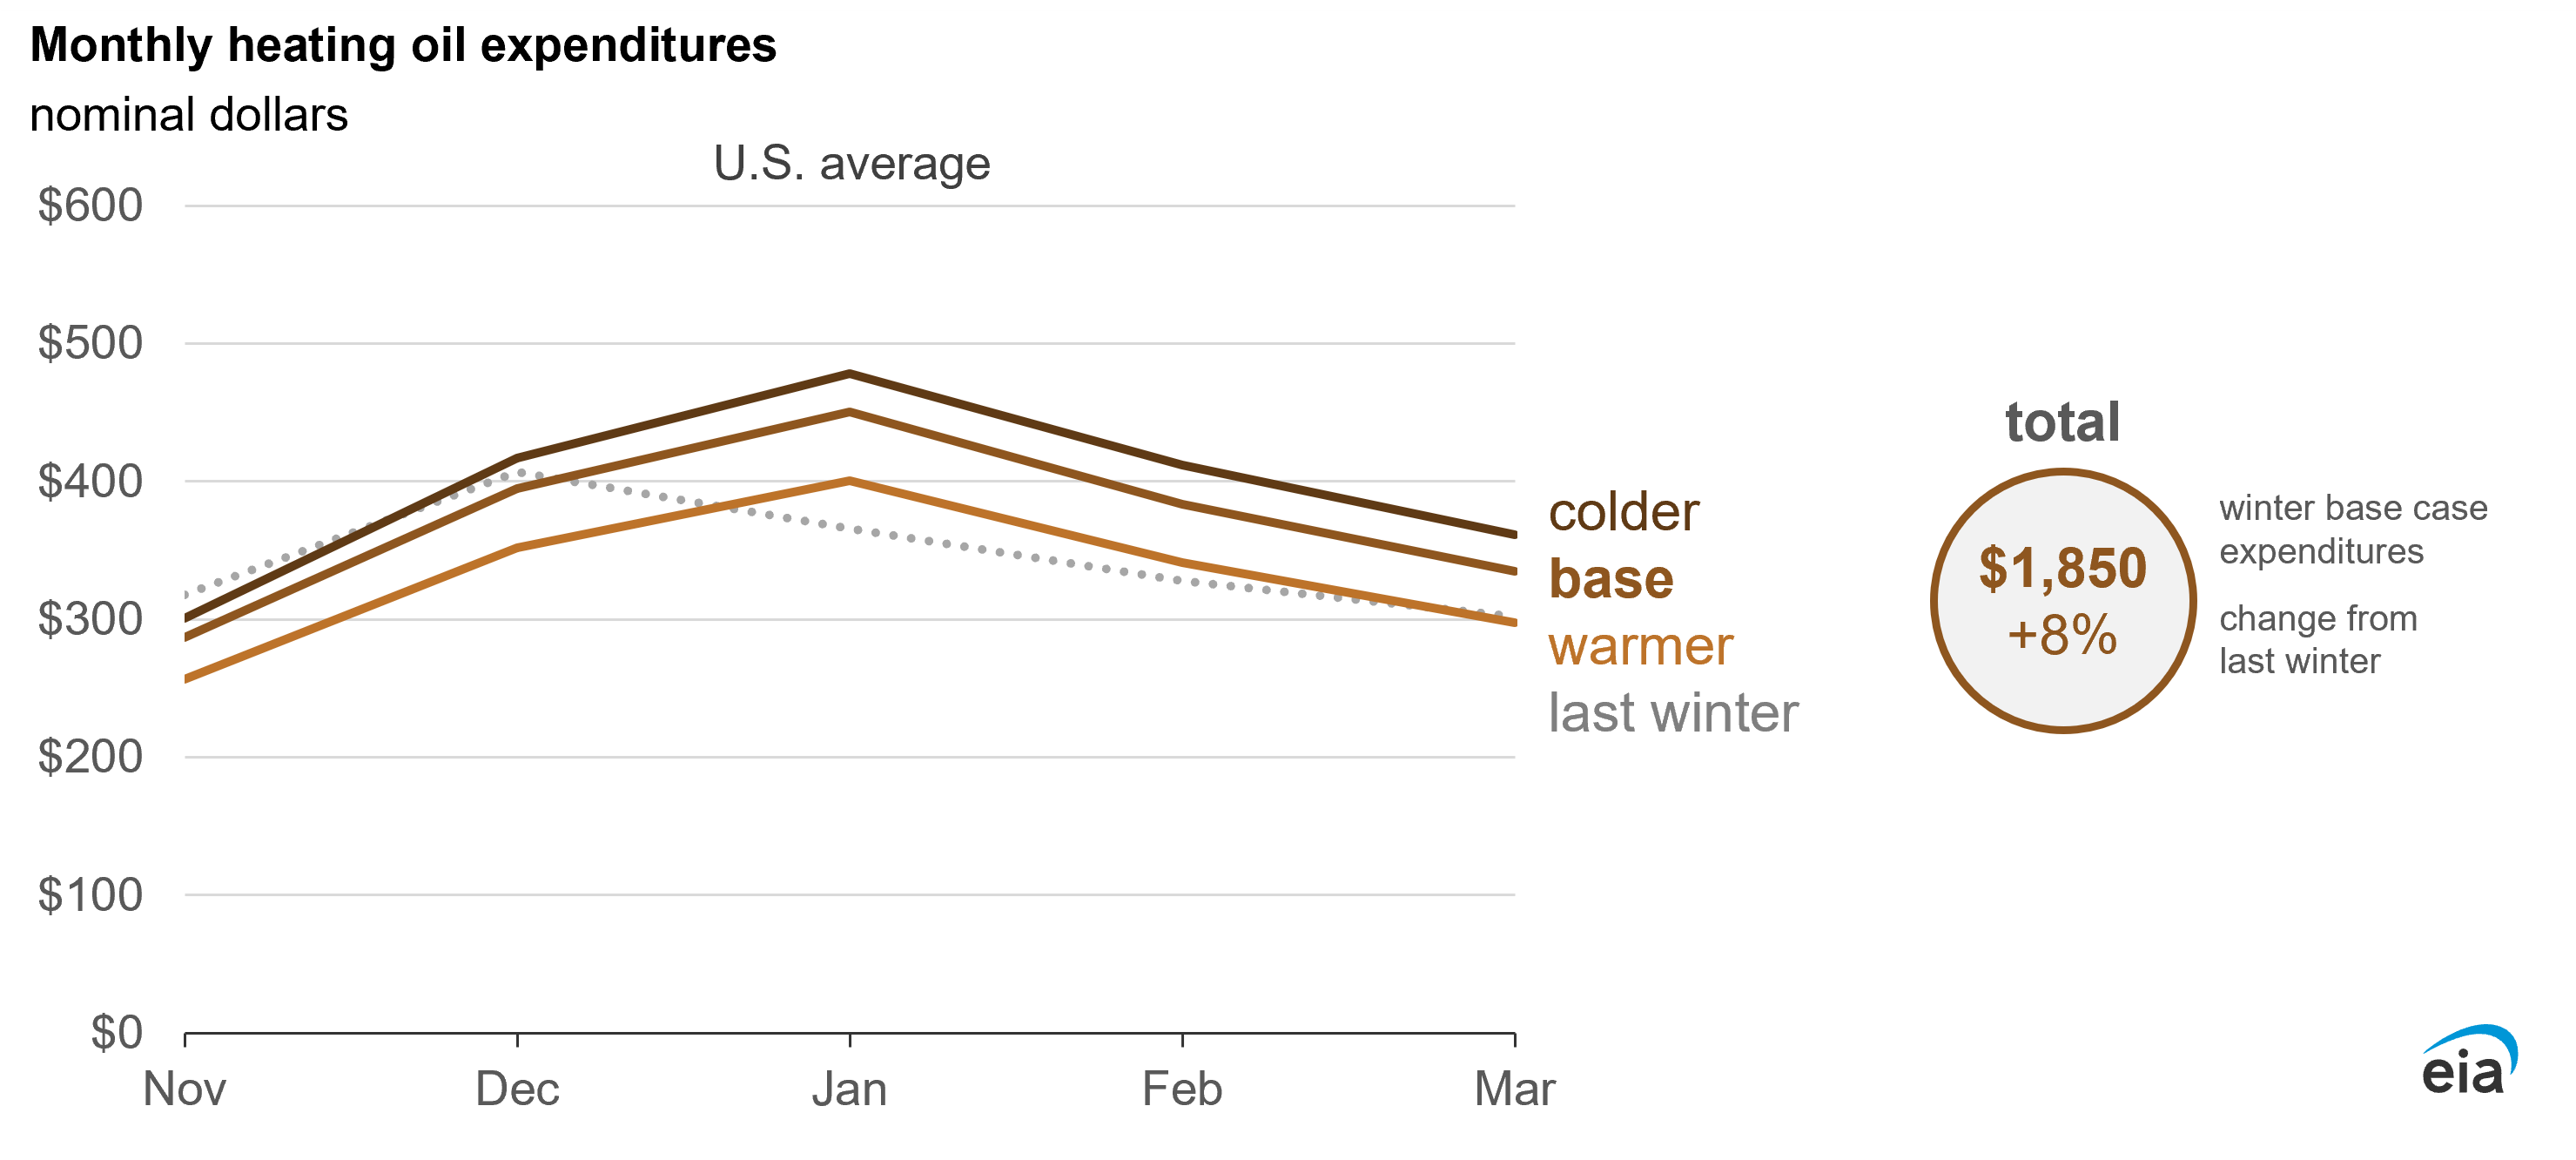
In our warmer case forecast for this winter, we expect average household consumption of heating oil will be about 50 gallons less than in the base case and heating oil prices will be slightly lower. As a result, we expect household expenditures will be $200 lower than the base case. Conversely, in our colder case, we estimate per household consumption would be more than 20 gallons higher than the base case and heating oil prices will be almost 10 cents/gal higher. As a result, total household winter expenditures would be $120 higher compared with the base case.
Almost all heating oil consumption for space heating in the United States occurs in the U.S. Northeast, particularly New England (PADD 1A) and the Central-Atlantic (PADD 1B). Even though we publish heating oil consumption as a U.S. average, the lack of significant consumption outside of the Northeast means the U.S. average price is heavily weighted toward the Northeast and corresponds closely to the Northeast regional average price.
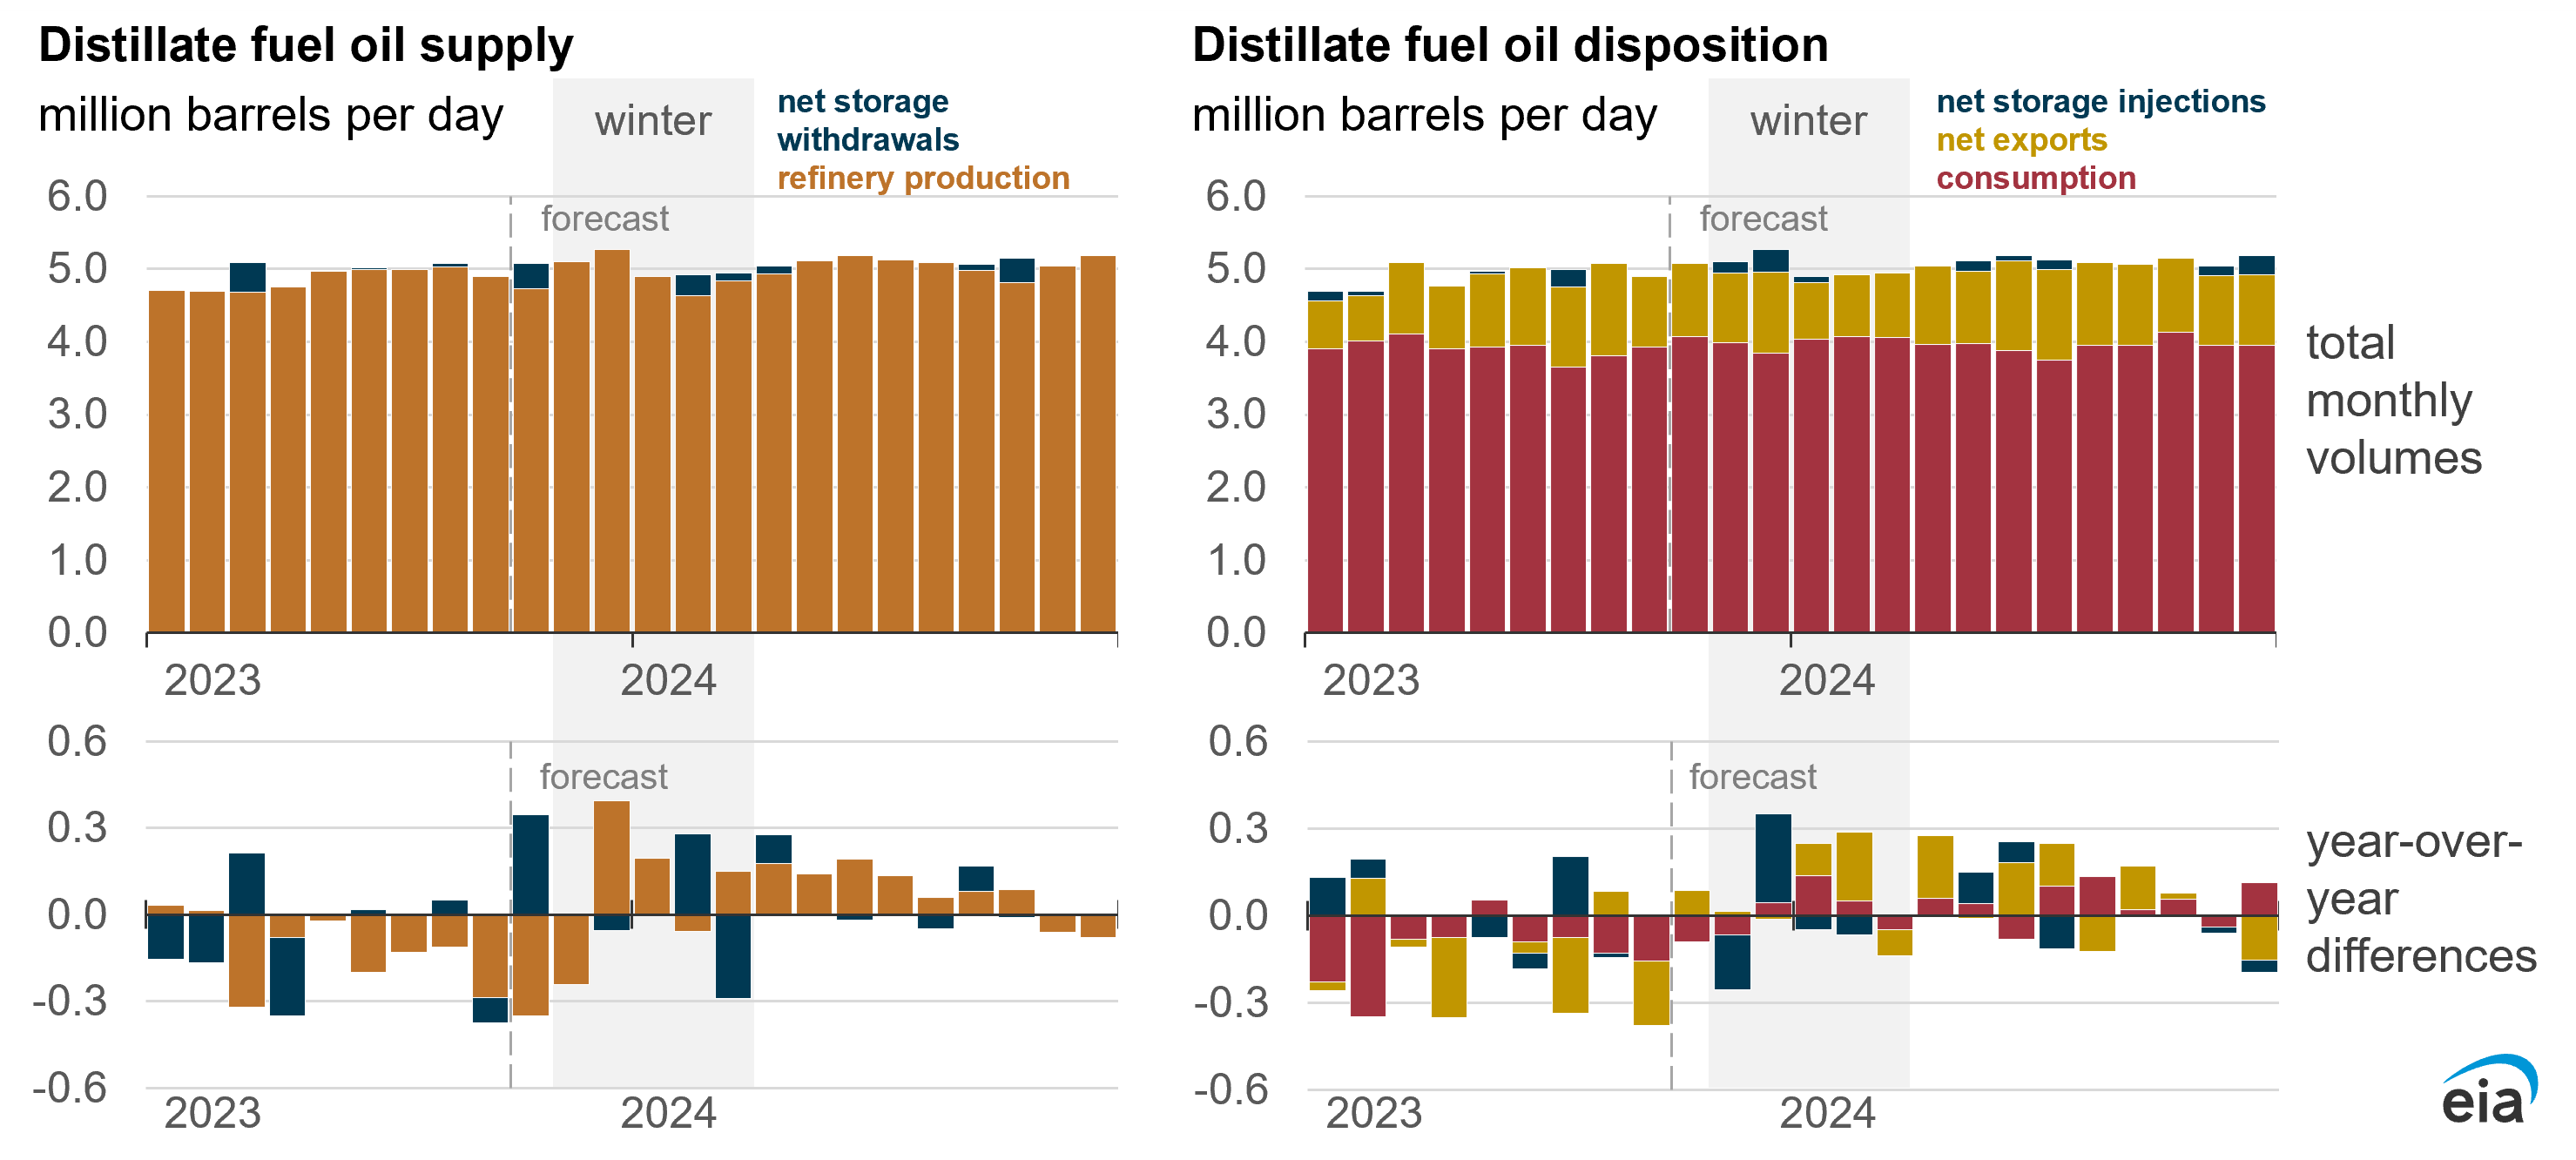
Data values: U.S. Petroleum and Other Liquids Supply, Consumption, and Inventories
Note: This image was reposted on Friday, October 13 to correct the values in the year-over-year differences.
The Northeast has relatively little refinery capacity and therefore relatively little production of distillate fuel oil, including heating oil. East Coast distillate supplies come primarily from transfers from other regions, particularly the U.S. Gulf Coast, as well as imports, particularly from Canada. We expect announced maintenance at the Irving Oil refinery in Saint John, New Brunswick, Canada, and at the Monroe Energy refinery in Trainer, Pennsylvania, will temporarily reduce East Coast distillate fuel oil supplies.
Despite increases in U.S. refinery capacity this year (primarily along the Gulf Coast), we expect maintenance will reduce total refinery runs by 150,000 b/d in the fourth quarter of 2023 compared with 2022. Most transfers from the Gulf Coast to the East Coast move along the Colonial pipeline. Necessary transfers beyond existing pipeline capacity are more expensive, as the prices must reflect more costly coastal freight rates. Prices may also increase to attract international cargoes to the Northeast.
Distillate inventories in the United States have been well below average since last year, and we currently estimate U.S. distillate inventories will decline by 11 million barrels in October, more than the average October draw from 2018–22 of 8 million barrels, largely because of reduced supply due to refinery maintenance and increased consumption in the Midwest related to agricultural demand.
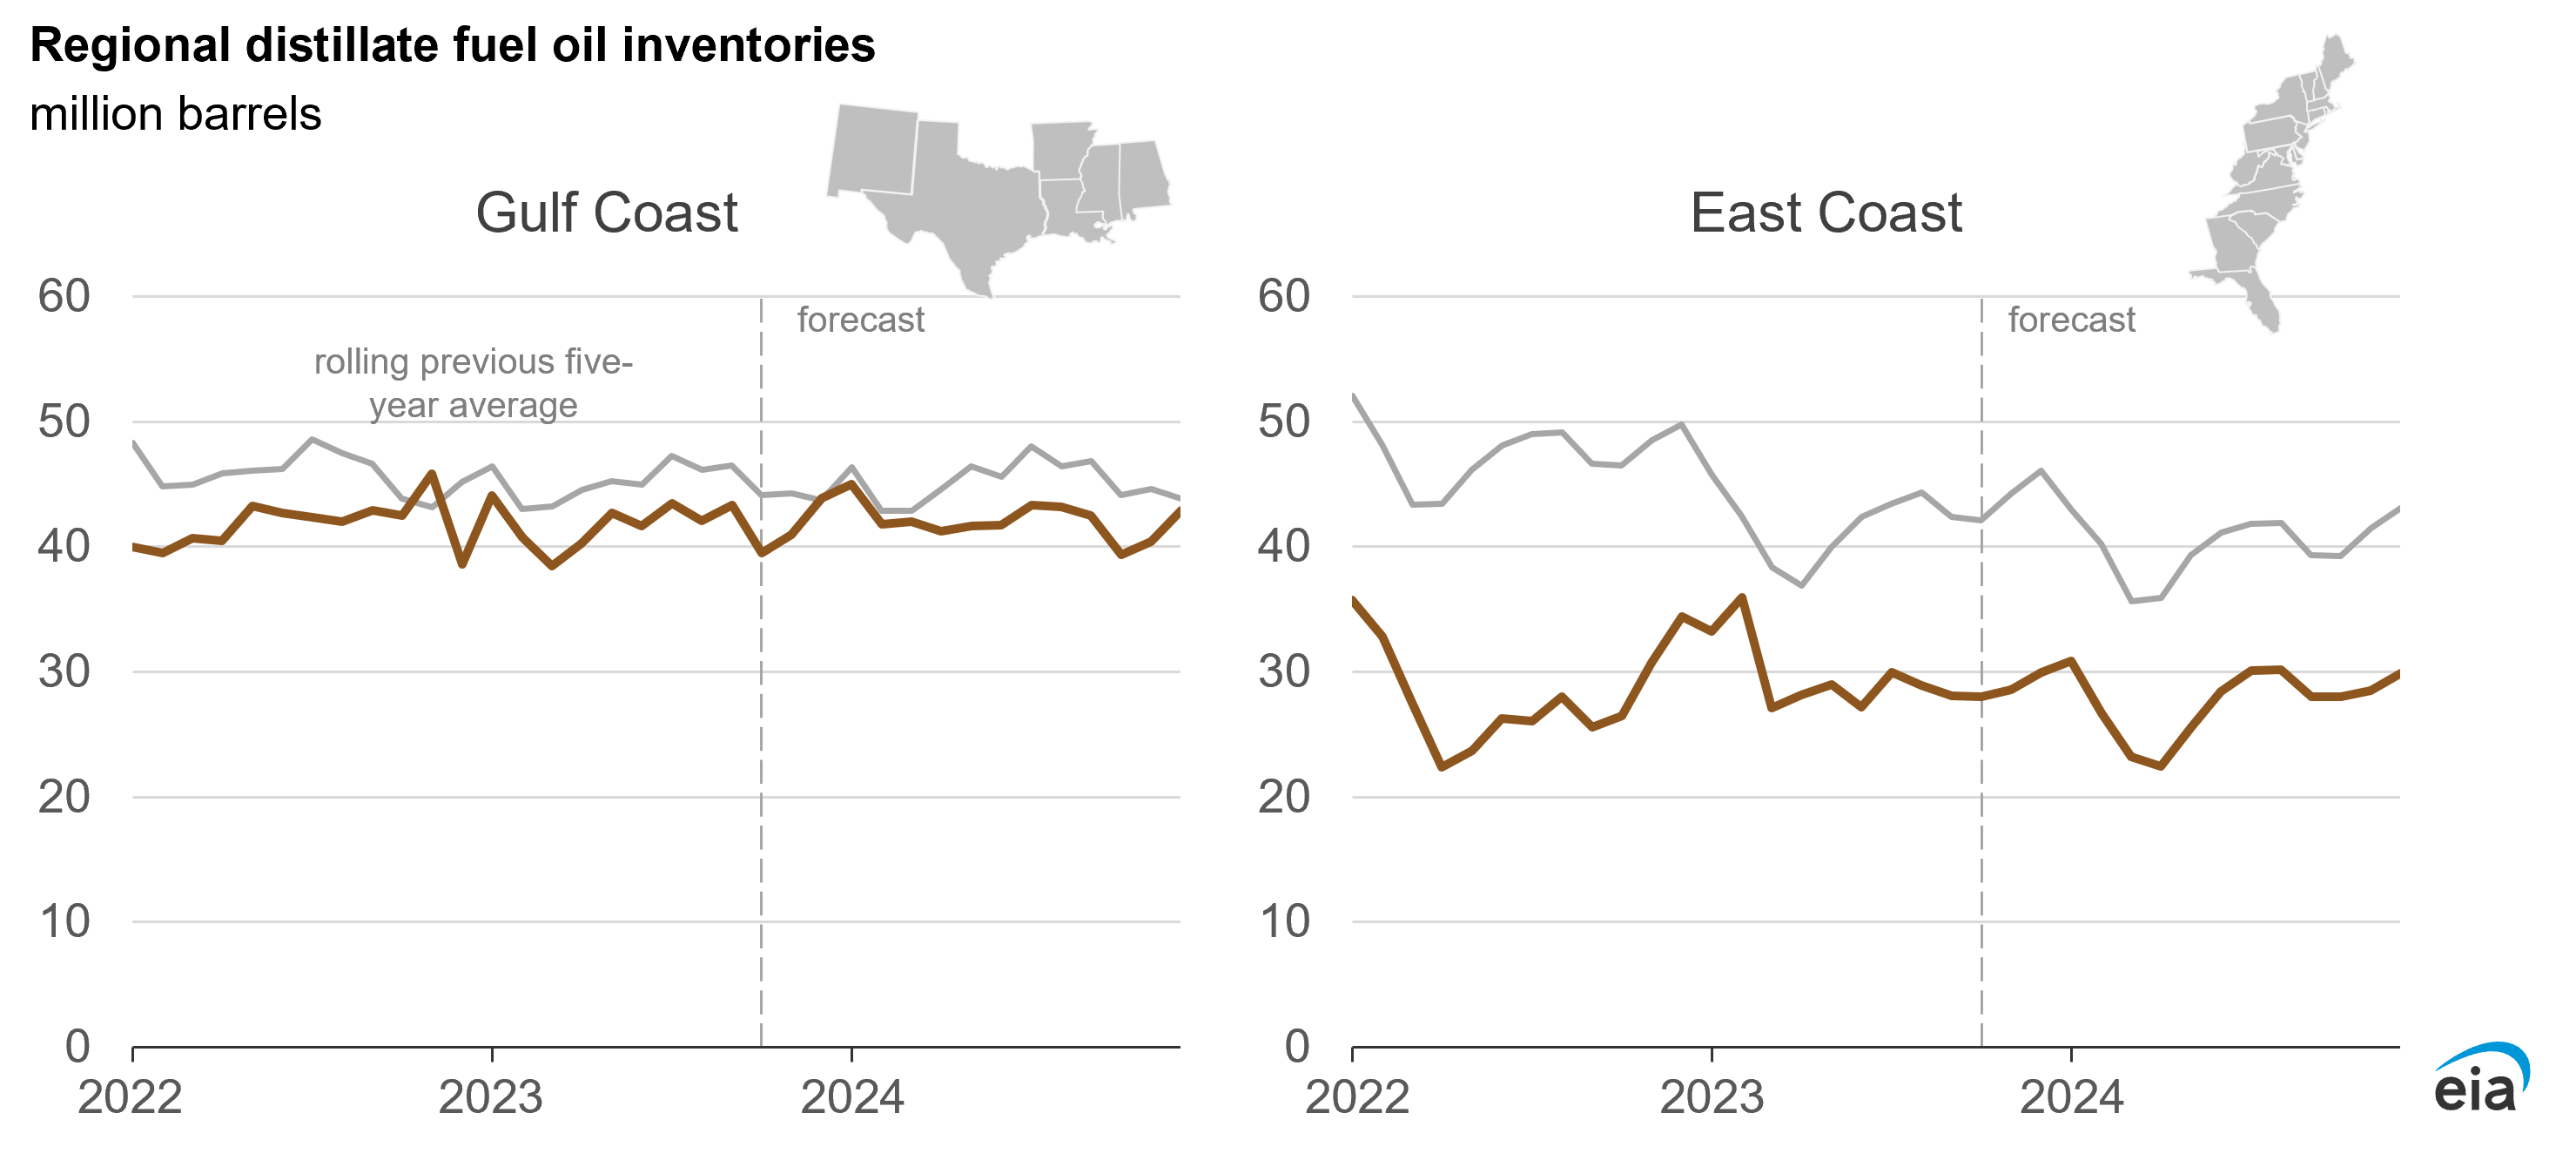
Data values: U.S. Petroleum and Other Liquids Supply, Consumption, and Inventories
Although we do not expect an inventory draw of a similar magnitude on the East Coast, we do estimate that regional refinery outages will prevent major inventory builds on the East Coast. As a result, we estimate regional distillate inventories will fall below 2022 levels beginning in November 2023 and will remain below 2022 levels until April 2024.
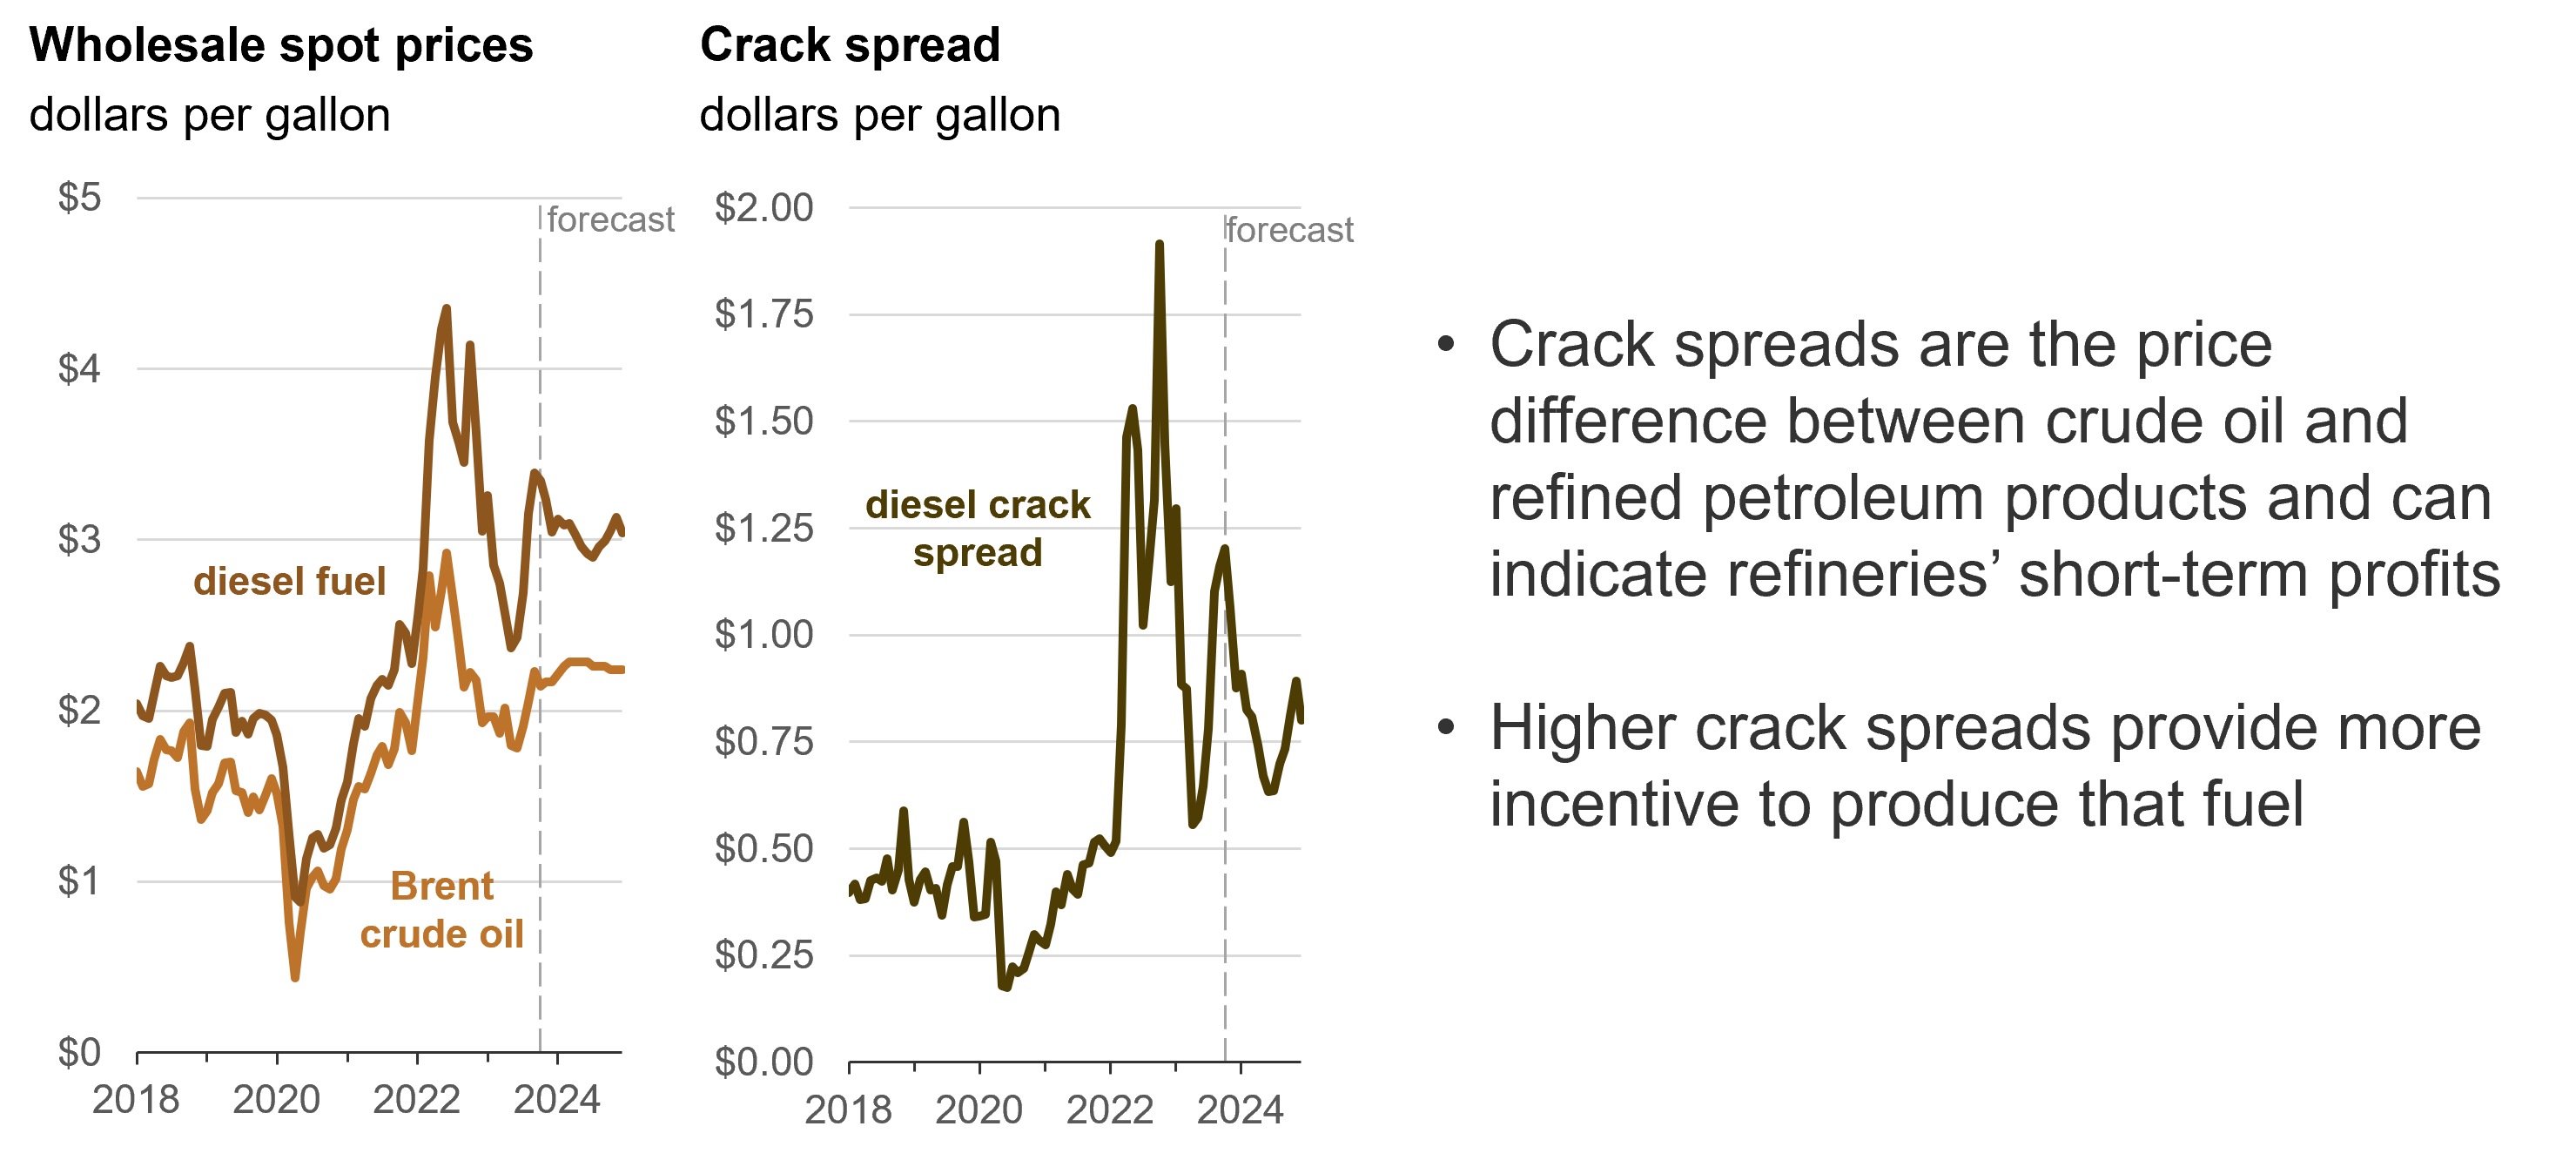
We estimate the heating oil crack spread—the difference between the wholesale price of heating oil and crude oil—to be about 80 cents/gal this winter, around 25 cents/gal lower than last winter. However, heating oil prices and crack spreads last winter set historic highs, and we expect the heating oil crack spread this winter will still be around double the average of the last five winters.
Many factors that contributed to the high distillate crack spread last winter remain true, including lower regional, national, and global distillate inventories; and lower regional refinery capacity compared with pre-pandemic levels. Several factors have contributed to the lower crack spreads, including falling demand for U.S. distillate fuel, expanded U.S. and global refinery capacity, and the normalization of the distillate supply chain that was severely disrupted after Russia’s full-scale invasion of Ukraine in 2022.
Data values: Energy Prices
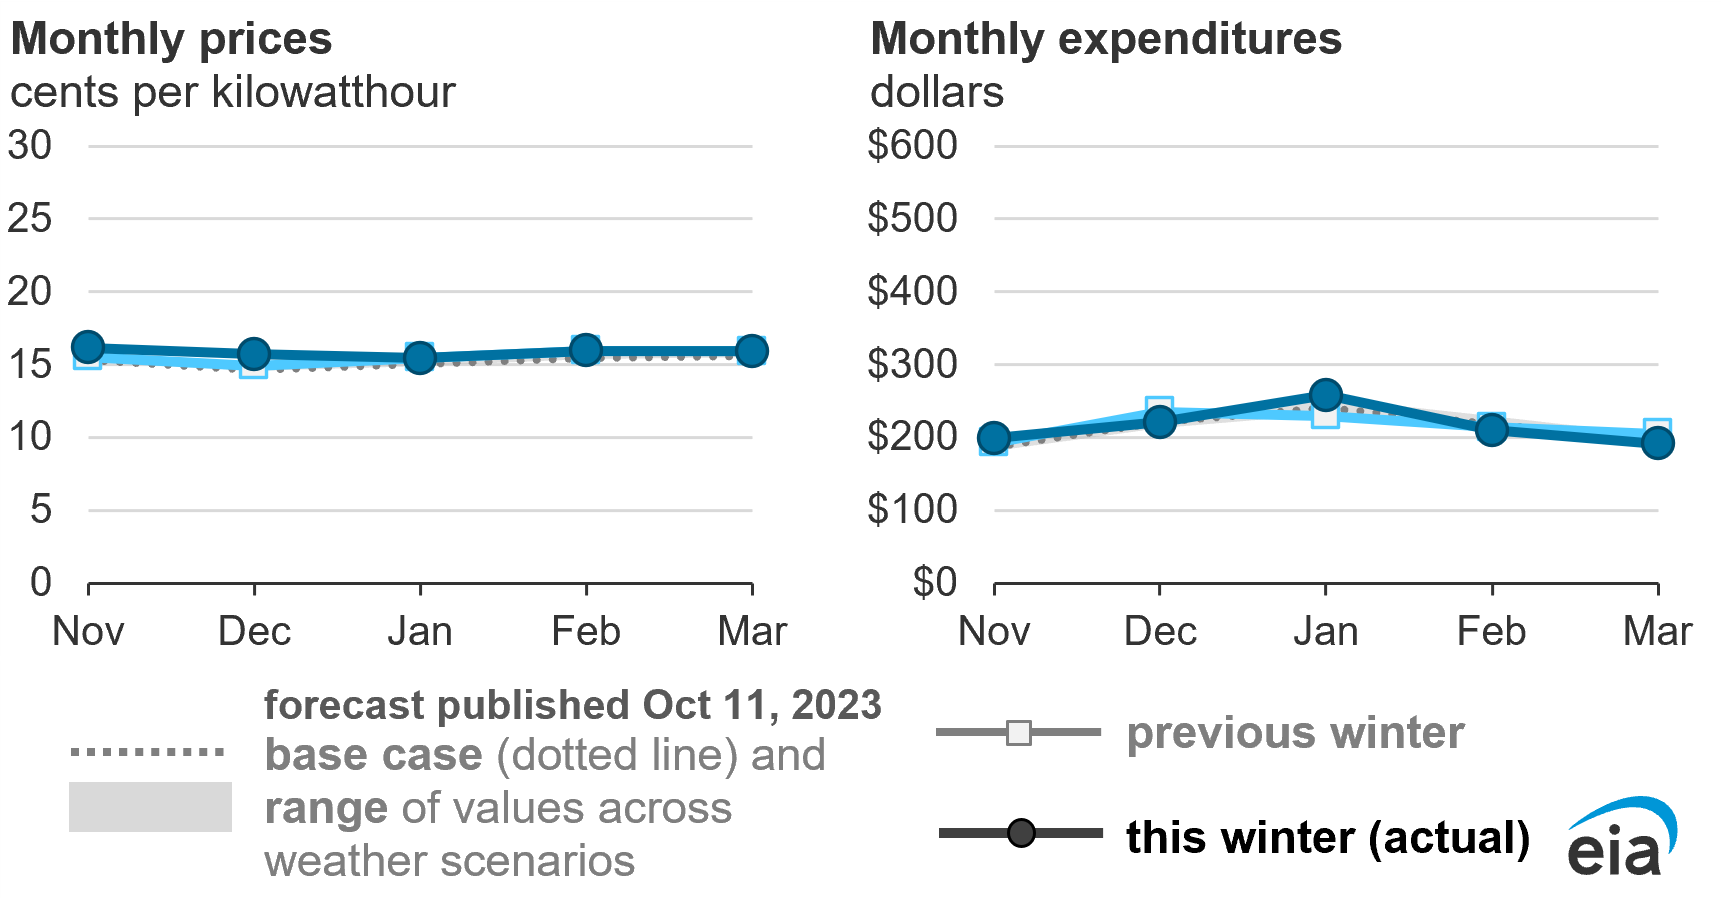
Electricity
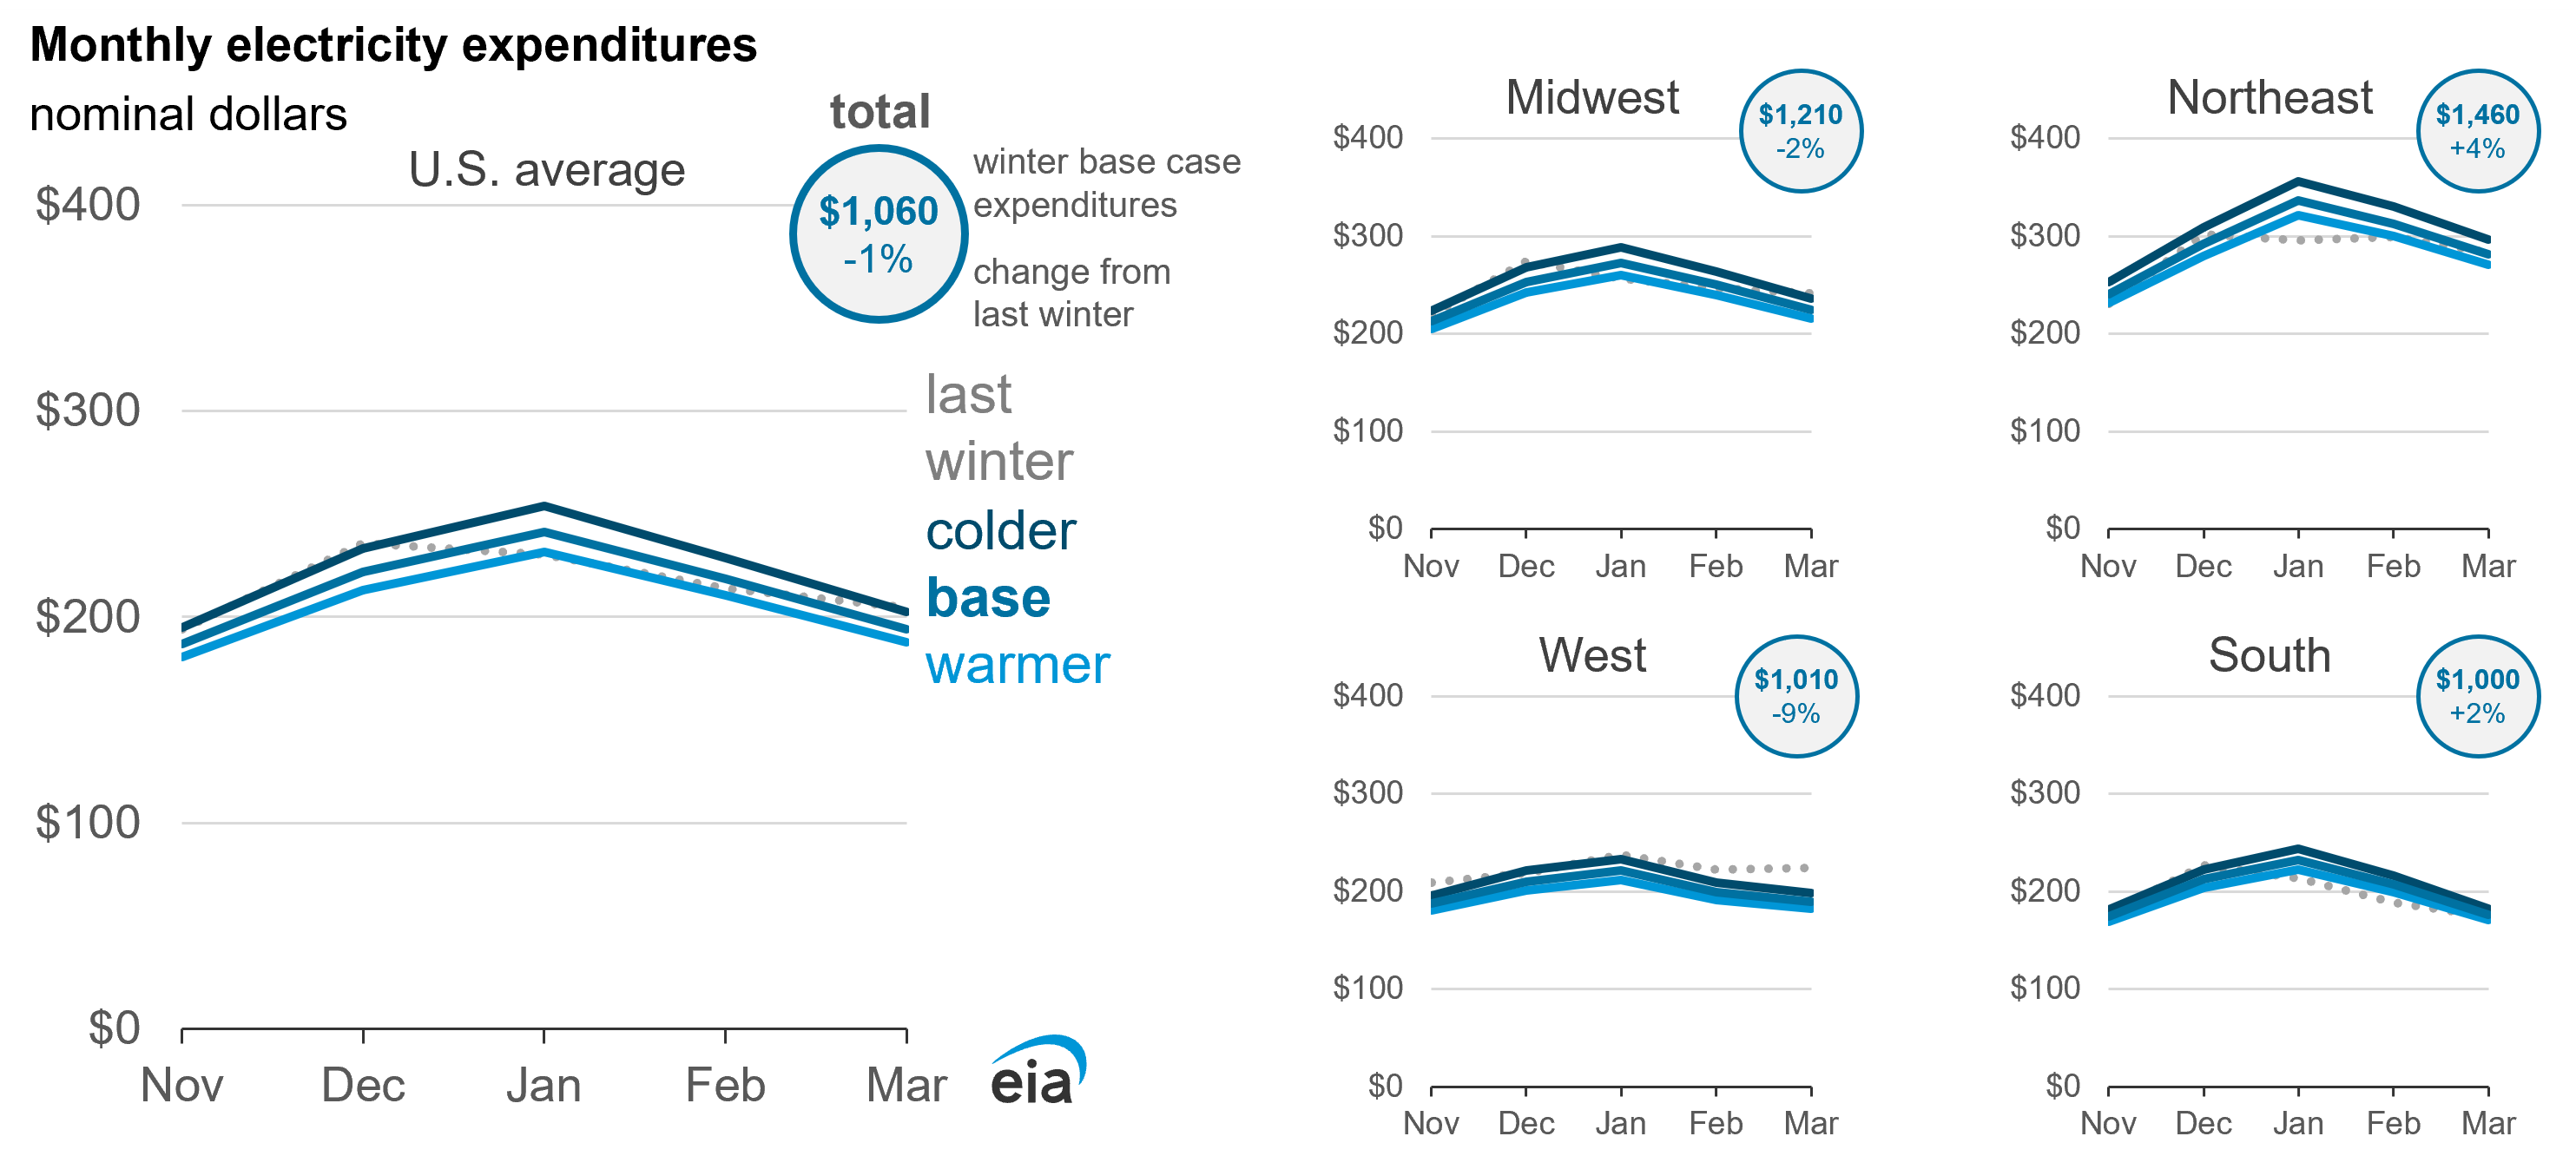
U.S. households that heat primarily with electricity will spend an average of about $1,060 this winter on their electricity bills, which is about the same as last winter. A slight increase in forecast average U.S. electricity consumption is offset by an expected 2% decline in U.S. residential electricity prices.
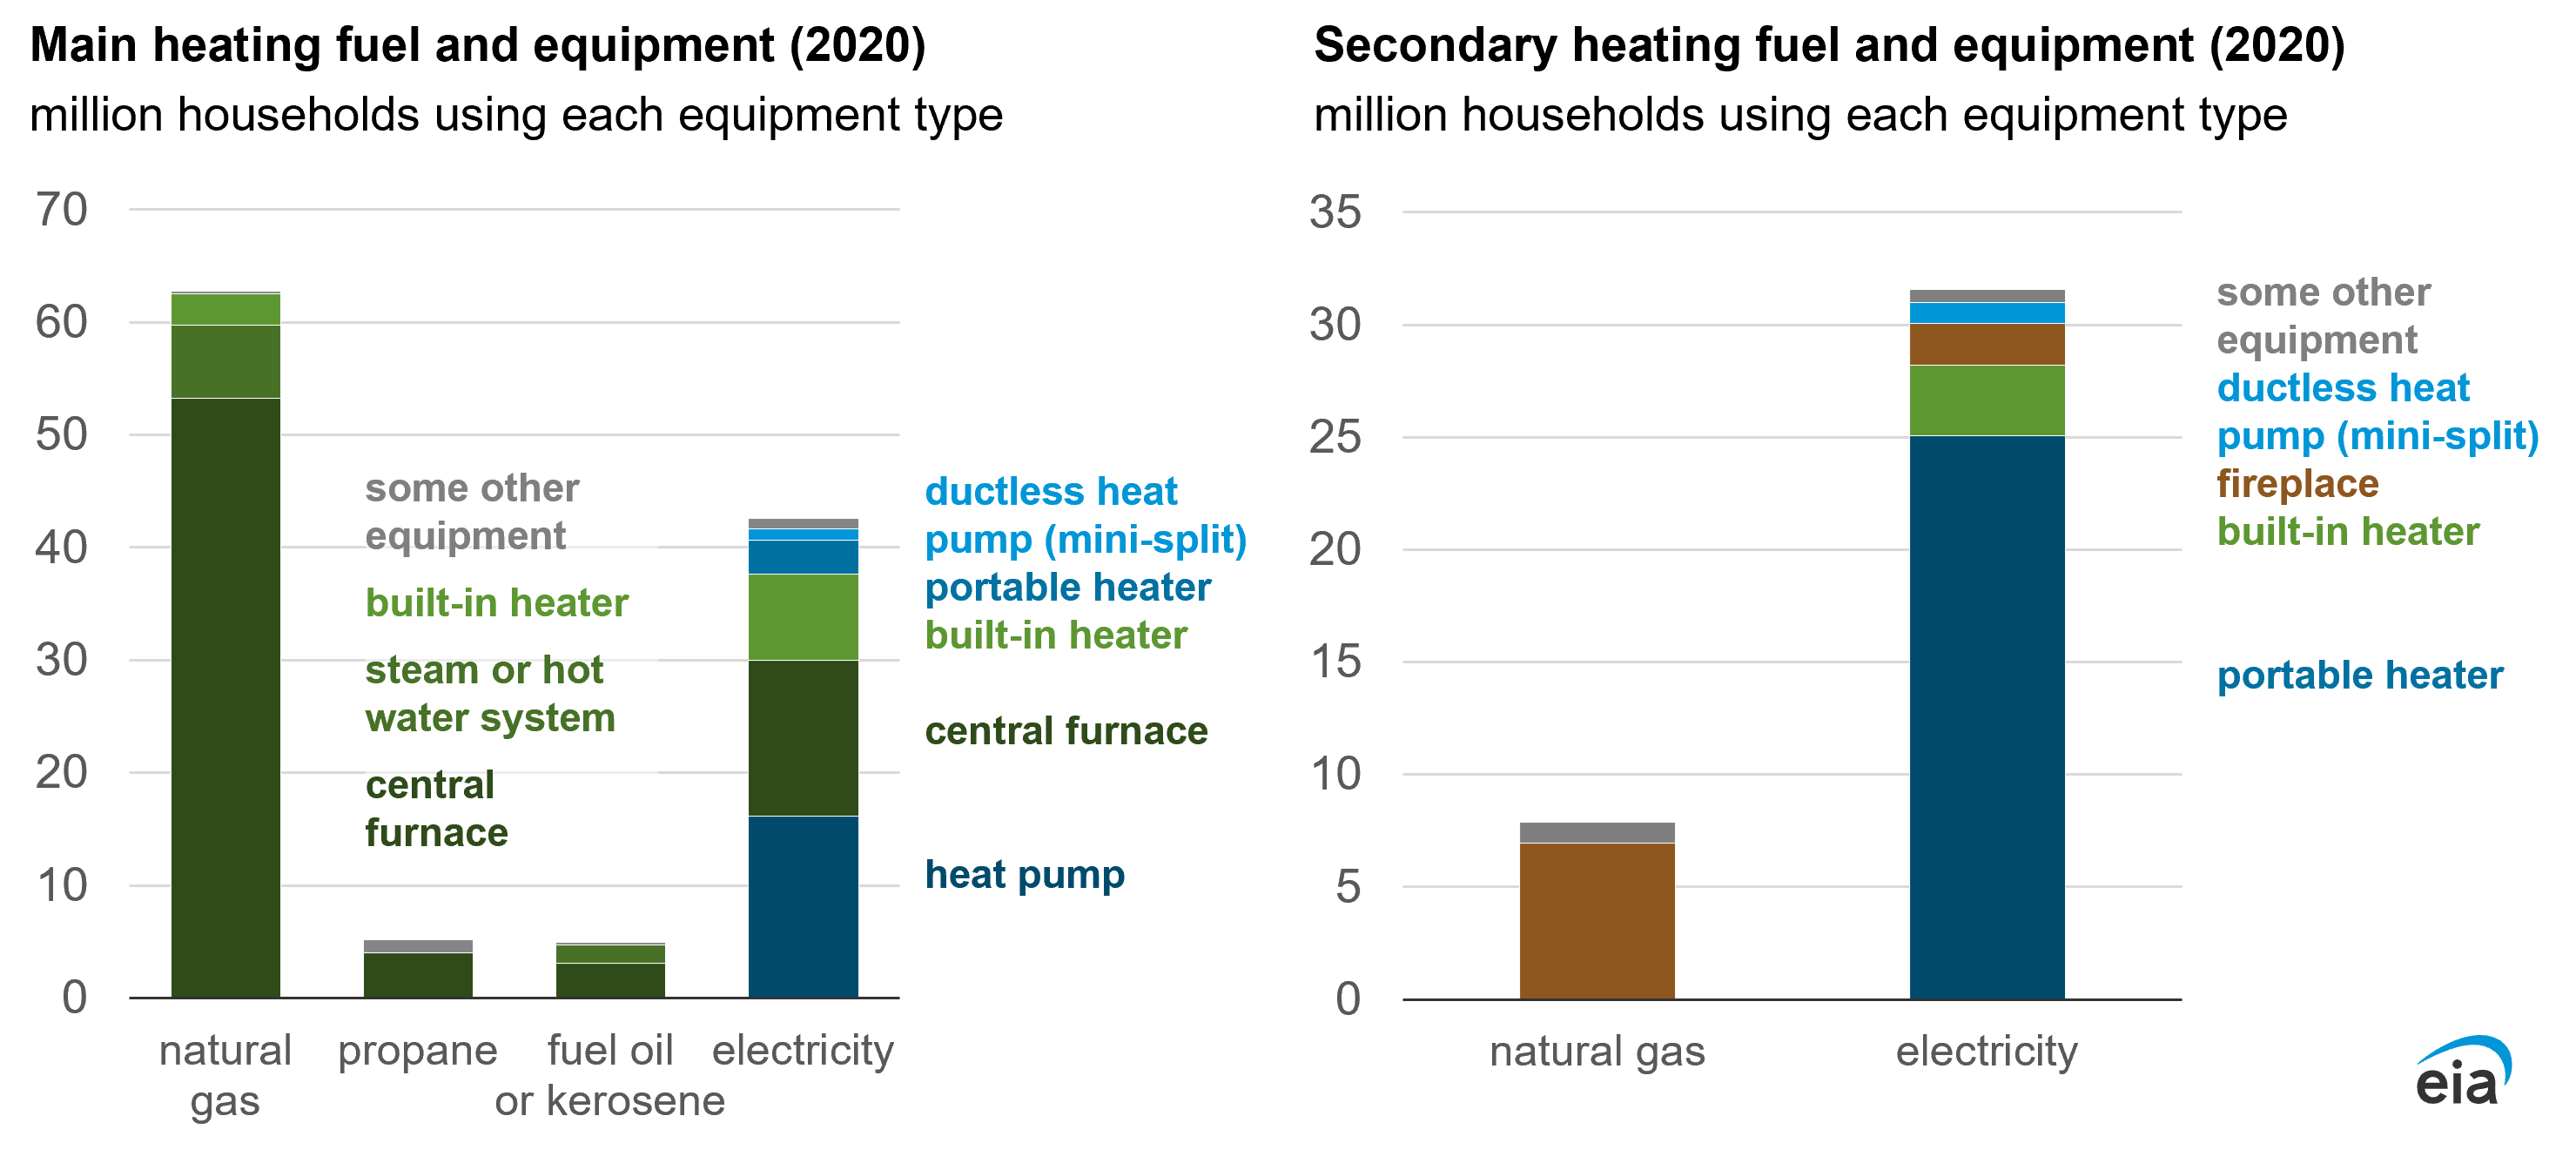
Nearly all U.S. households use electricity in some form, but 42% of households rely on electric heat pumps or electric resistance heaters as their primary source for space heating. Electric space heating is most common in the South, but the use of energy-efficient heat pumps is increasing in other regions of the country. The heating equipment used by homes that heat primarily with electricity is varied compared with other heating fuels that largely use a central furnace. Values shown in the WFO are a weighted average of all electric heating equipment.
Total expenditures will vary from our forecasts in this outlook depending on the efficiency of the equipment, along with housing characteristics and geography. For example, heat pumps are more efficient than electric resistance heating because, like a refrigerator, they move heat rather than converting electricity to heat. Based on analysis of our 2020 RECS, we estimate that heat pump households use less electricity to heat their homes than those using electric resistance heating. Existing homes with heat pumps tend to be larger and in warmer regions of the United States compared with those using electric resistance heating, which affects their overall expenditures on electricity.
Data values: Table HC6: Space Heating
For the upcoming winter, the largest driver of changes in electricity expenditures we forecast is the level of consumption. For the West, we forecast 10% less residential consumption this winter than last because of milder expected temperatures. In contrast, our forecast of winter consumption rises by 5% in the South.
We forecast a slight decrease in residential electricity prices this winter, with U.S. prices averaging 15.2 cents per kilowatt, about 2% lower than last winter. The lower prices for retail customers reflect the relatively low cost of producing power over the past year, especially the cost of natural gas.
A key determinant of electricity prices is the regional mix of generators used to produce electricity. Several factors help to explain the electricity price forecast for this winter. Last winter, electricity generation fueled by natural gas reached a new record of 619 billion kilowatthours (kWh), accounting for nearly 40% of all generation in the U.S. electric power sector. We forecast a similar level and share of natural gas generation for winter 2023–24. The addition of new natural gas-fired generating capacity has been one factor keeping natural gas the largest source of power generation. By October 31, we expect U.S. natural gas generating capacity to have grown by 4.7 gigawatts (GW) from the previous October.
A more important contributor to the record levels of natural gas generation is the continued retirement of coal-fired capacity. Coal-fired power plants are less economical to operate than they have been in the past because of sustained low costs for competing power sources including natural gas and renewables. We expect that renewables will provide more than 25% of total U.S. electricity generation this winter, as the generating capacity of renewables steadily expands.
The amount of coal capacity operating at the end of 2022 was 66 GW lower than in 2017 (a decrease of 26%), and we expect the amount operating in October 2023 will be 10 GW lower than October 2022. We forecast coal will provide about 15% of total U.S. generation in winter 2023–24, down from a share of 18% last winter.
The relative levels of natural gas and coal generation this winter depend on the availability and deliverability of fuel. Winter Storm Elliott in December 2022 and Winter Storm Uri in February 2021 led to forced outages at some natural gas-fired power plants in the affected regions as a result of constrained fuel supplies. Based on the nature of a cold snap, outages could affect a range of generating and distribution assets that could cause reliability issues during this winter.
Inventories of coal at coal-fired power plants are higher than last winter, with October stocks expected to be 41% higher than last winter. In the event of severe winter storms in the coming months, the remaining coal fleet may be called on to operate at higher utilization rates than last year.
Links to EIA's winter-related resources
EIA maintains several data series and products that can inform energy markets throughout winter.
For natural gas, we publish daily spot and futures prices and monthly residential natural gas prices by state. Our Weekly Natural Gas Storage Report captures changes in natural gas inventories, and these metrics are visualized in our Natural Gas Storage Dashboard.
For propane and heating oil, our Heating Oil and Propane Update page provides wholesale and retail prices for several states. These prices are published weekly throughout the months of October through March. Our Weekly Petroleum Status Report provides weekly inventory, production, and demand data series that are visualized on the Heating Oil and Propane Update page.
Specifically for propane, we provide a weekly briefing on propane inventory levels that offers more granular detail than the information in our Weekly Petroleum Status Report.
For electricity, our Hourly Electric Grid Monitor provides hourly information on electric demand and net electricity demand by source throughout the Lower 48 states. Our Electric Power Monthly compiles information on state-level retail electricity prices and demand. These series are also presented in our Electricity Data Browser.
We also publish a daily New England Dashboard that displays electricity, natural gas, and petroleum market metrics for the New England region.
↑ Top