Winter Fuels Outlook 2025–26
as published on October 15, 2025, unless otherwise noted
Winter Fuels Outlook presentation
For each Short-Term Energy Outlook (STEO) released during the winter of 2025–26, we will update our forecast values and compare them in the tables below.
Forecast comparisons
| Monthly Expenditures | % change from prev. winter | ||||||
|---|---|---|---|---|---|---|---|
| Nov | Dec | Jan | Feb | Mar | total | ||
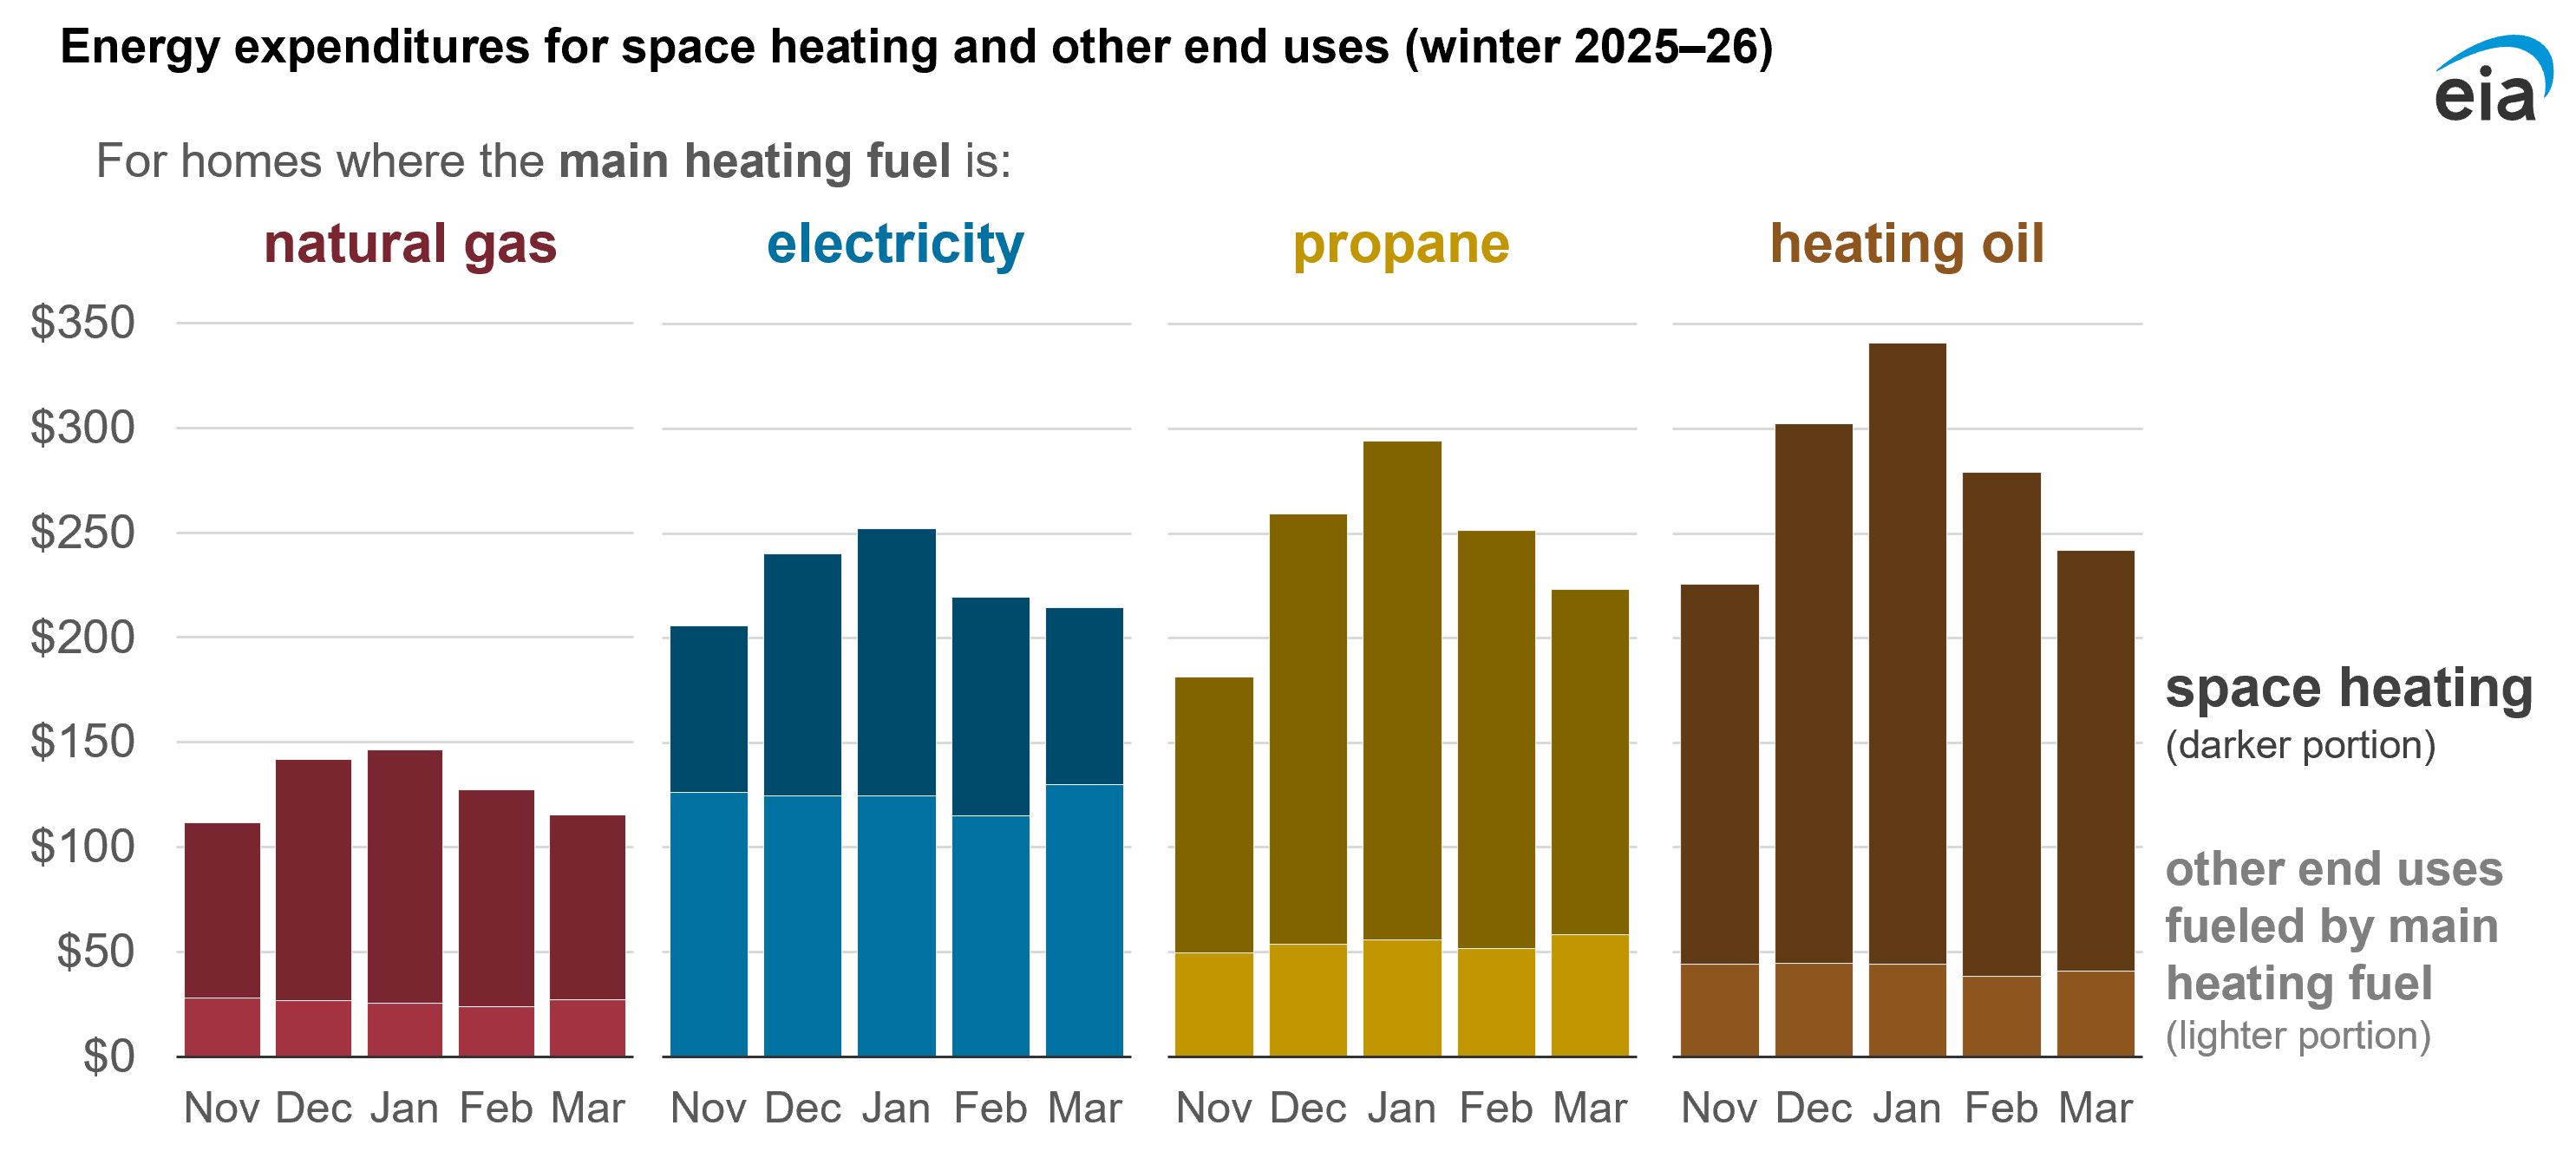
| Natural Gas | $112 | $142 | $146 | $127 | $115 | $642 | -1% |
| Electricity | $206 | $240 | $252 | $219 | $215 | $1,133 | +4% |
| Propane | $181 | $259 | $294 | $252 | $223 | $1,210 | -9% |
| Heating Oil | $226 | $302 | $341 | $279 | $242 | $1,390 | -8% |
| Monthly Heating Degree Days | % change from prev. winter | ||||||
| Nov | Dec | Jan | Feb | Mar | total | ||
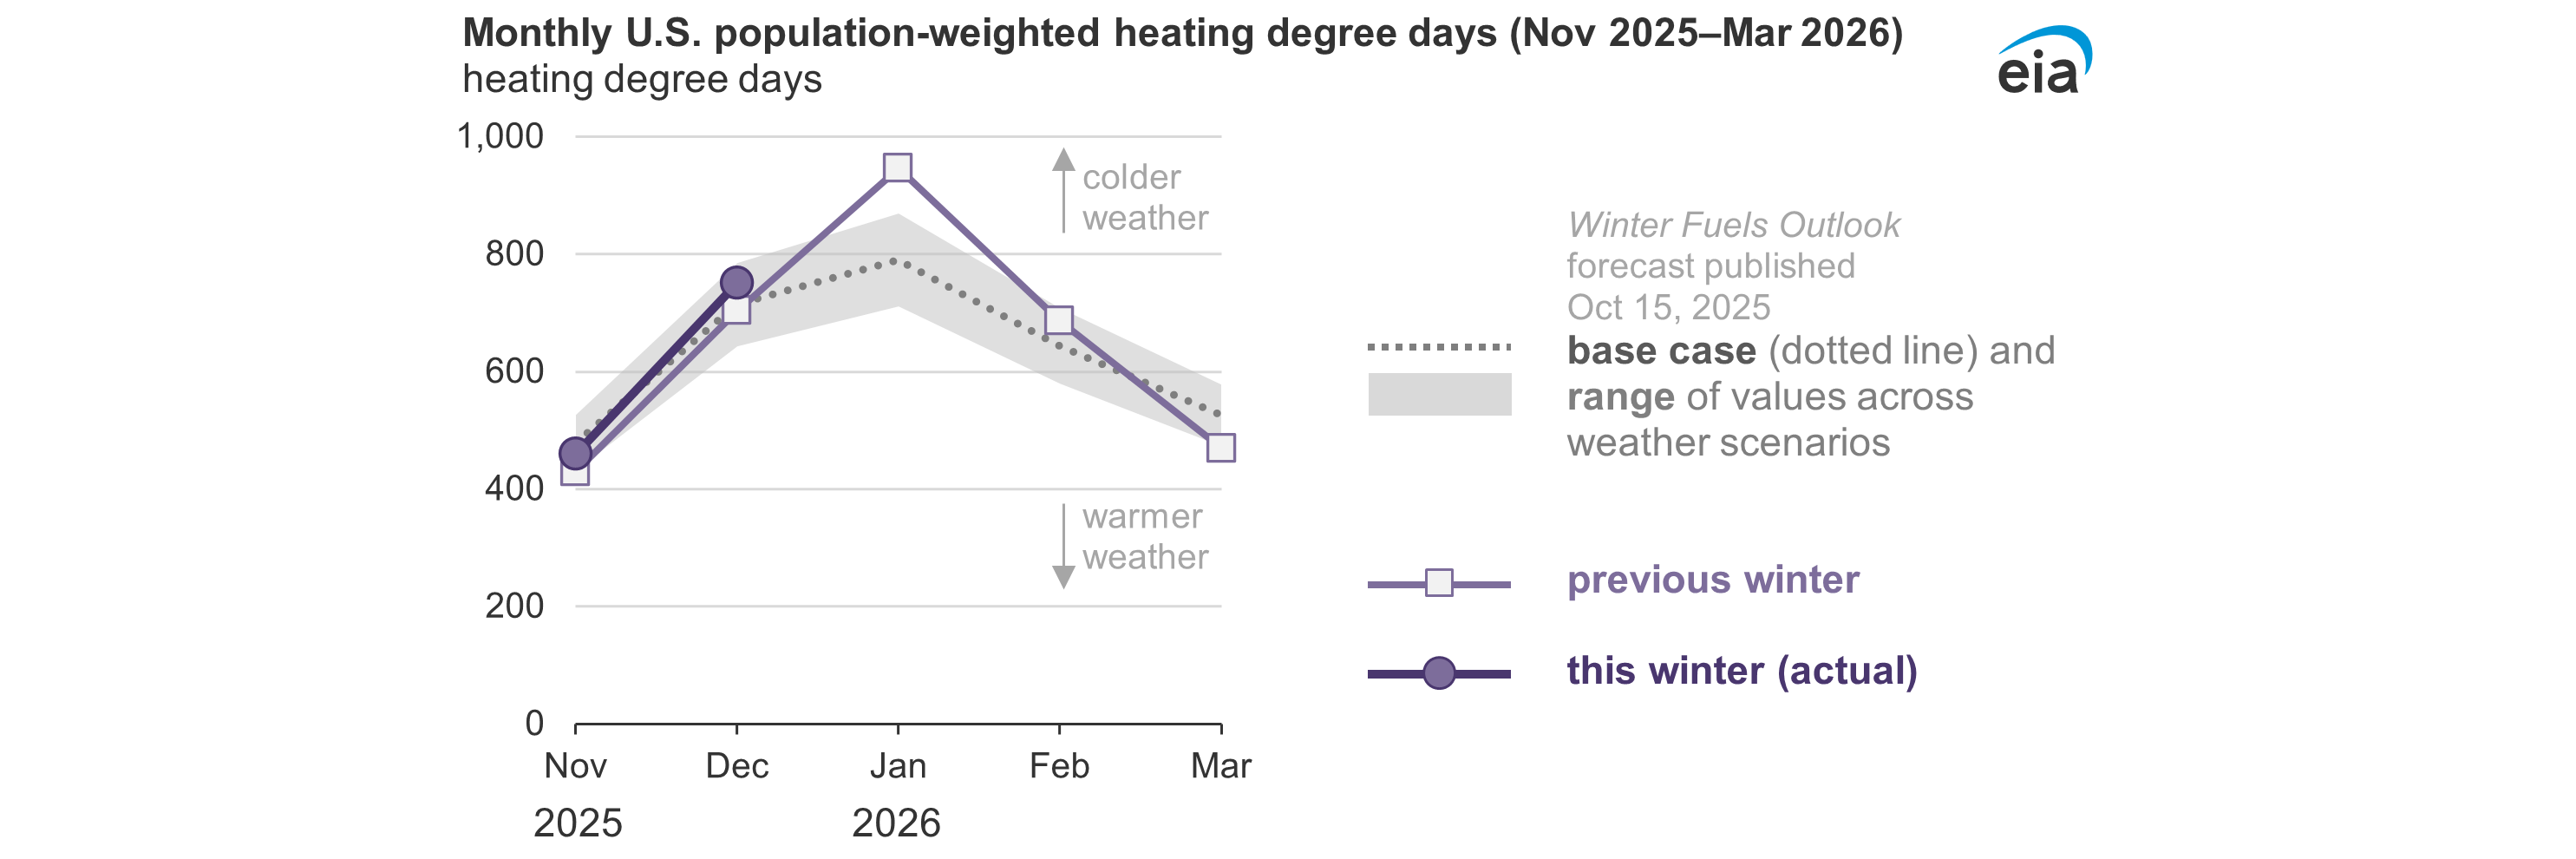
| U.S. average | 479 | 714 | 791 | 644 | 525 | 3,153 | -3% |
| Monthly Expenditures | % change from prev. winter | ||||||
|---|---|---|---|---|---|---|---|
| Nov | Dec | Jan | Feb | Mar | total | ||
| Natural Gas | $114 | $144 | $150 | $129 | $117 | $654 | +1% |
| Electricity | $205 | $241 | $253 | $220 | $215 | $1,134 | +4% |
| Propane | $201 | $281 | $314 | $265 | $233 | $1,293 | -2% |
| Heating Oil | $225 | $307 | $356 | $289 | $252 | $1,429 | -6% |
| Monthly Heating Degree Days | % change from prev. winter | ||||||
| Nov | Dec | Jan | Feb | Mar | total | ||
| U.S. average | 479 | 714 | 791 | 644 | 525 | 3,153 | -3% |
| Monthly Expenditures | % change from prev. winter | ||||||
|---|---|---|---|---|---|---|---|
| Nov | Dec | Jan | Feb | Mar | total | ||
| Natural Gas | $115 | $154 | $152 | $131 | $119 | $671 | +3% |
| Electricity | $204 | $250 | $253 | $221 | $216 | $1,144 | +5% |
| Propane | $196 | $294 | $310 | $261 | $229 | $1,291 | -3% |
| Heating Oil | $249 | $320 | $352 | $285 | $247 | $1,453 | -4% |
| Monthly Heating Degree Days | % change from prev. winter | ||||||
| Nov | Dec | Jan | Feb | Mar | total | ||
| U.S. average | 469 | 765 | 791 | 644 | 525 | 3,194 | -1% |
| Monthly Expenditures | % change from prev. winter | ||||||
|---|---|---|---|---|---|---|---|
| Nov | Dec | Jan | Feb | Mar | total | ||
| Natural Gas | $116 | $153 | $152 | $131 | $118 | $670 | +3% |
| Electricity | $202 | $247 | $251 | $221 | $215 | $1,135 | +4% |
| Propane | $193 | $293 | $310 | $266 | $235 | $1,297 | -2% |
| Heating Oil | $250 | $348 | $344 | $280 | $246 | $1,467 | -3% |
| Monthly Heating Degree Days | % change from prev. winter | ||||||
| Nov | Dec | Jan | Feb | Mar | total | ||
| U.S. average | 461 | 752 | 785 | 644 | 525 | 3,166 | -2% |
| Monthly Expenditures | % change from prev. winter | ||||||
|---|---|---|---|---|---|---|---|
| Nov | Dec | Jan | Feb | Mar | total | ||
| Natural Gas | $116 | $152 | $163 | $138 | $119 | $688 | +6% |
| Electricity | $202 | $245 | $266 | $231 | $216 | $1,159 | +6% |
| Propane | $194 | $293 | $340 | $286 | $232 | $1,344 | +1% |
| Heating Oil | $250 | $366 | $410 | $350 | $274 | $1,650 | +9% |
| Monthly Heating Degree Days | % change from prev. winter | ||||||
| Nov | Dec | Jan | Feb | Mar | total | ||
| U.S. average | 463 | 748 | 879 | 710 | 528 | 3,327 | +3% |
| Monthly Expenditures | % change from prev. winter | ||||||
|---|---|---|---|---|---|---|---|
| Nov | Dec | Jan | Feb | Mar | total | ||
| Natural Gas | $115 | $156 | $169 | $134 | $121 | $696 | +7% |
| Electricity | $202 | $248 | $267 | $224 | $217 | $1,157 | +6% |
| Propane | $194 | $293 | $338 | $267 | $243 | $1,334 | +1% |
| Heating Oil | $250 | $366 | $392 | $362 | $378 | $1,749 | +15% |
| Monthly Heating Degree Days | % change from prev. winter | ||||||
| Nov | Dec | Jan | Feb | Mar | total | ||
| U.S. average | 463 | 748 | 872 | 657 | 533 | 3,273 | +1% |
| Monthly Expenditures | % change from prev. winter | ||||||
|---|---|---|---|---|---|---|---|
| Nov | Dec | Jan | Feb | Mar | total | ||
| Natural Gas | $116 | $156 | $173 | $137 | $104 | $686 | +6% |
| Electricity | $202 | $248 | $275 | $225 | $197 | $1,146 | +5% |
| Propane | $194 | $292 | $338 | $264 | $197 | $1,286 | -3% |
| Heating Oil | $250 | $365 | $393 | $382 | $358 | $1,749 | +15% |
| Monthly Heating Degree Days | % change from prev. winter | ||||||
| Nov | Dec | Jan | Feb | Mar | total | ||
| U.S. average | 464 | 748 | 875 | 650 | 404 | 3,140 | -3% |
Note: Propane expenditures are a household-weighted average of the Northeast, Midwest, and South regions.
Progress Tracker

What is the Winter Fuels Outlook?
The Winter Fuels Outlook provides EIA's expectations for U.S. residential energy consumption, prices, and expenditures for the upcoming winter as well as analysis of market conditions for the four most common U.S. residential space heating fuels: natural gas, electricity, propane, and heating oil.
The average household expenditures discussed in this supplement are best interpreted as a broad guide to compare the upcoming winter with the previous winter. Differences in the housing populations complicate direct comparisons across fuels, and readers should not assume that switching to another fuel with lower energy expenditures–as presented in this report–would necessarily result in lower expenditures for their household.
We forecast average residential consumption, price, and household expenditures for the United States and, depending on the fuel, for up to four U.S. Census Bureau regions: the Northeast, Midwest, South, and West. Because these forecasts are sensitive to weather conditions, we provide two side cases that vary weather assumptions from those in our base case.
We will update these forecasts throughout the winter concurrently with our Short-Term Energy Outlook releases. We will also provide visualizations that track forecast adjustments through the winter.
The data values and analysis below were published on October 15, 2025, and were based on price and weather forecasts from the October 2025 edition of the Short-Term Energy Outlook published on October 7, 2025.
Forecast summary
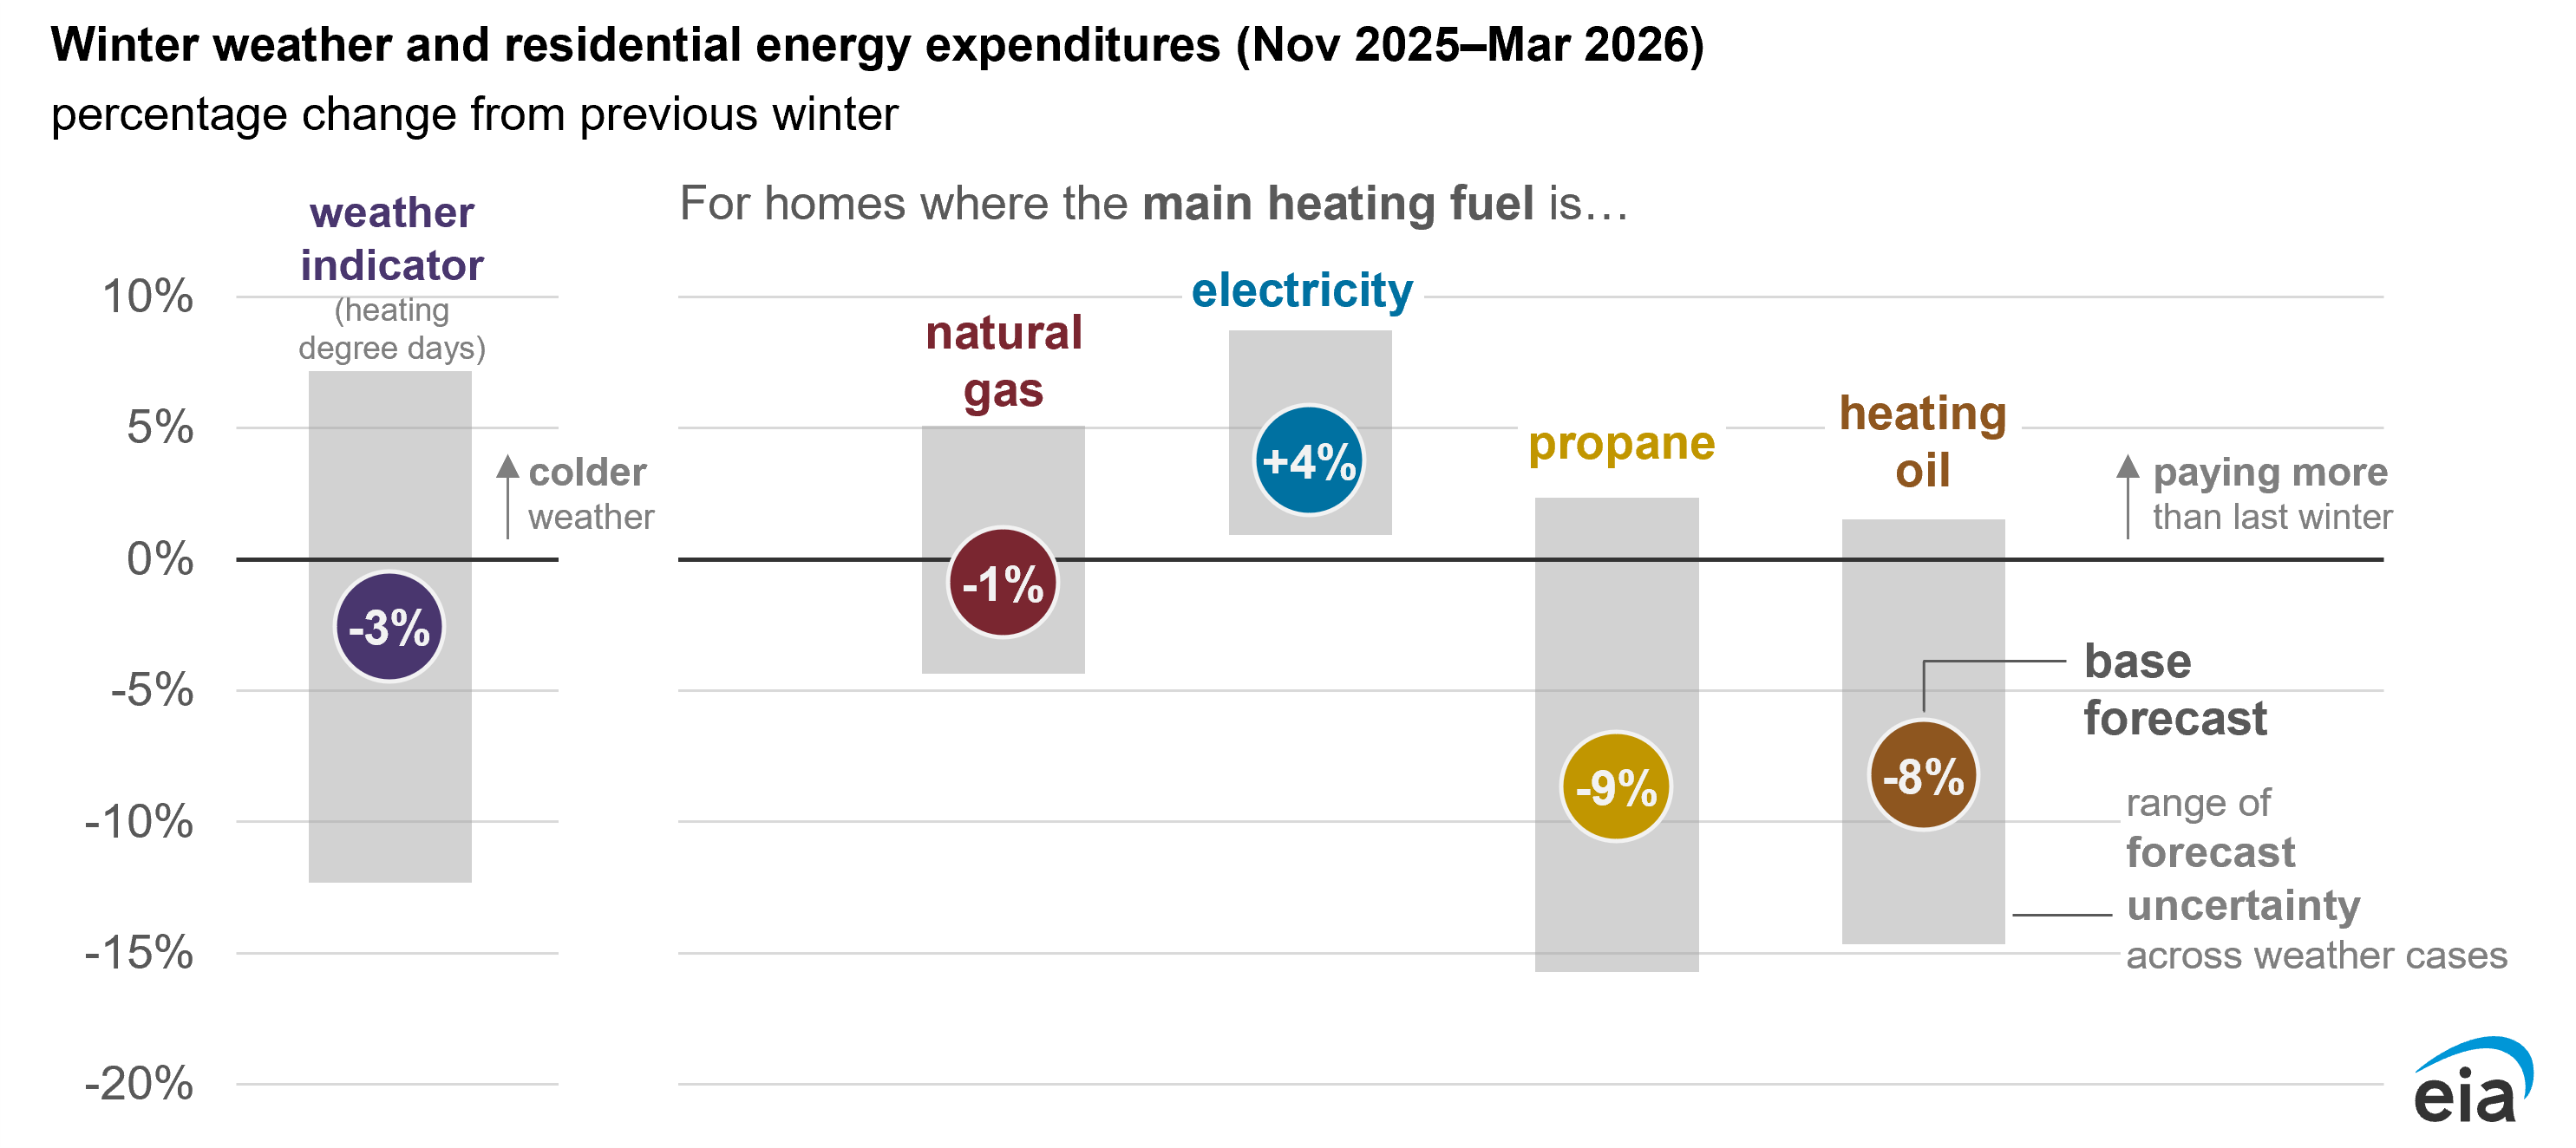
We expect winter temperatures and therefore residential energy consumption will broadly be similar to last winter, so much of the change in expected expenditures is driven by energy prices. Residential sector retail prices for electricity are higher than last winter across the country, natural gas prices are generally similar to last winter, and propane and heating oil are lower.
We expect that U.S. households heating with natural gas will spend about the same amount on natural gas this winter as they did last winter. Households heating with electricity will spend more, and households heating with propane or heating oil will spend less than they did last winter. These outcomes are different in our cases that assume colder or milder winter weather, except in the case of electricity, where we expect households to pay more than they did last winter across our range of weather assumptions.
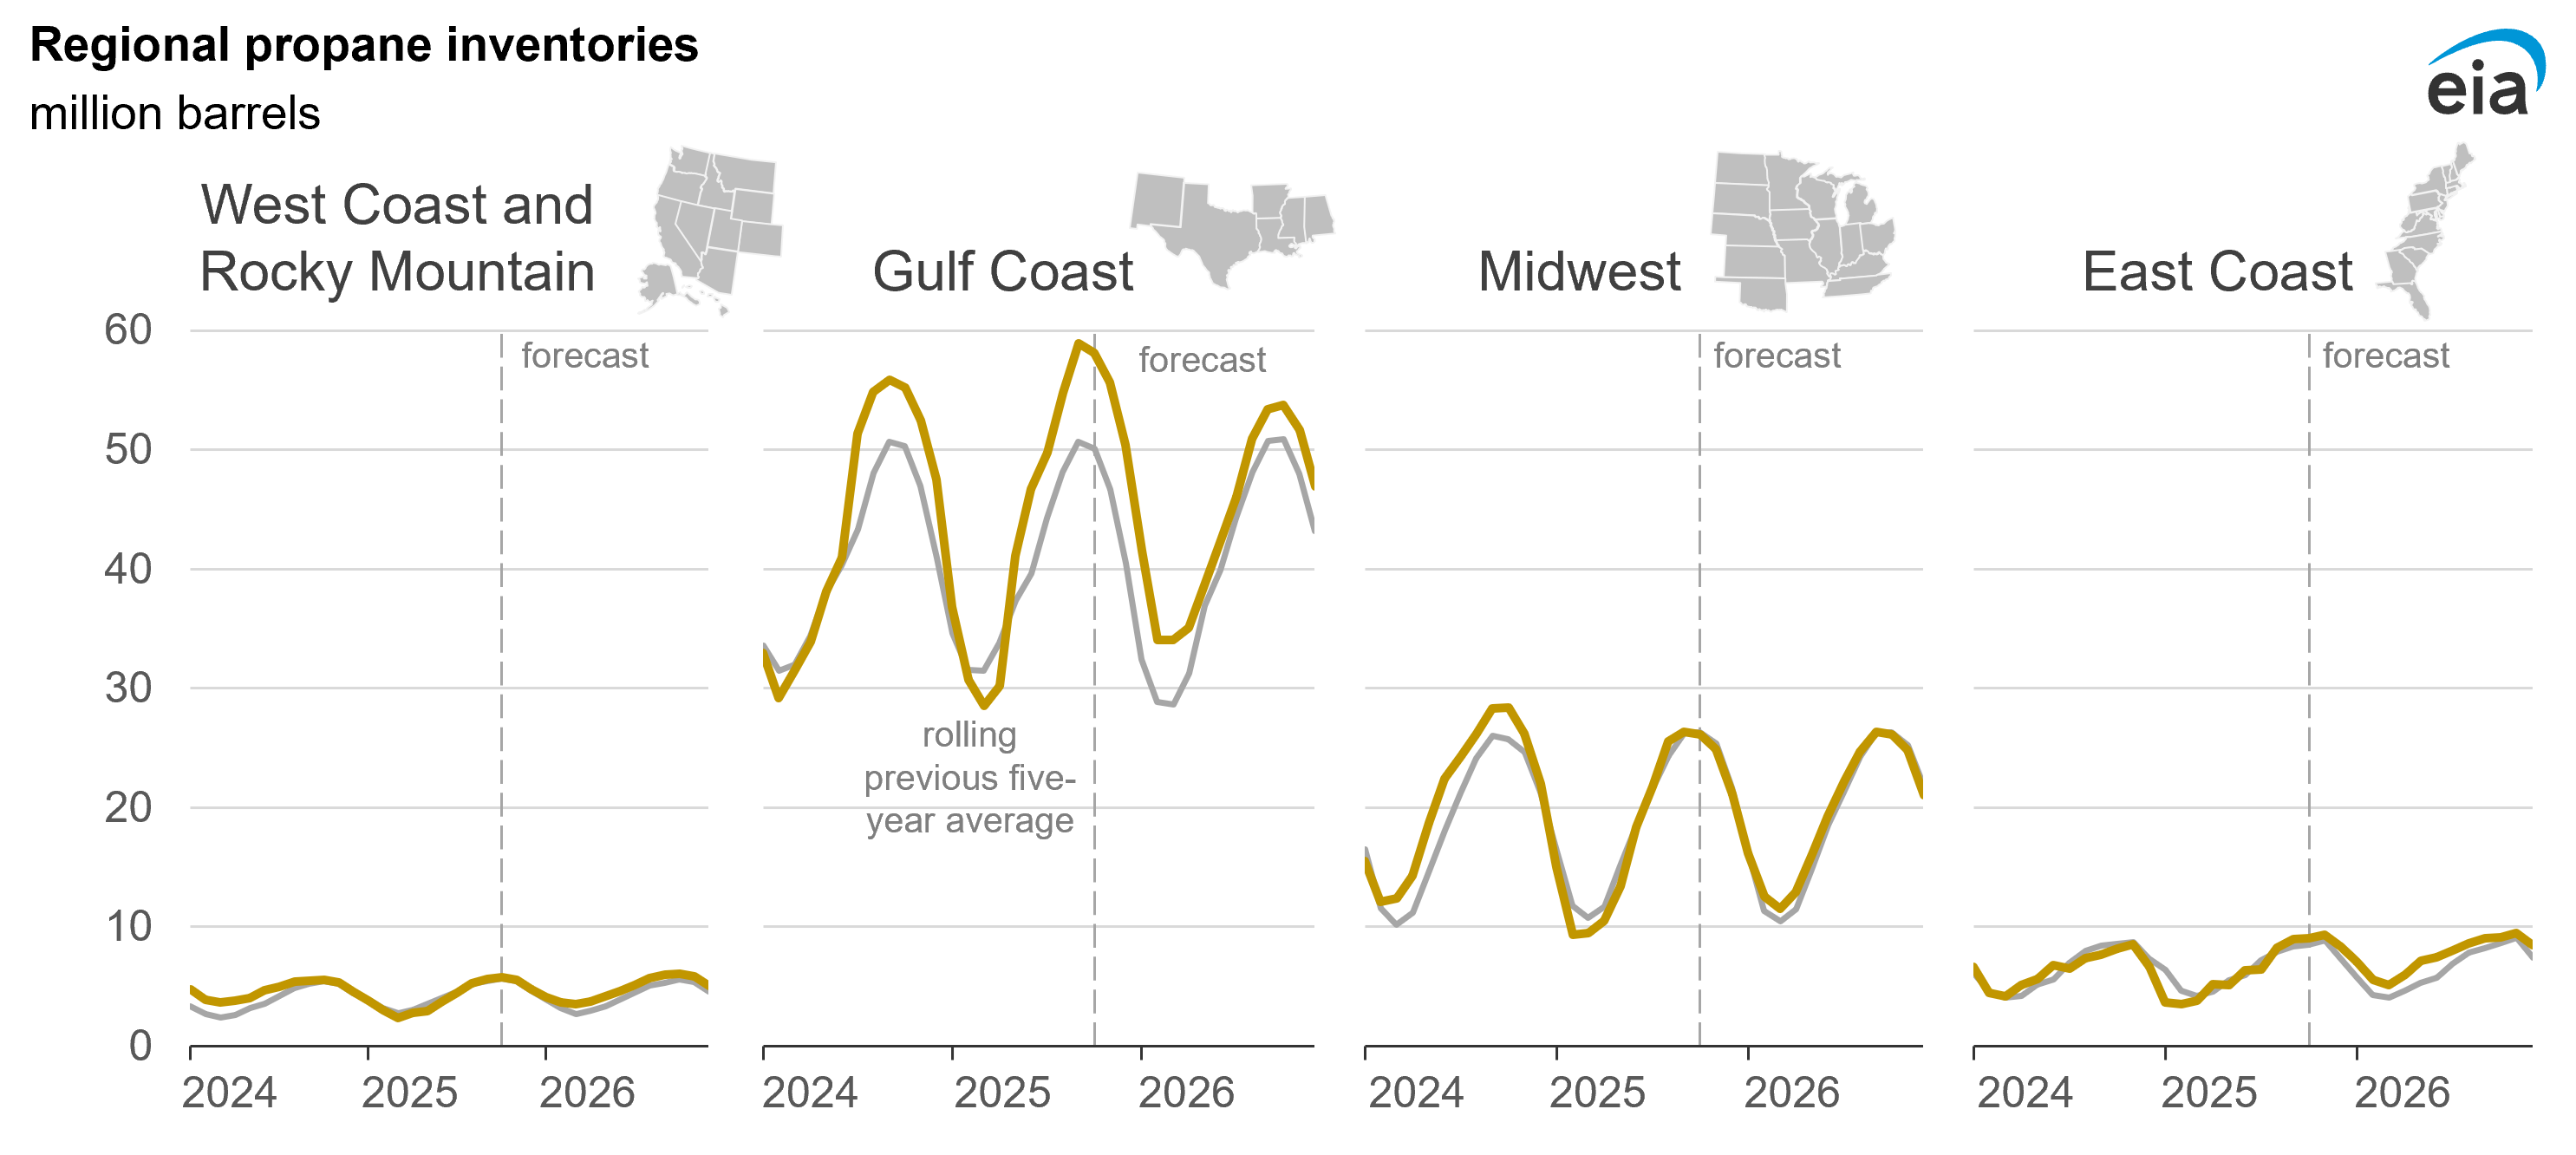
Fuel inventories are an important source of winter supply. More natural gas and propane are currently stored in U.S. inventories compared with their previous five-year (2020–2024) average going into this winter. These relatively high inventories have helped keep prices for those fuels below year-ago levels. However, distillate fuel inventories, a category which includes heating oil, are slightly below their five-year average. We expect heating oil prices to be lower than last year, however, because of our lower crude oil price forecast.
| Base case |
% change |
10% colder |
% change |
10% warmer |
% change |
|
|---|---|---|---|---|---|---|
| Northeast | $868 | -1% | $931 | +6% | $828 | -6% |
| Midwest | $613 | +2% | $645 | +7% | $597 | -1% |
| South | $514 | -5% | $536 | -1% | $504 | -7% |
| West | $600 | -2% | $644 | +5% | $571 | -7% |
| United States | $642 | -1% | $681 | +5% | $620 | -4% |
| Base case |
% change |
10% colder |
% change |
10% warmer |
% change |
|
|---|---|---|---|---|---|---|
| Northeast | $1,519 | +3% | $1,589 | +8% | $1,468 | 0% |
| Midwest | $1,283 | +4% | $1,345 | +9% | $1,240 | 0% |
| South | $1,031 | +4% | $1,068 | +8% | $1,006 | +1% |
| West | $1,117 | +3% | $1,162 | +7% | $1,085 | 0% |
| United States | $1,133 | +4% | $1,177 | +8% | $1,102 | +1% |
| Base case |
% change |
10% colder |
% change |
10% warmer |
% change |
|
|---|---|---|---|---|---|---|
| Northeast | $1,667 | -11% | $1,847 | -2% | $1,547 | -18% |
| Midwest | $1,267 | -8% | $1,455 | +6% | $1,158 | -16% |
| South | $1,101 | -9% | $1,202 | -1% | $1,031 | -15% |
| United States | $1,210 | -9% | $1,355 | +2% | $1,116 | -16% |
| Base case |
% change |
10% colder |
% change |
10% warmer |
% change |
|
|---|---|---|---|---|---|---|
| United States | $1,390 | -8% | $1,539 | +2% | $1,293 | -15% |
Note: Percentage change values are relative to previous winter. Propane expenditures are a household-weighted average of the Northeast, Midwest, and South regions.
Weather assumptions
We assume this winter will be slightly milder than the last winter across much of the country, especially in the Northeast.
Weather can affect household heating expenses in two ways. First, cold weather raises the amount of energy required to keep a house at a specific temperature. Second, because cold weather raises aggregate demand and can disrupt supply, it can cause energy prices to rise. These price increases can be more severe if fuel inventories are relatively low. In the cases we consider, we adjust for both effects.
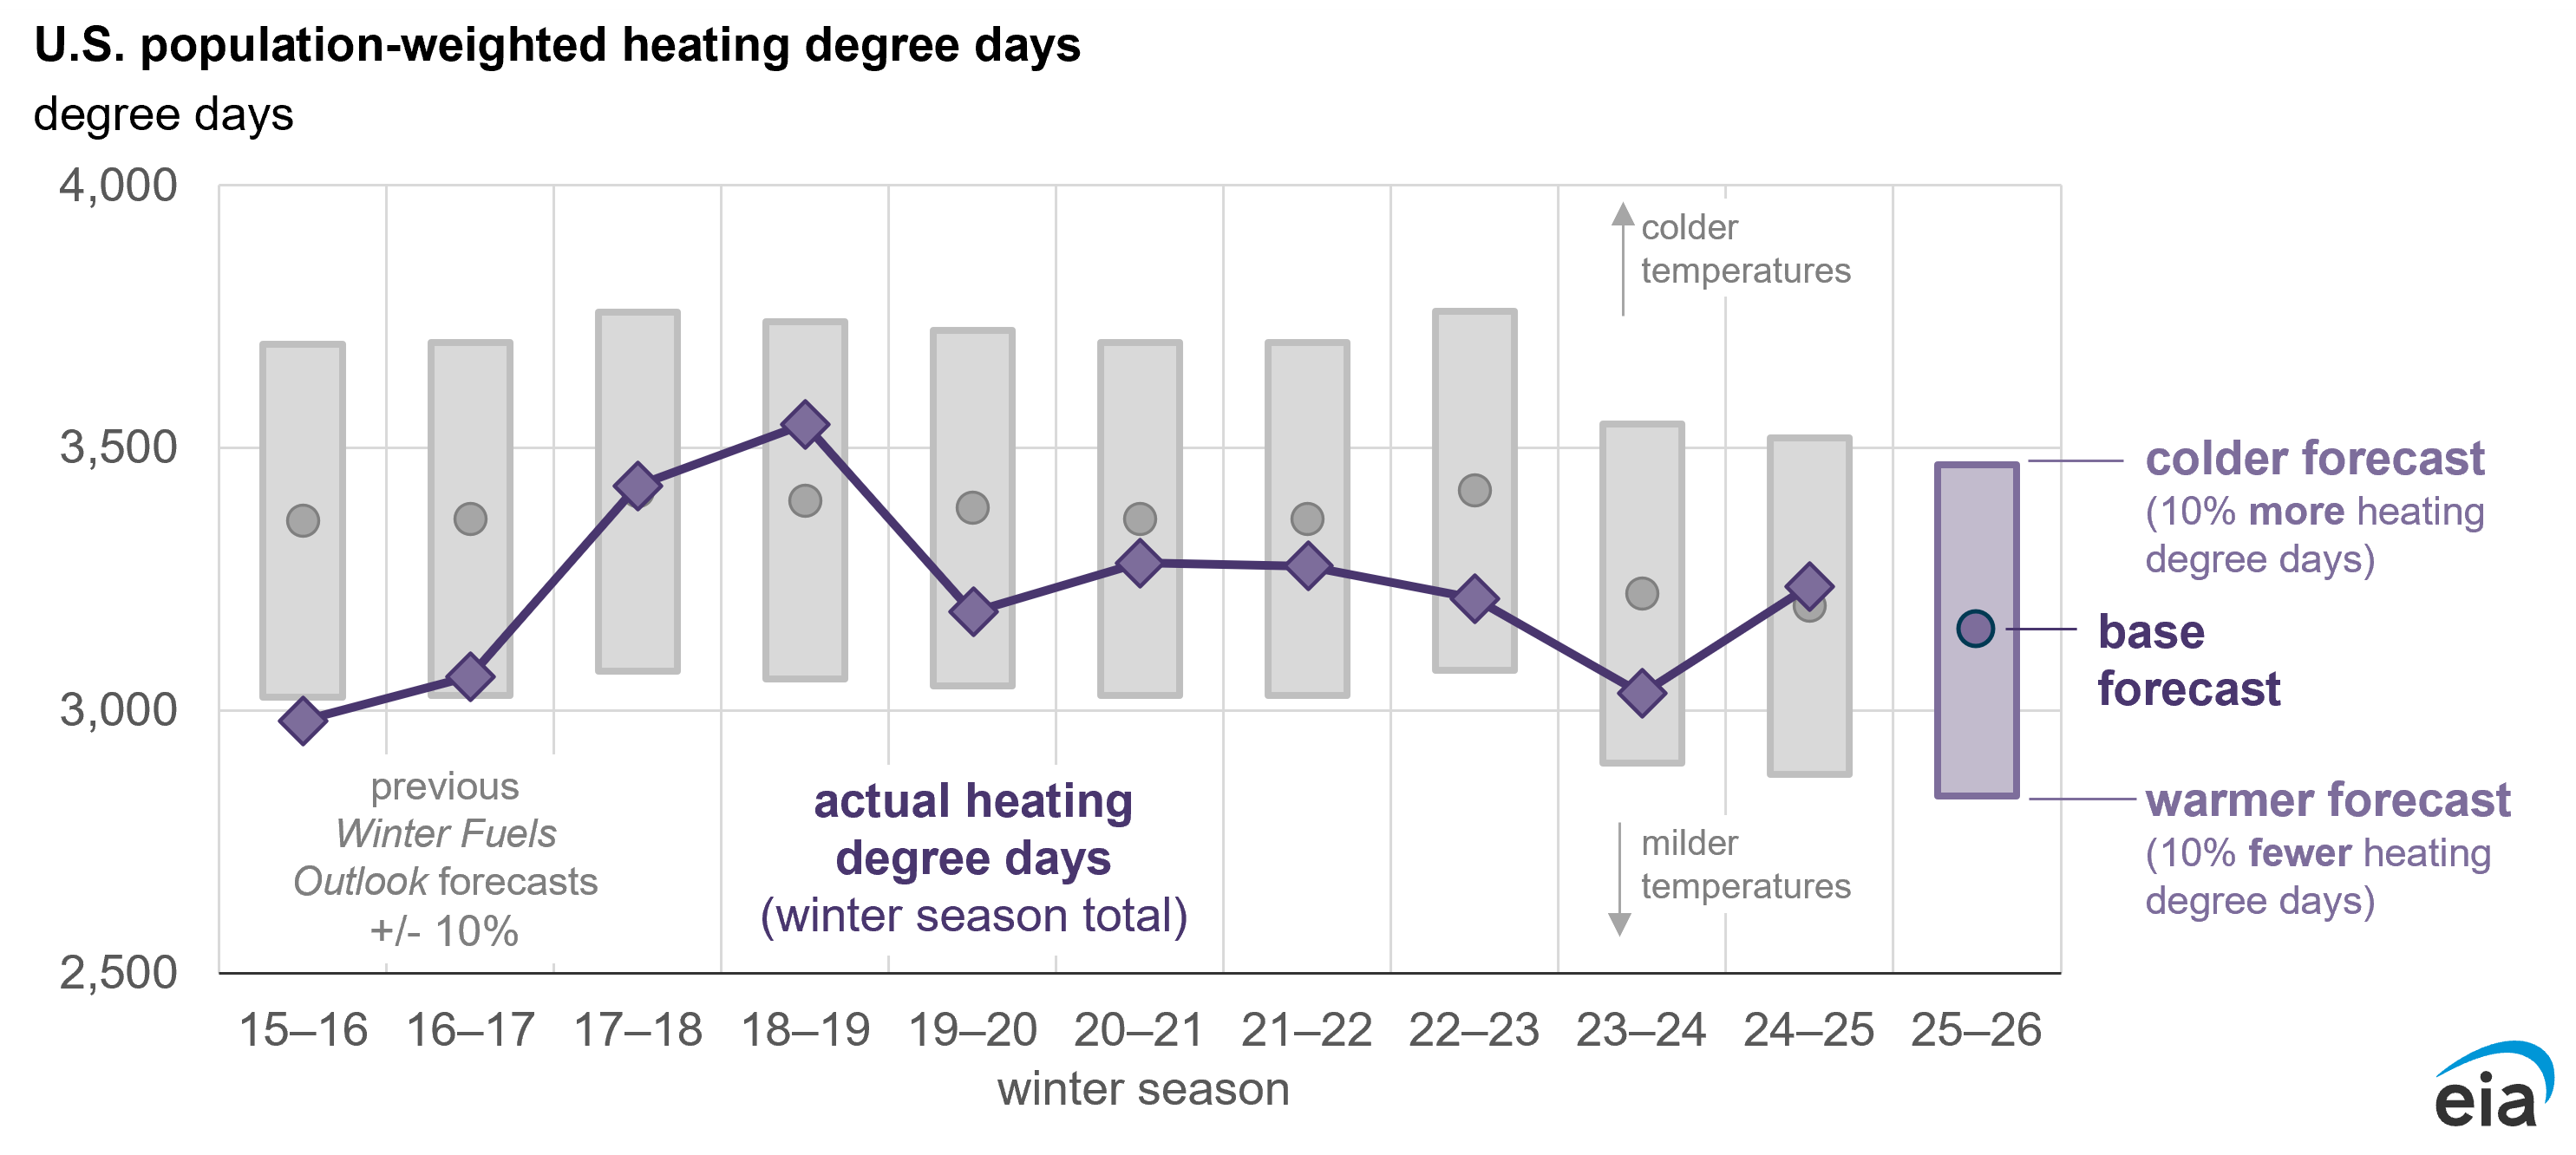
In the Winter Fuels Outlook, we use the previous 30-year trend to inform our expectations for weather. We measure winter weather effects using heating degree days (HDDs), which are an aggregate measure of how daily average temperatures deviate from a base temperature of 65°F.
For example, an average daily temperature of 50°F results in 15 HDDs (65 minus 50 equals 15). A 30-day month of those 50°F days would result in 450 HDDs for the month (15 times 30 equals 450). Heating degree days are population-weighted so that areas with larger populations are given more weight than less-populous areas when averaging within a geographic region.
In our outlook, we expect 5% fewer HDDs in the Northeast this winter, 3% fewer in the South, and 1% fewer in both the Midwest and West.
Because weather is a significant source of uncertainty in these forecasts, the Winter Fuels Outlook includes two side cases where, measured in HDDs, all regions are either 10% colder or 10% warmer than the base forecast. Of the previous 10 winters, 9 winters have fallen within that 10% warmer or 10% colder range, relative to the forecasts we publish at this time of year (October).
Data values: U.S. Regional Weather Data
| Nov | Dec | Jan | Feb | Mar | Total | % change |
|
|---|---|---|---|---|---|---|---|
| Northeast | 629 | 910 | 1,062 | 906 | 788 | 4,296 | -5% |
| Midwest | 722 | 1,057 | 1,204 | 991 | 801 | 4,776 | -1% |
| South | 295 | 477 | 542 | 409 | 296 | 2,019 | -3% |
| West | 467 | 671 | 653 | 545 | 480 | 2,816 | -1% |
| United States | 479 | 714 | 791 | 644 | 525 | 3,153 | -3% |
Note: Percentage change value is relative to previous winter.
Household characteristics
The estimates discussed here are broad measures for comparing recent winters. Energy consumption and expenditures depend on the size and energy efficiency of individual homes, their heating equipment and operating conditions, and weather. A key determinant of expenditures is the primary heating fuel, each of which has a unique geographic distribution across the United States.
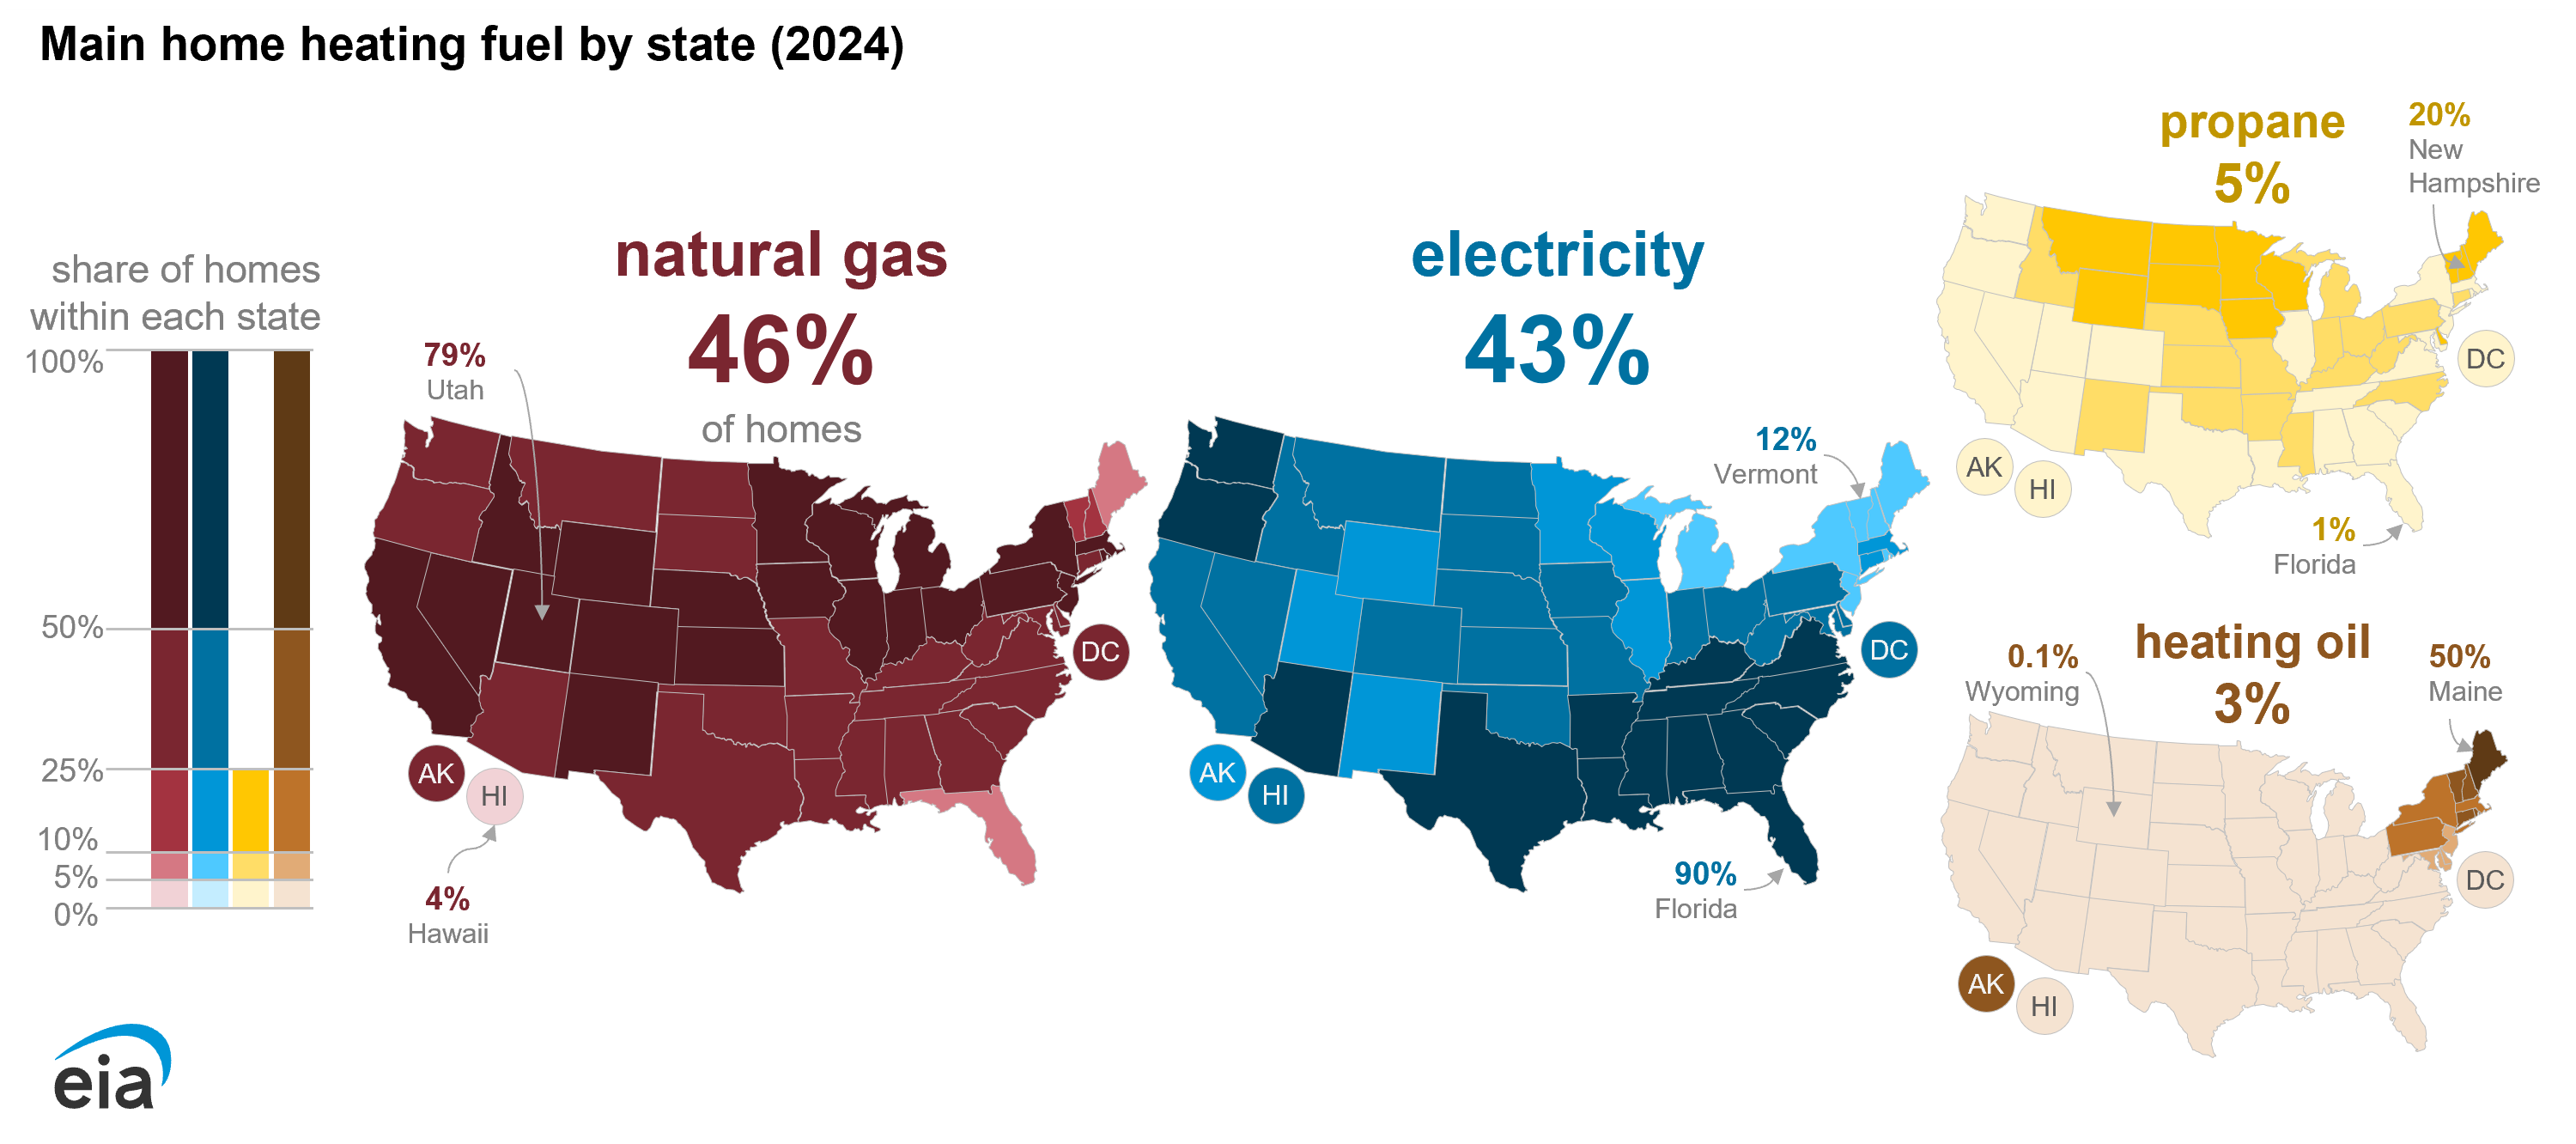
Natural gas is the main space heating fuel in 46% of U.S. homes, making it the most widely used residential heating fuel in the country. Electricity is also widely used for heating, especially in the South.
Propane and heating oil are the primary space heating fuels in a much smaller share of homes nationally but are used widely in regions that tend to have some of the coldest winters. Heating with propane is more common in the upper Midwest and Northeast. Heating oil is used for residential heating mostly in the Northeast.
| 2019 | 2020 | 2021 | 2022 | 2023 | 2024 | % change |
|
|---|---|---|---|---|---|---|---|
| Northeast | 11,958 | 11,874 | 11,841 | 12,093 | 12,363 | 12,430 | +1% |
| Midwest | 18,009 | 17,838 | 17,795 | 18,047 | 18,120 | 18,019 | -1% |
| South | 14,256 | 14,289 | 14,390 | 14,792 | 14,969 | 14,922 | 0% |
| West | 15,368 | 15,117 | 15,288 | 15,584 | 15,623 | 15,546 | 0% |
| United States | 59,592 | 59,118 | 59,315 | 60,516 | 61,075 | 60,917 | 0% |
| 2019 | 2020 | 2021 | 2022 | 2023 | 2024 | % change |
|
|---|---|---|---|---|---|---|---|
| Northeast | 3,681 | 3,914 | 4,105 | 4,277 | 4,335 | 4,434 | +2% |
| Midwest | 6,199 | 6,411 | 6,551 | 6,643 | 6,820 | 7,057 | +3% |
| South | 31,681 | 32,510 | 33,043 | 33,458 | 33,972 | 34,488 | +2% |
| West | 10,113 | 10,487 | 10,555 | 10,687 | 10,873 | 11,069 | +2% |
| United States | 51,674 | 53,322 | 54,254 | 55,066 | 55,999 | 57,046 | +2% |
| 2019 | 2020 | 2021 | 2022 | 2023 | 2024 | % change |
|
|---|---|---|---|---|---|---|---|
| Northeast | 1,118 | 1,217 | 1,249 | 1,216 | 1,215 | 1,268 | +4% |
| Midwest | 2,175 | 2,225 | 2,267 | 2,196 | 2,158 | 2,183 | +1% |
| South | 1,911 | 1,895 | 1,949 | 1,878 | 1,869 | 1,915 | +2% |
| West | 1,029 | 1,059 | 1,084 | 998 | 959 | 982 | +2% |
| United States | 6,233 | 6,397 | 6,548 | 6,288 | 6,201 | 6,348 | +2% |
| 2019 | 2020 | 2021 | 2022 | 2023 | 2024 | % change |
|
|---|---|---|---|---|---|---|---|
| Northeast | 4,449 | 4,135 | 4,007 | 3,847 | 3,704 | 3,564 | -4% |
| Midwest | 257 | 229 | 216 | 205 | 194 | 184 | -5% |
| South | 558 | 491 | 462 | 436 | 438 | 434 | -1% |
| West | 207 | 193 | 191 | 185 | 175 | 168 | -4% |
| United States | 5,471 | 5,049 | 4,875 | 4,673 | 4,511 | 4,350 | -4% |
| 2019 | 2020 | 2021 | 2022 | 2023 | 2024 | % change |
|
|---|---|---|---|---|---|---|---|
| Northeast | 423 | 378 | 390 | 393 | 379 | 365 | -4% |
| Midwest | 470 | 415 | 418 | 404 | 400 | 401 | 0% |
| South | 432 | 377 | 375 | 365 | 361 | 355 | -2% |
| West | 628 | 576 | 568 | 554 | 564 | 564 | 0% |
| United States | 1,953 | 1,745 | 1,752 | 1,716 | 1,704 | 1,684 | -1% |
| 2019 | 2020 | 2021 | 2022 | 2023 | 2024 | % change |
|
|---|---|---|---|---|---|---|---|
| Northeast | 517 | 553 | 550 | 519 | 555 | 616 | +11% |
| Midwest | 372 | 383 | 382 | 351 | 370 | 405 | +9% |
| South | 590 | 697 | 766 | 771 | 767 | 824 | +7% |
| West | 1,087 | 1,125 | 1,140 | 1,148 | 1,257 | 1,368 | +9% |
| United States | 2,566 | 2,758 | 2,838 | 2,790 | 2,948 | 3,212 | +9% |
Note: Percentage change value is relative to previous winter.
Energy expenditures
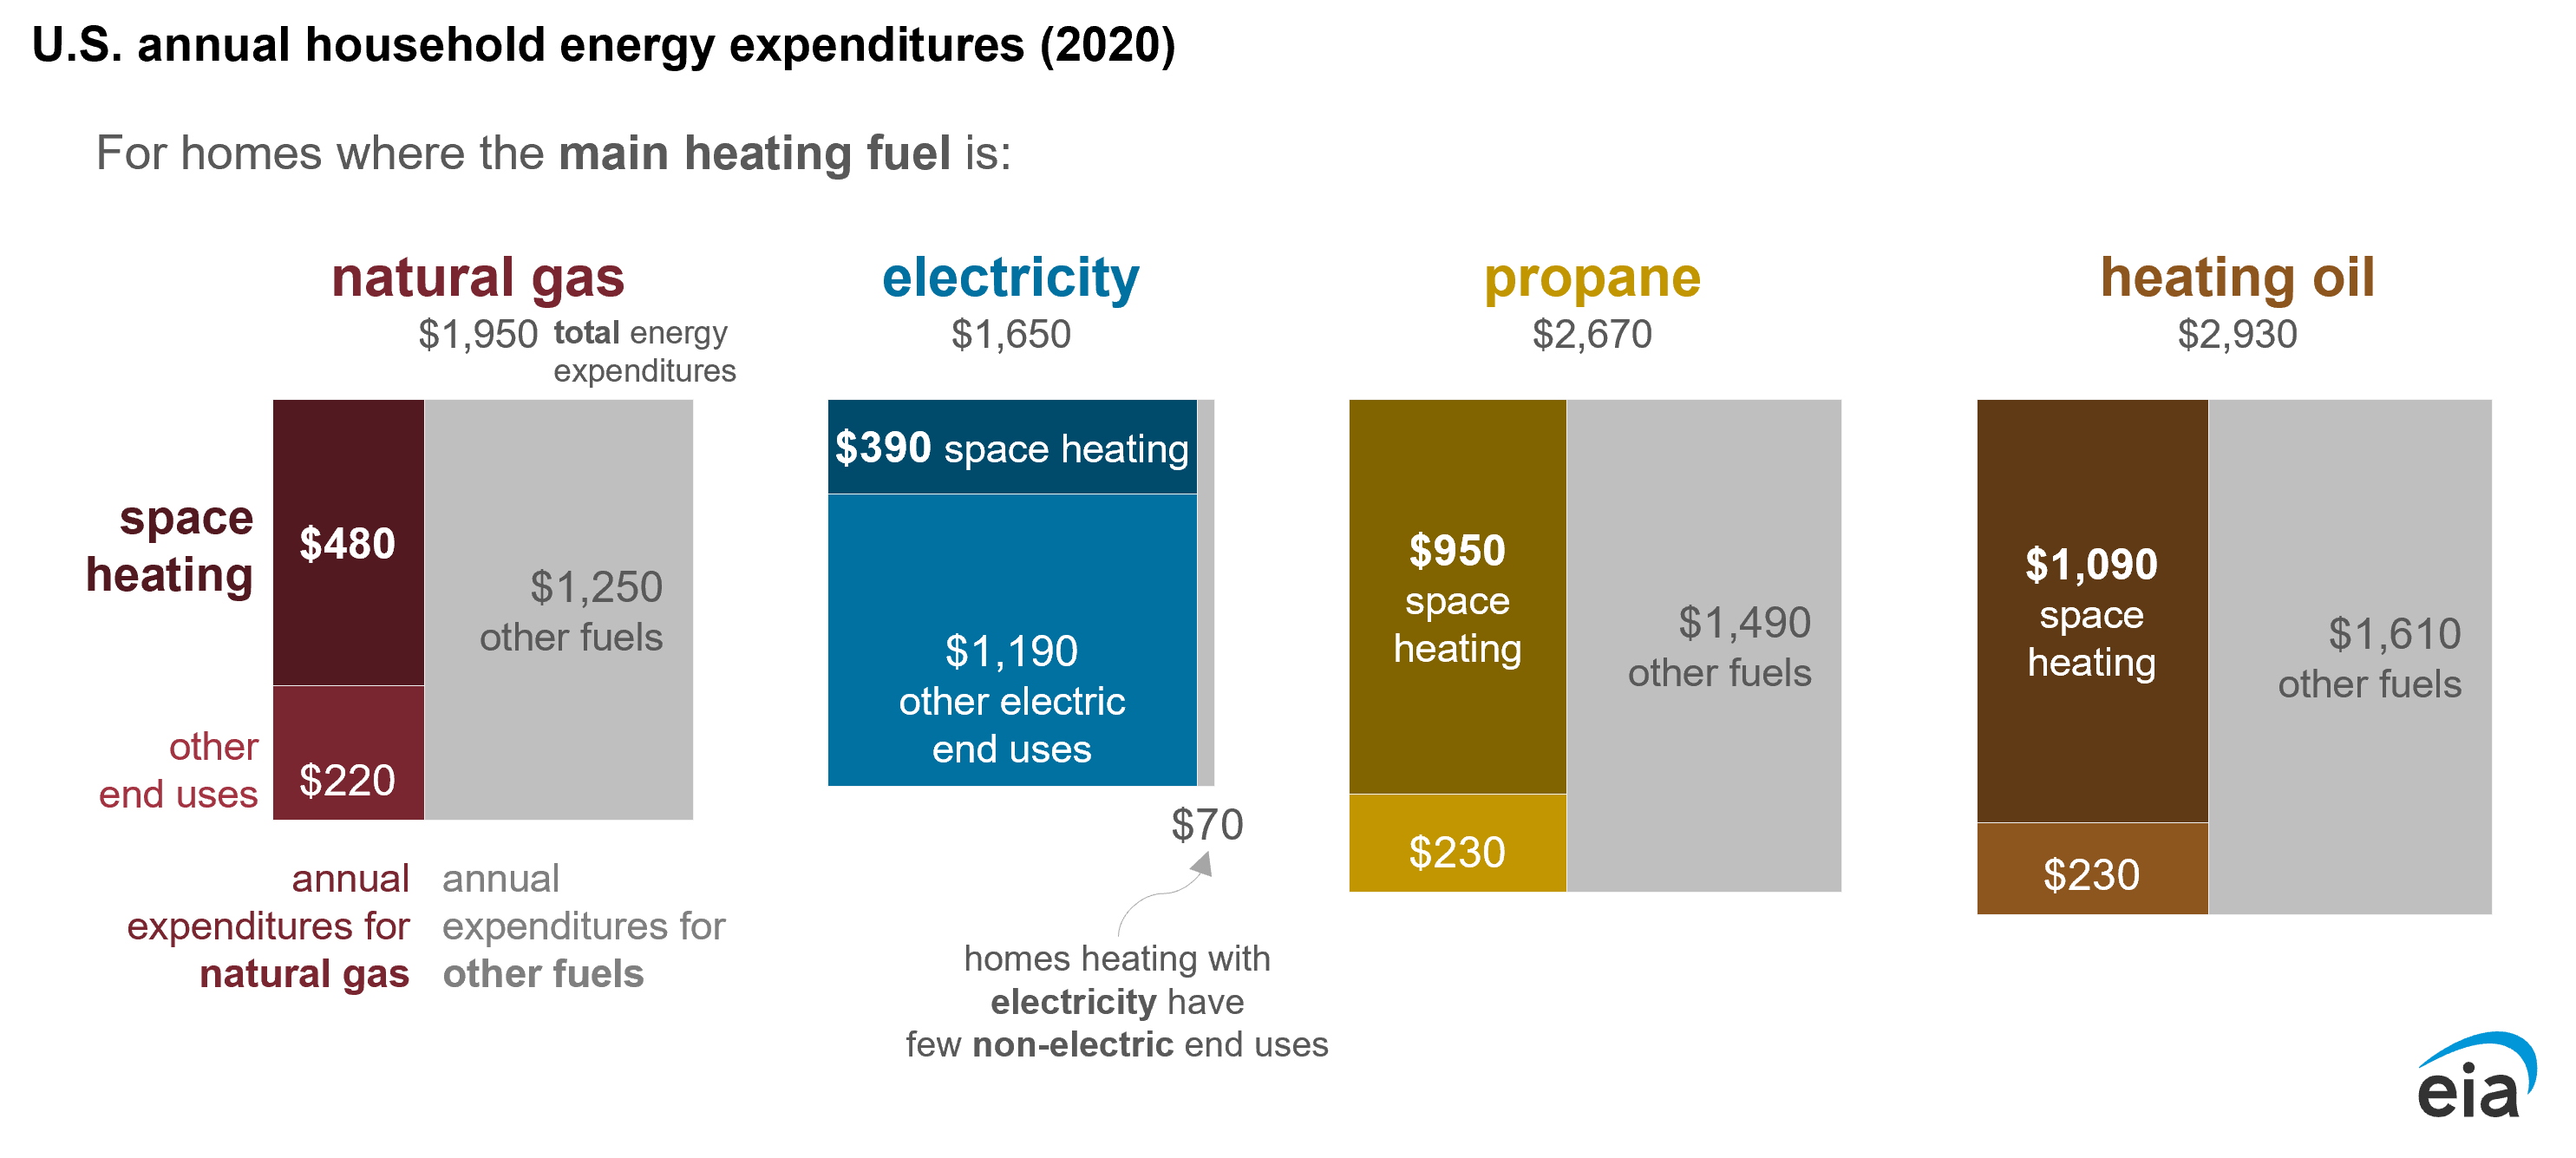
The consumption and expenditure forecasts in the Winter Fuels Outlook apply to a home's main space heating fuel. For most households, the main space heating fuel is also used for other purposes. Households primarily heating with natural gas equipment, for example, may also use natural gas for water heating, cooking, or clothes drying.
The consumption and expenditure forecasts in this report are further categorized into space heating and other purposes. In households heating with natural gas, propane, and heating oil, space heating accounts for most of the winter-season energy consumption and expenditures across the country. In homes heating with electricity, however, space heating represents a smaller portion of total consumption, especially in regions with relatively mild winters such as the South.
| Expenditures (dollars) | % change | ||||||
|---|---|---|---|---|---|---|---|
| Nov | Dec | Jan | Feb | Mar | Total | ||
| Northeast | 148 | 182 | 204 | 174 | 161 | 868 | -1% |
| Midwest | 105 | 134 | 138 | 126 | 110 | 613 | +2% |
| South | 93 | 117 | 121 | 97 | 86 | 514 | -5% |
| West | 105 | 138 | 134 | 115 | 108 | 600 | -2% |
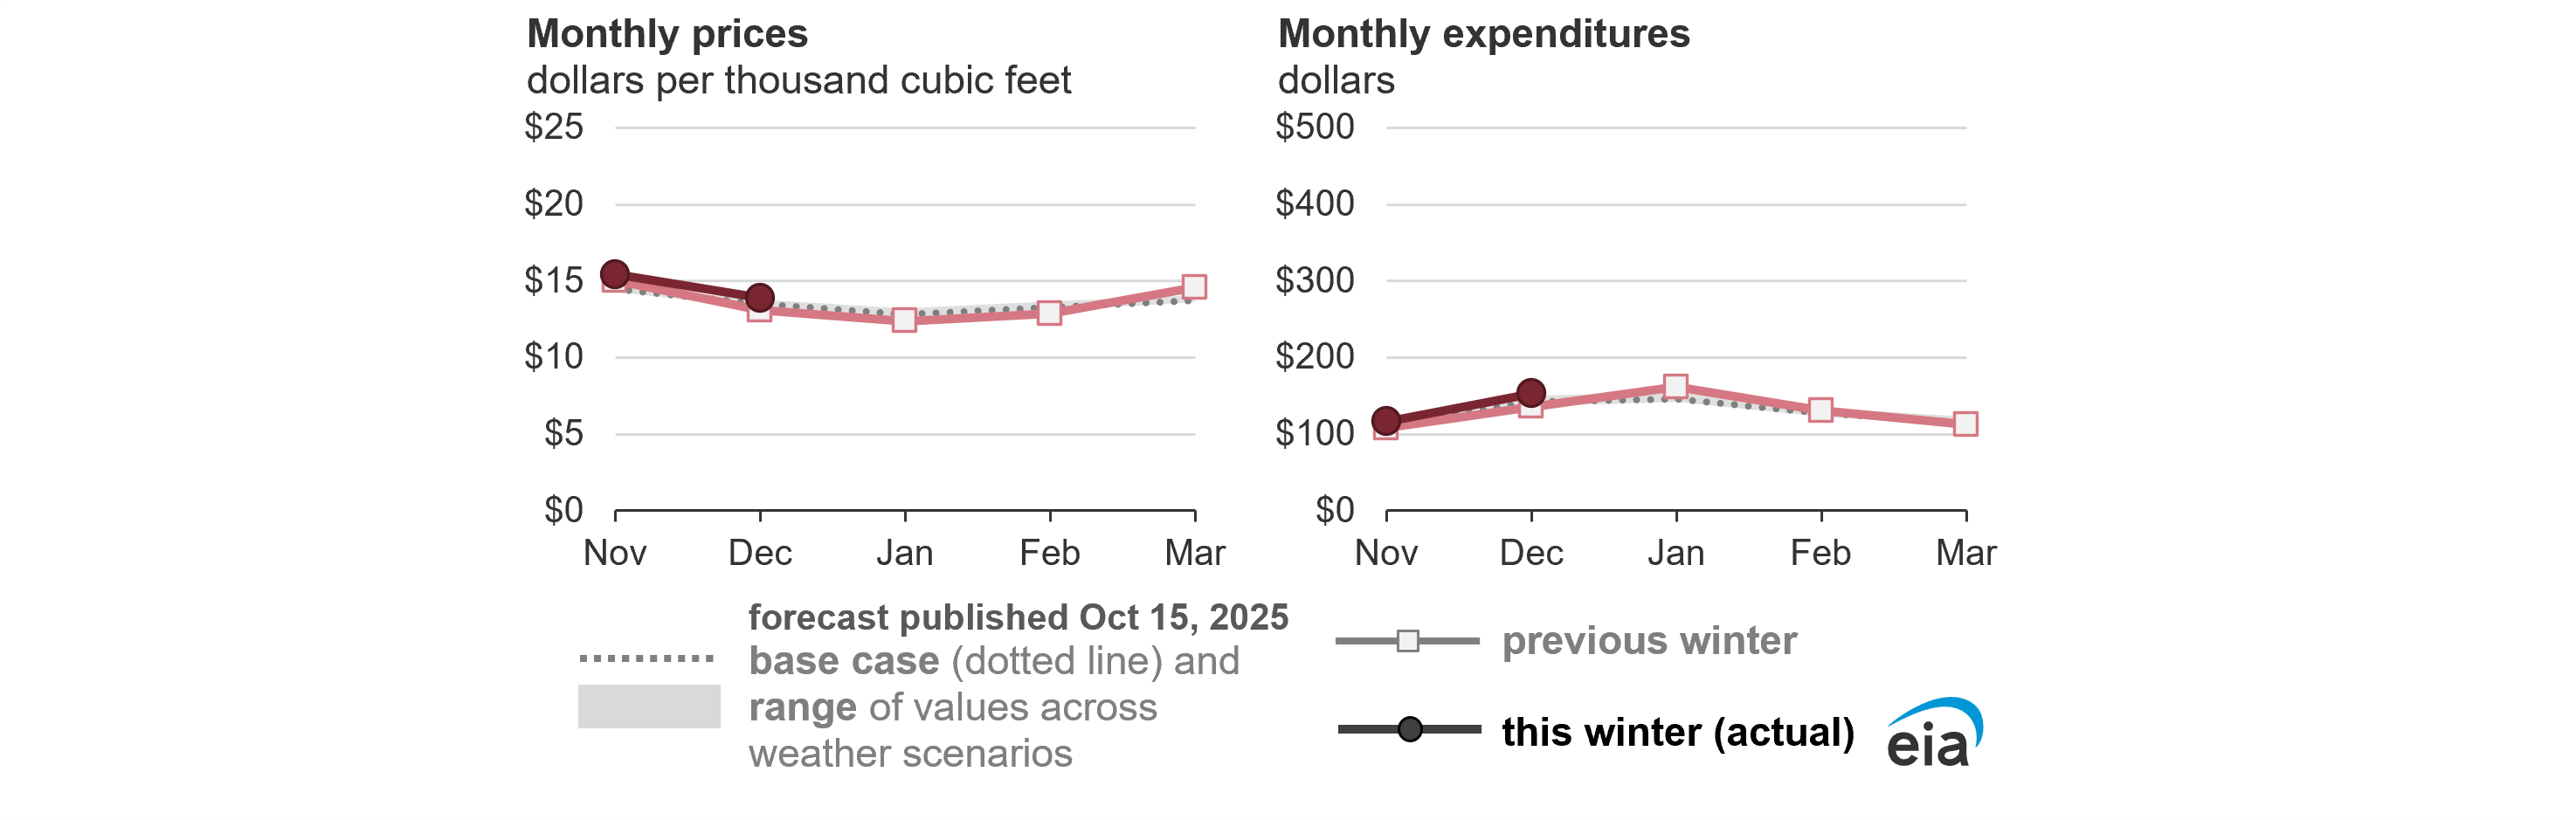
| U.S. average | 112 | 142 | 146 | 127 | 115 | 642 | -1% |
| Price (dollars per thousand cubic feet) | % change | ||||||
| Nov | Dec | Jan | Feb | Mar | Total | ||
| Northeast | 17.44 | 15.95 | 15.71 | 15.57 | 15.79 | 16.02 | +3% |
| Midwest | 11.33 | 10.42 | 9.60 | 10.47 | 10.75 | 10.43 | +3% |
| South | 16.15 | 14.13 | 13.16 | 13.56 | 14.86 | 14.21 | -3% |
| West | 15.24 | 15.26 | 15.17 | 15.19 | 15.31 | 15.23 | -1% |
| U.S. average | 14.50 | 13.50 | 12.81 | 13.29 | 13.74 | 13.50 | +1% |
| Consumption (million cubic feet) | % change | ||||||
| Nov | Dec | Jan | Feb | Mar | Total | ||
| Northeast | 8 | 11 | 13 | 11 | 10 | 54 | -4% |
| Midwest | 9 | 13 | 14 | 12 | 10 | 59 | -1% |
| South | 6 | 8 | 9 | 7 | 6 | 36 | -2% |
| West | 7 | 9 | 9 | 8 | 7 | 39 | -1% |
| U.S. average | 8 | 11 | 11 | 10 | 8 | 48 | -2% |
| Expenditures (dollars) | % change | ||||||
|---|---|---|---|---|---|---|---|
| Nov | Dec | Jan | Feb | Mar | Total | ||
| Northeast | 263 | 311 | 342 | 307 | 296 | 1,519 | +3% |
| Midwest | 231 | 268 | 289 | 251 | 244 | 1,283 | +4% |
| South | 187 | 220 | 233 | 199 | 192 | 1,031 | +4% |
| West | 214 | 241 | 238 | 209 | 215 | 1,117 | +3% |
| U.S. average | 206 | 240 | 252 | 219 | 215 | 1,133 | +4% |
| Price (cents per kilowatthour) | % change | ||||||
| Nov | Dec | Jan | Feb | Mar | Total | ||
| Northeast | 24.48 | 23.95 | 24.24 | 24.85 | 24.49 | 24.39 | +6% |
| Midwest | 16.42 | 15.34 | 15.32 | 15.58 | 16.22 | 15.73 | +4% |
| South | 15.47 | 14.77 | 14.68 | 15.10 | 15.54 | 15.07 | +5% |
| West | 20.48 | 19.47 | 19.44 | 19.63 | 19.95 | 19.77 | +3% |
| U.S. average | 17.73 | 16.93 | 16.91 | 17.31 | 17.69 | 17.28 | +5% |
| Consumption (kilowatthours) | % change | ||||||
| Nov | Dec | Jan | Feb | Mar | Total | ||
| Northeast | 1,073 | 1,299 | 1,409 | 1,234 | 1,210 | 6,226 | -2% |
| Midwest | 1,407 | 1,750 | 1,887 | 1,612 | 1,501 | 8,157 | -1% |
| South | 1,206 | 1,492 | 1,587 | 1,320 | 1,236 | 6,842 | -1% |
| West | 1,047 | 1,238 | 1,223 | 1,067 | 1,078 | 5,652 | 0% |
| U.S. average | 1,162 | 1,419 | 1,491 | 1,268 | 1,214 | 6,554 | -1% |
| Expenditures (dollars) | % change | ||||||
|---|---|---|---|---|---|---|---|
| Nov | Dec | Jan | Feb | Mar | Total | ||
| Northeast | 249 | 342 | 397 | 351 | 328 | 1,667 | -11% |
| Midwest | 185 | 270 | 312 | 268 | 232 | 1,267 | -8% |
| South | 166 | 243 | 276 | 225 | 191 | 1,101 | -9% |
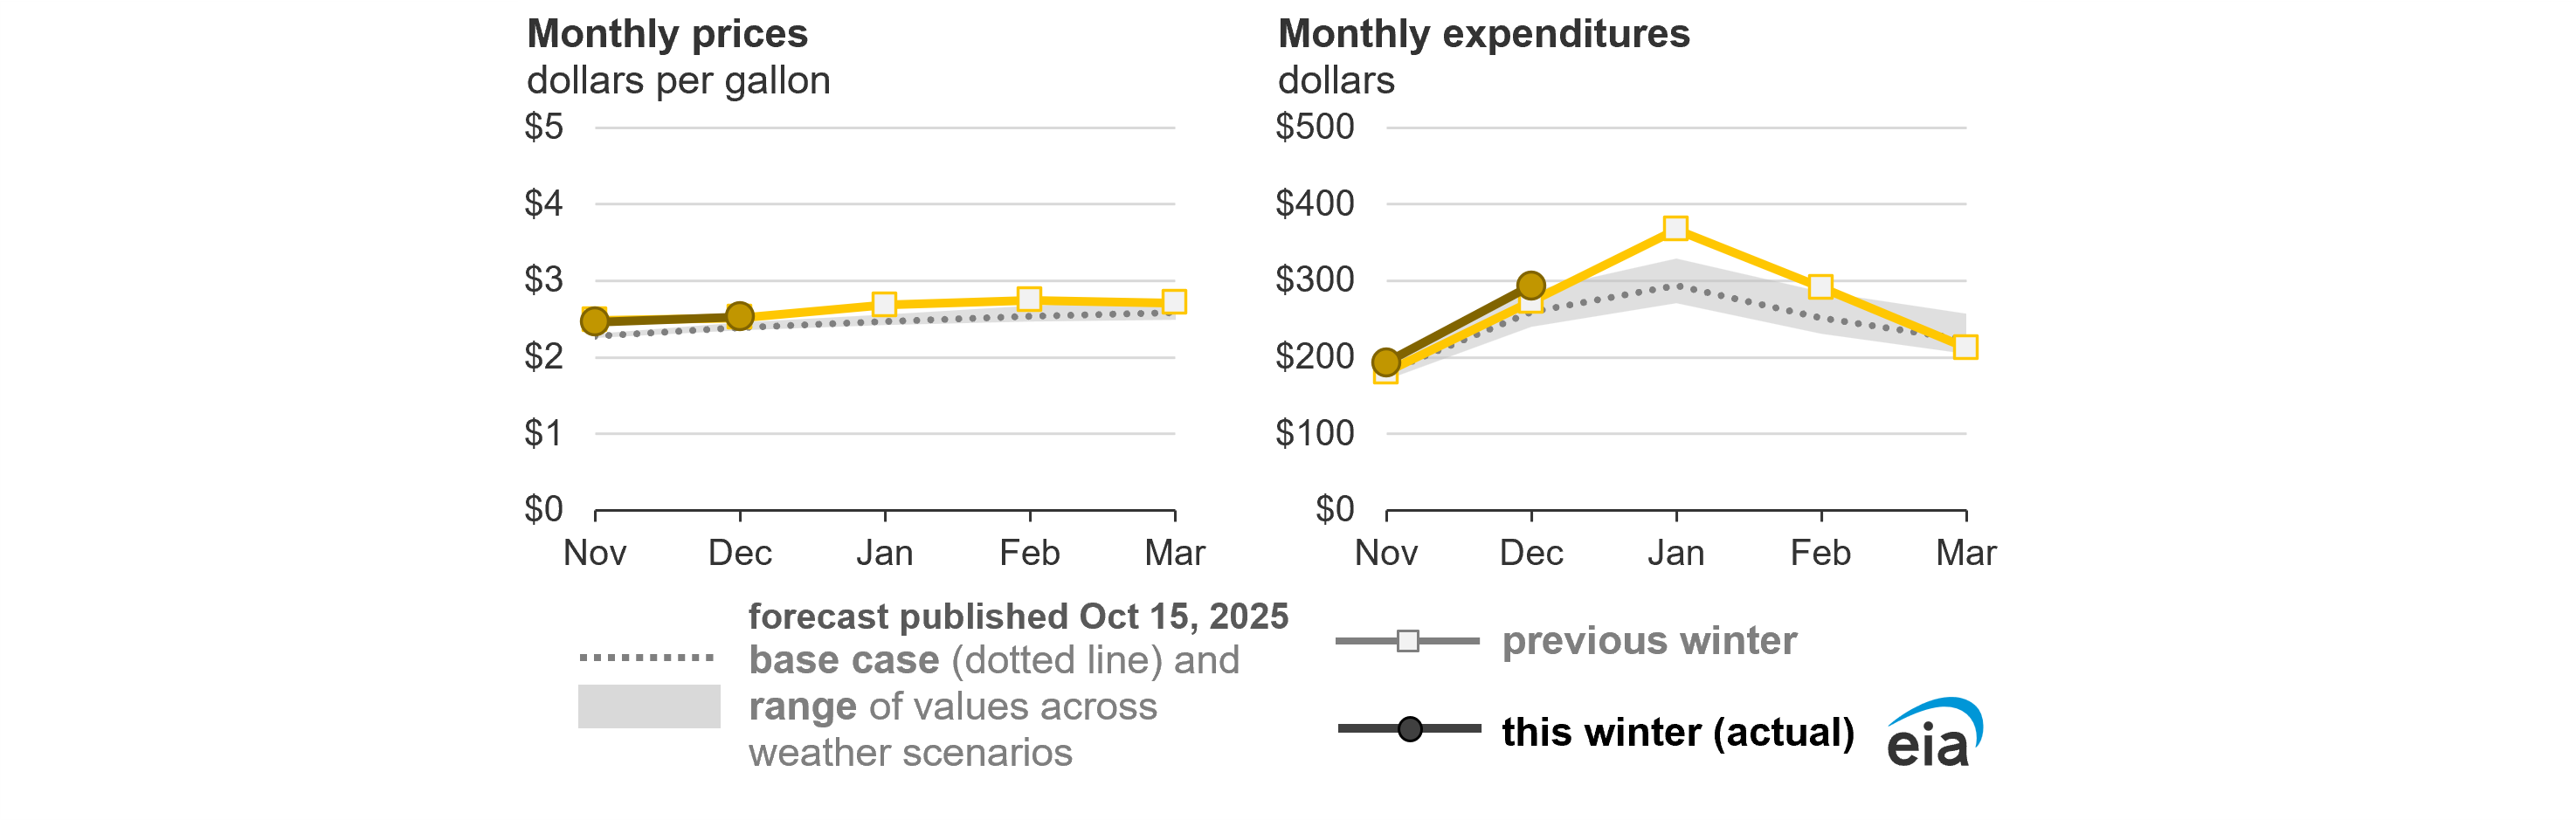
| U.S. average | 181 | 259 | 294 | 252 | 223 | 1,210 | -9% |
| Price (dollars per gallon) | % change | ||||||
| Nov | Dec | Jan | Feb | Mar | Total | ||
| Northeast | 3.07 | 3.18 | 3.27 | 3.34 | 3.40 | 3.26 | -8% |
| Midwest | 1.81 | 1.93 | 2.00 | 2.06 | 2.09 | 1.98 | -7% |
| South | 2.81 | 2.93 | 3.03 | 3.12 | 3.20 | 3.02 | -7% |
| U.S. average | 2.27 | 2.39 | 2.47 | 2.54 | 2.58 | 2.46 | -7% |
| Consumption (gallons) | % change | ||||||
| Nov | Dec | Jan | Feb | Mar | Total | ||
| Northeast | 81 | 108 | 122 | 105 | 97 | 512 | -4% |
| Midwest | 102 | 140 | 156 | 130 | 111 | 639 | -1% |
| South | 59 | 83 | 91 | 72 | 60 | 365 | -2% |
| U.S. average | 80 | 108 | 119 | 99 | 86 | 493 | -2% |
| Expenditures (dollars) | % change | ||||||
|---|---|---|---|---|---|---|---|
| Nov | Dec | Jan | Feb | Mar | Total | ||
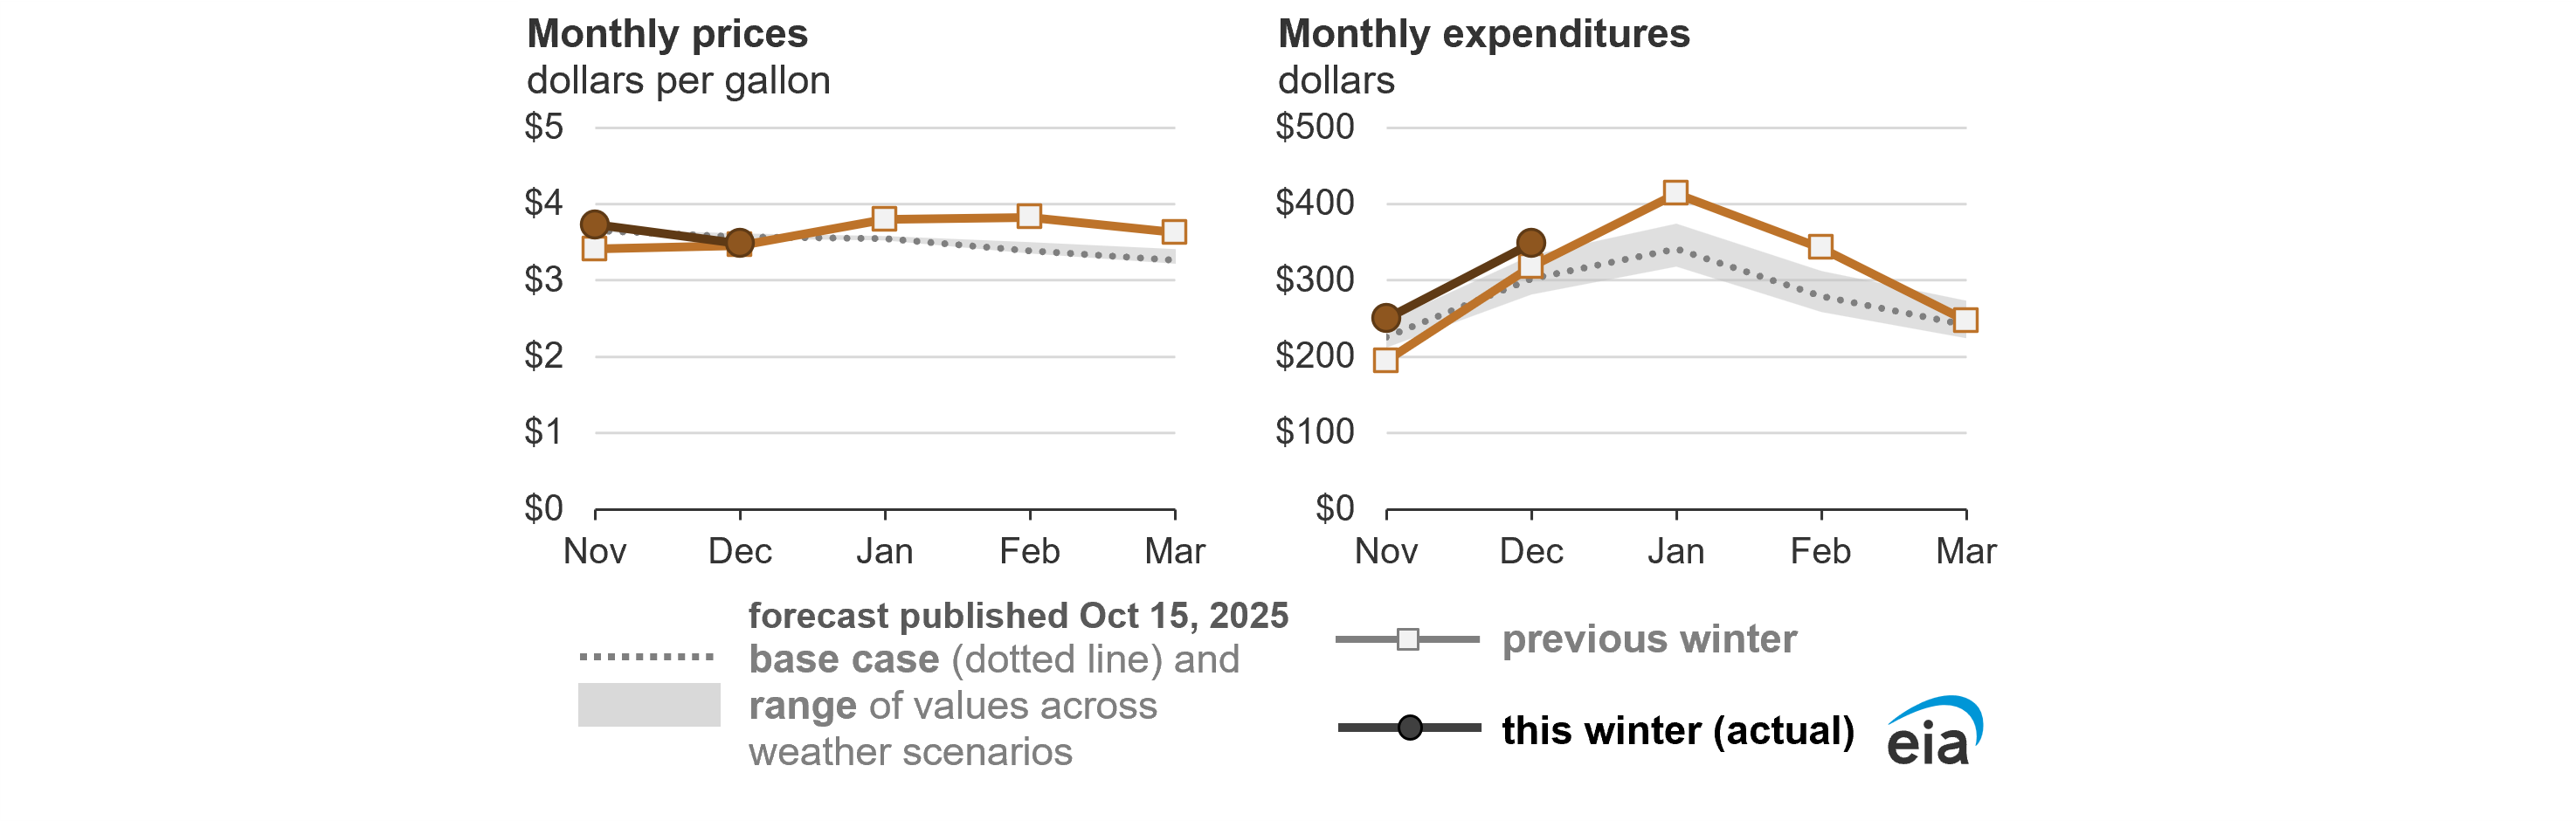
| U.S. average | 226 | 302 | 341 | 279 | 242 | 1,390 | -8% |
| Price (dollars per gallon) | % change | ||||||
| Nov | Dec | Jan | Feb | Mar | Total | ||
| U.S. average | 3.66 | 3.57 | 3.55 | 3.39 | 3.27 | 3.48 | -4% |
| Consumption (gallons) | % change | ||||||
| Nov | Dec | Jan | Feb | Mar | Total | ||
| U.S. average | 62 | 85 | 96 | 82 | 74 | 399 | -4% |
Note: Percentage change value is relative to previous winter. Propane expenditures are a household-weighted average of the Northeast, Midwest, and South regions.
Effects of wholesale prices on retail prices
Wholesale market conditions affect fuels differently. For natural gas, changes in retail prices lag changes in wholesale prices largely due to the nature of utility regulation. Over longer periods, changes in natural gas wholesale and retail prices are closely correlated. Some state utility commissions set the rates utilities can charge for natural gas deliveries a year or more in advance of billing to reflect the cost of wholesale natural gas that utilities purchased over many months.
The timing and frequency of rate changes can vary by utility. In times of high price volatility, some utilities may adjust retail rates several times in a year. In addition, residential natural gas prices include charges to cover utility operating costs and the cost to transport and distribute natural gas, which are not directly linked to wholesale commodity natural gas prices.
The prices residential consumers pay for electricity lag changes in wholesale spot prices in a way that is similar to natural gas. Electricity prices charged to ultimate customers reflect the costs of supplying the electricity and delivering it to households. Increases in costs may pass through to customers more quickly in areas of the country with markets where consumers have a choice of electricity providers.
Wholesale price changes for heating oil and propane are passed to consumers quickly because rates in those markets are not regulated as they are for natural gas and electricity. We generally estimate that changes in wholesale fuel prices become fully reflected in retail prices over a period of four to six weeks.
Many heating oil and propane users buy supplies ahead of the winter and refill as needed. When forecasting expenditures, our calculations do not account for fuel that consumers purchase ahead of its use or fuel that was contracted at prices set before the start of the winter. We assume households pay the prevailing retail price for heating oil and propane at the time they use it.
Natural gas
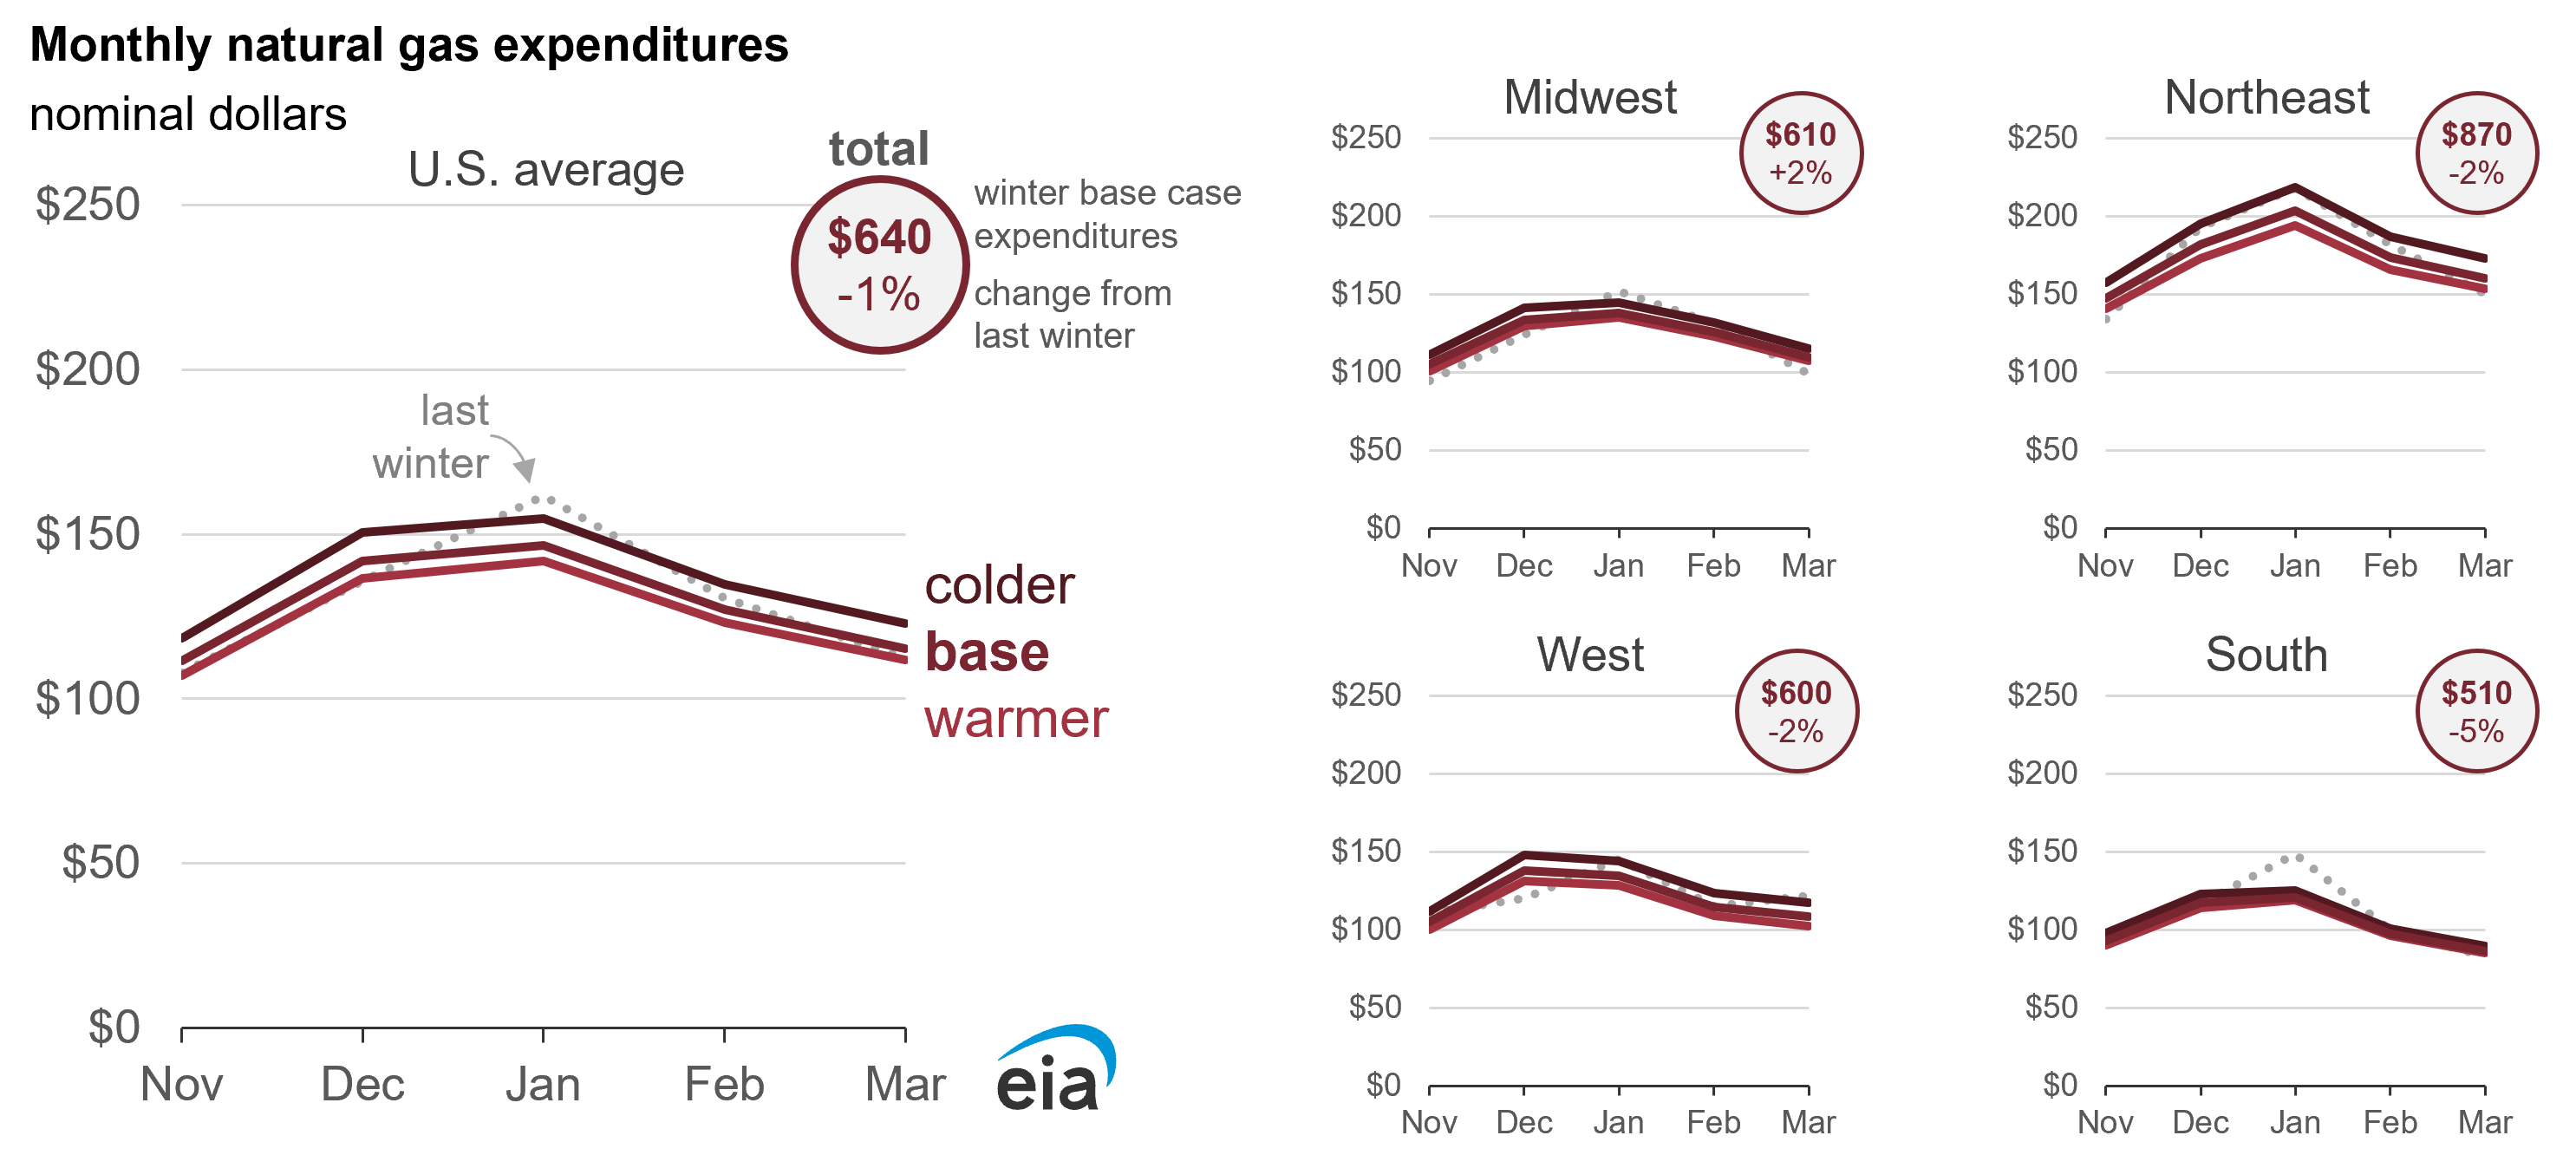
- We expect homes heating with natural gas to have about the same natural gas expenditures as last winter across most of the country because, relative to last winter, prices are similar and winter weather may be milder.
- One exception is the Midwest, where higher prices lead to slightly higher expenditures.
- Natural gas inventories at the start of winter are at normal or above-normal levels in all regions.
Natural gas is the most widely used fuel for space heating across the United States. For the 46% of U.S. homes that use natural gas as the main heating fuel, we expect expenditures to be close to last winter's levels. In our base case, slightly milder temperatures this winter reduce natural gas consumption by 2%. The lower consumption is partially offset by a 1% increase in residential natural gas prices. Changes in expenditures vary by region: we expect homes in the South will spend 5% less on their natural gas bills this winter, while homes in the Midwest will spend 2% more.
In the colder scenario, we expect a 6%, or 6 million cubic feet (Mcf), increase in consumption and a 5% increase in expenditures compared with last winter. The warmer weather scenario has 8% less natural gas consumption compared with last winter and a 4% decrease in expenditures compared with last winter.
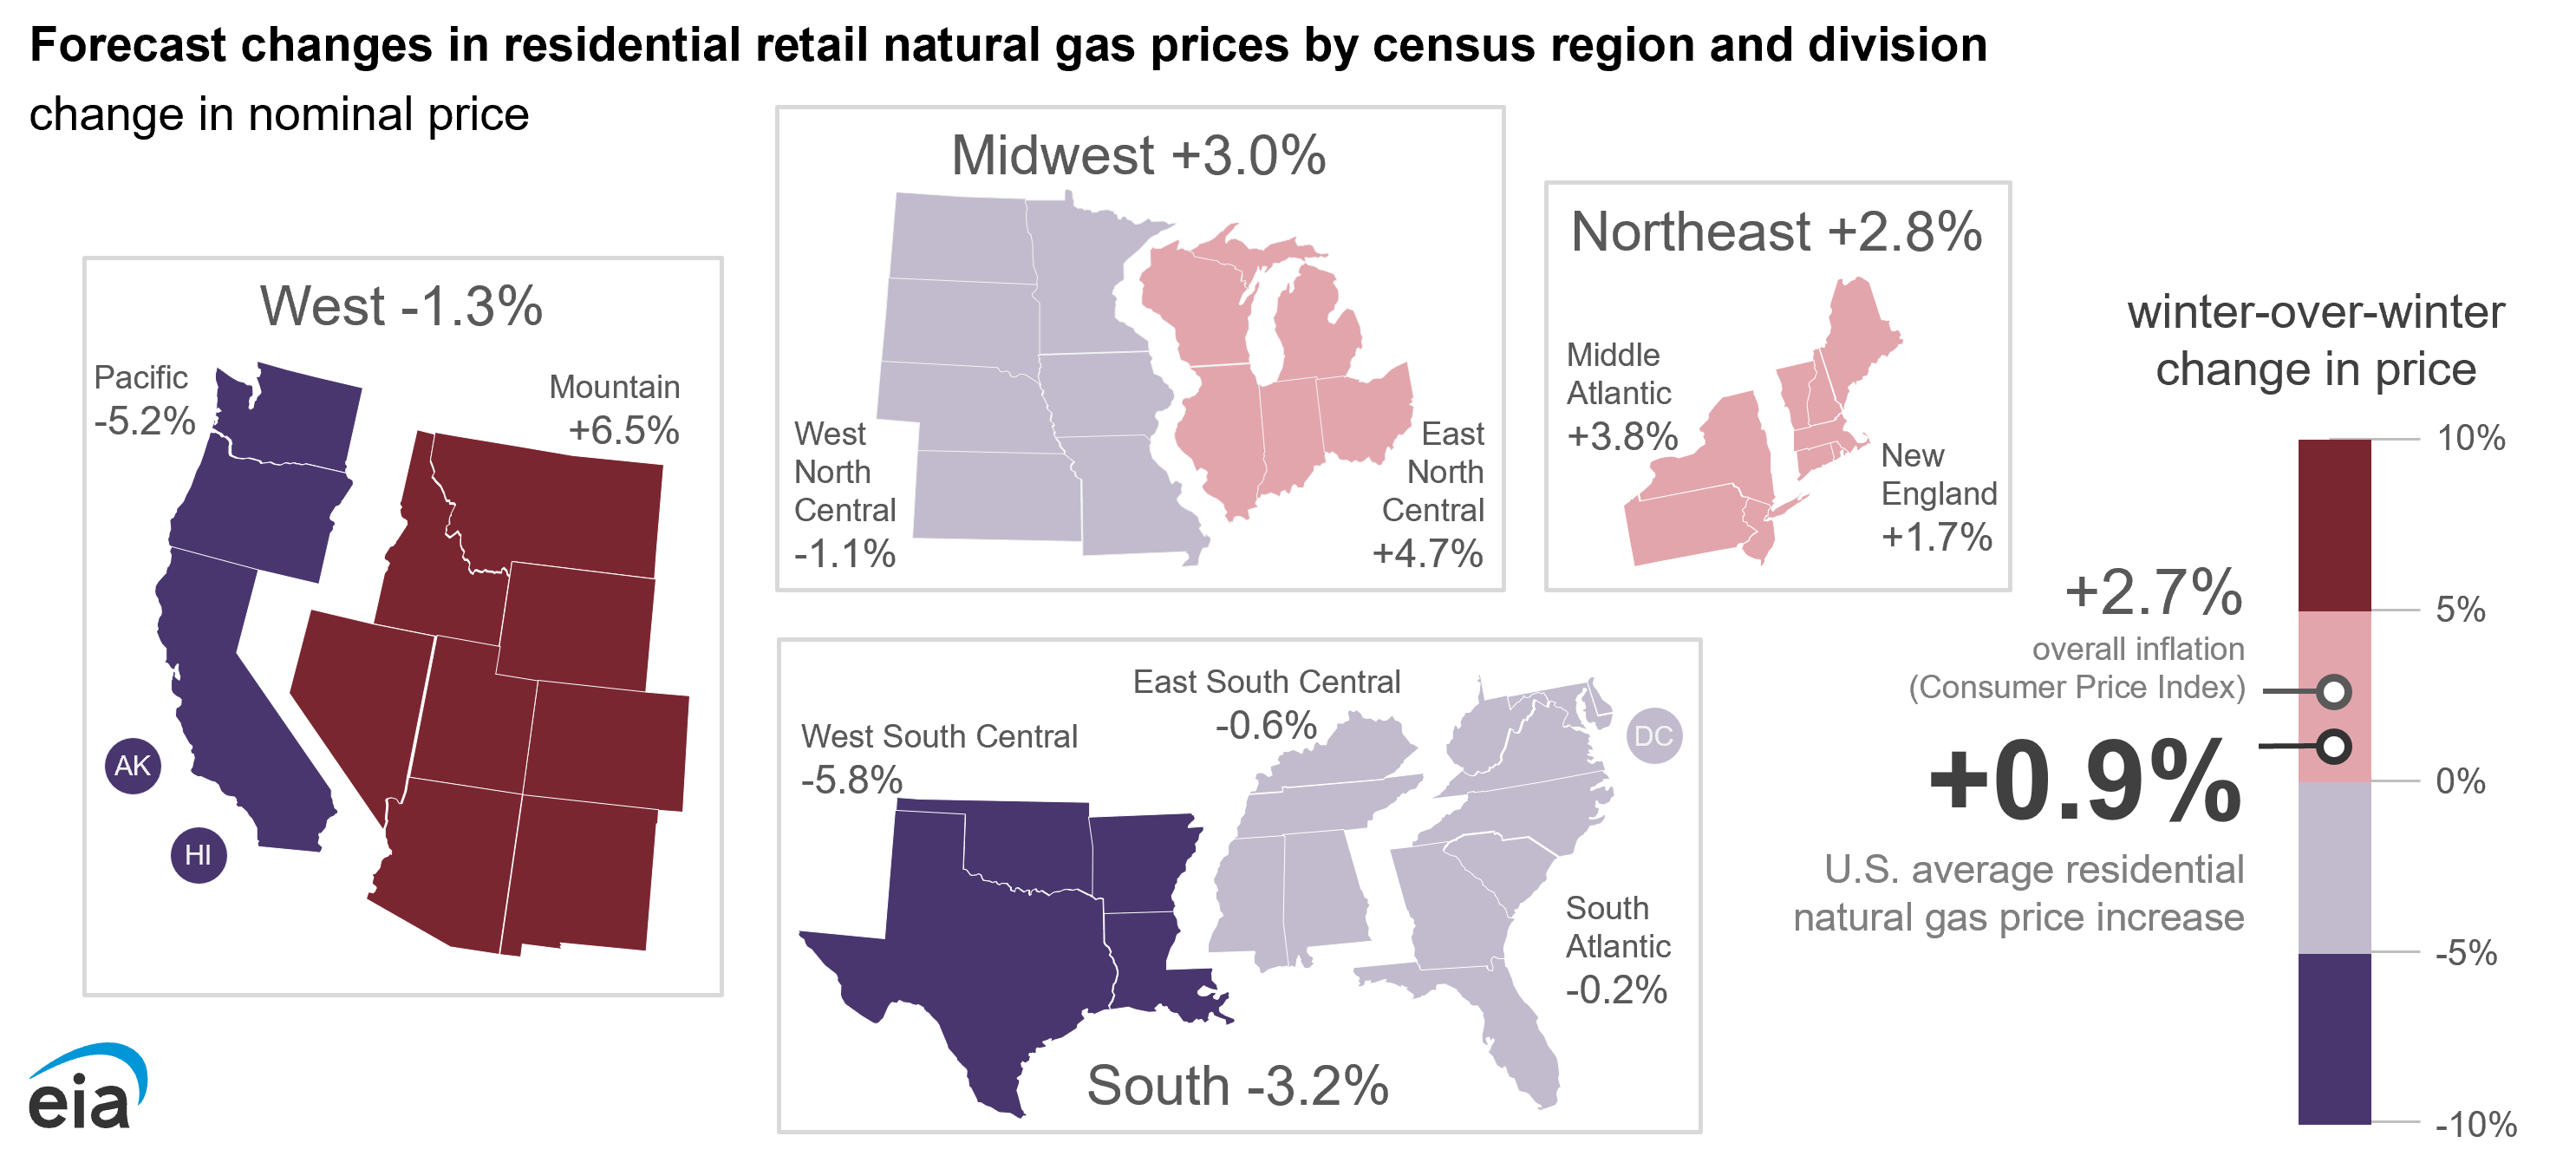
Natural gas-heated homes in the South have the largest forecast decrease in spending this winter because we expect natural gas prices will fall the most from last winter in that region. In the base case, we forecast 3% lower residential natural gas prices and 5% lower natural gas expenditures in the South relative to last winter.
The Midwest is the only region where we expect a slight increase in natural gas bills this winter in our base case. Winter household natural gas bills in the Midwest are forecast to average about $610 in our base case, or 2% more than last winter. The increase is driven by our expectation for higher prices in the Midwest. Midwest residential consumers primarily heating with natural gas used an estimated 59 Mcf of natural gas last winter, and we expect them to consume the same amount this year.
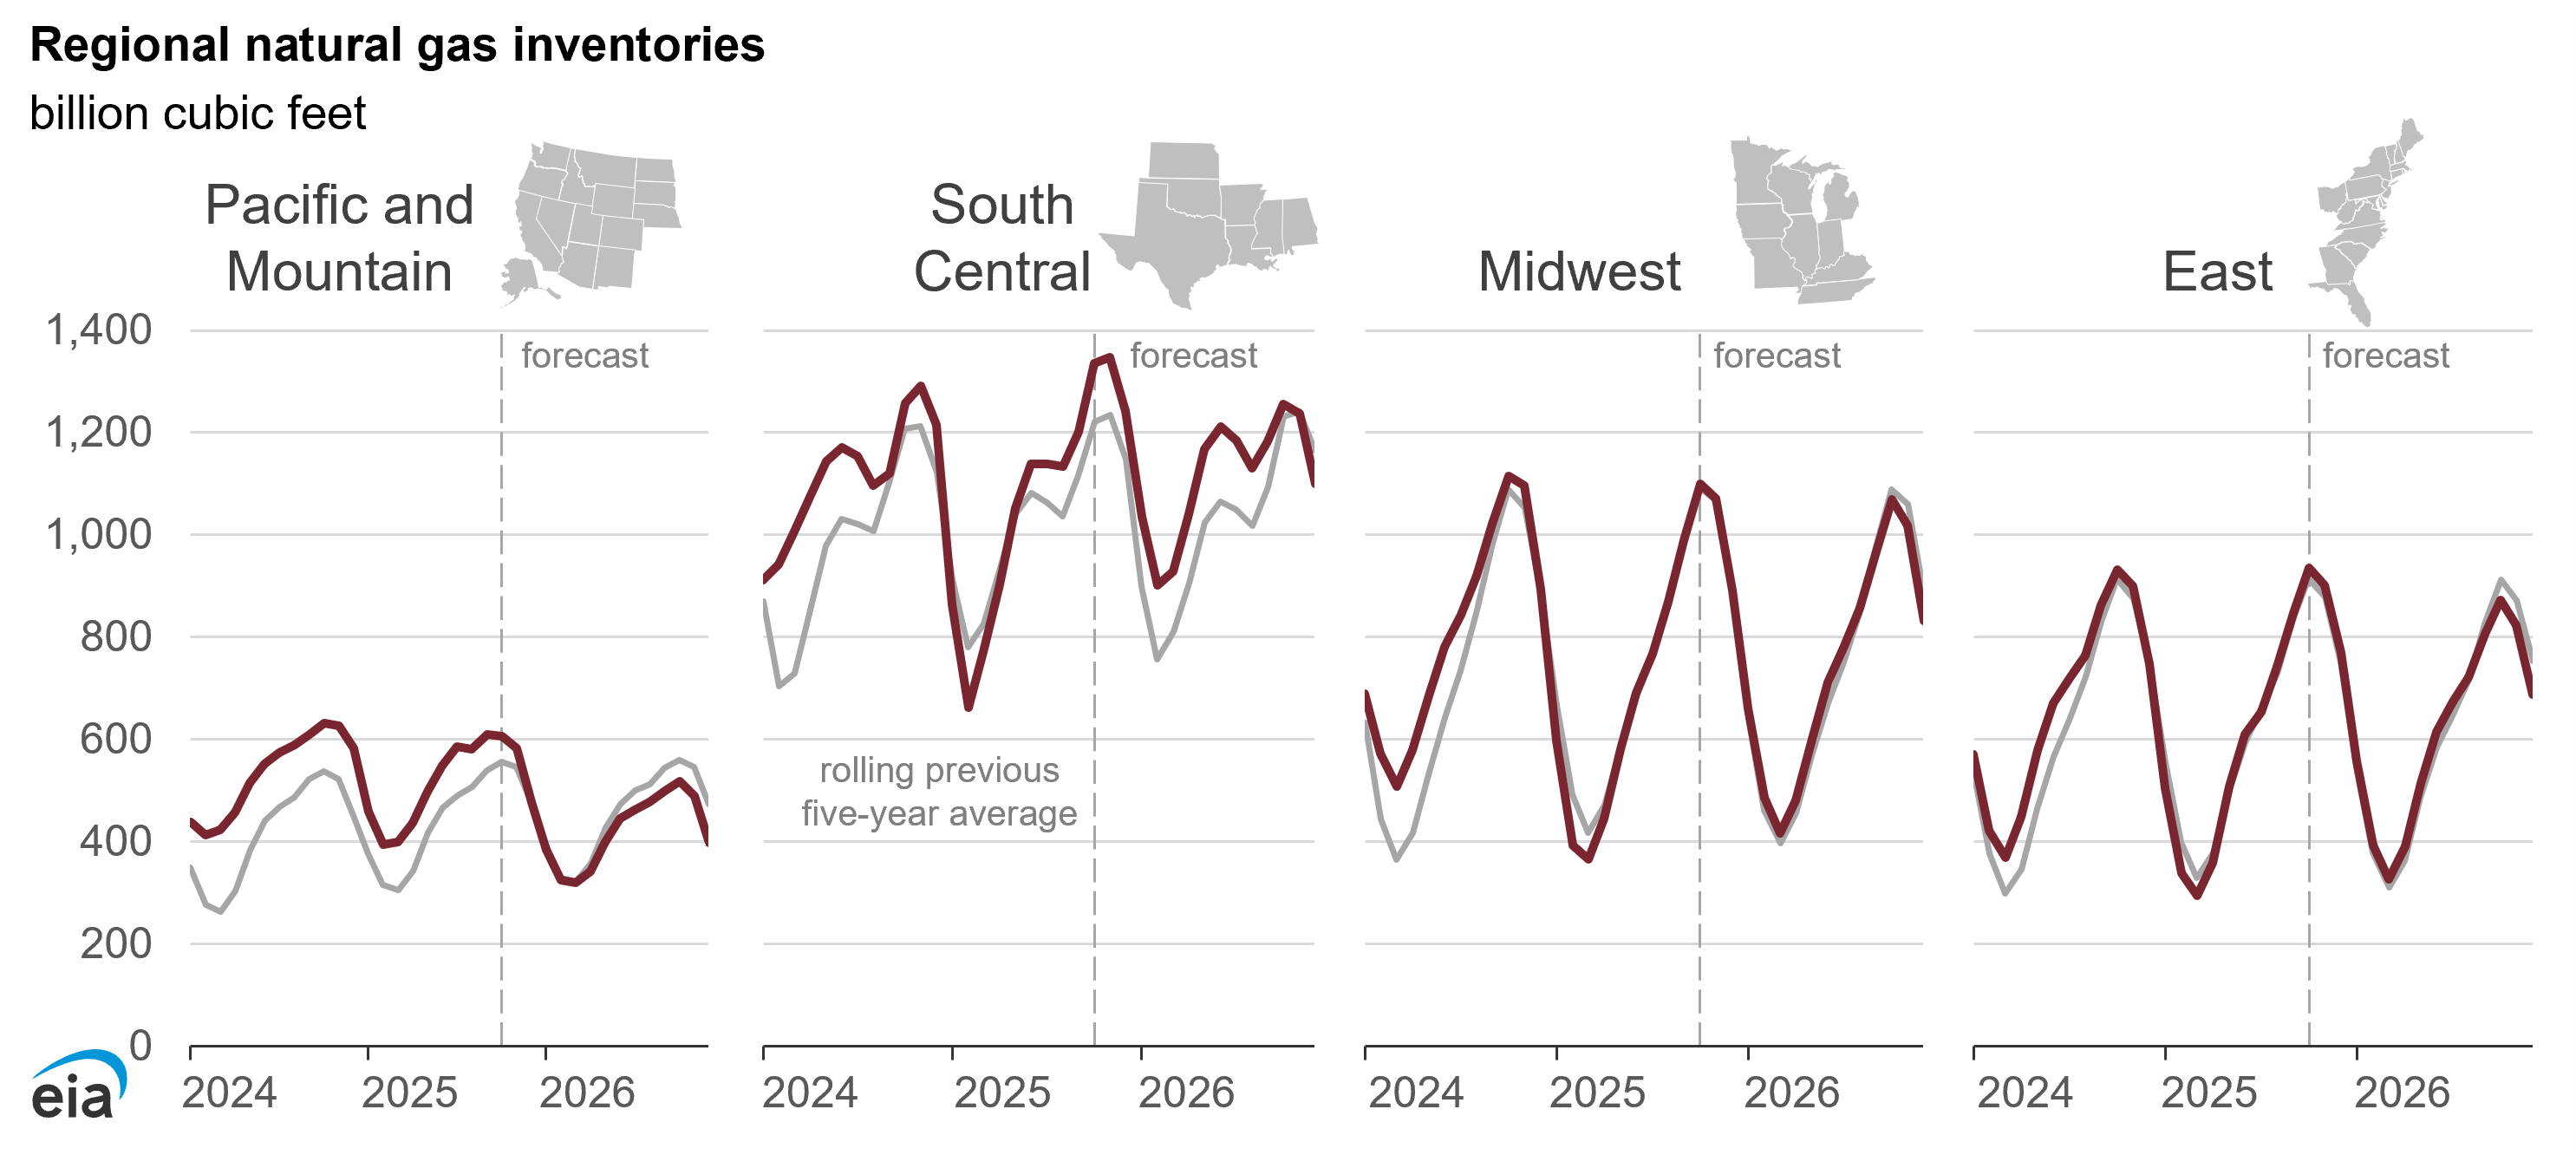
Data values: U.S. Natural Gas Supply, Consumption, and Inventories
U.S. working natural gas inventories are currently about 5% above the previous five-year average for this time of year. Wholesale natural gas price increases this summer were moderated by robust natural gas production and less power-sector consumption relative to the previous summer. Going into winter, prices are expected to increase as natural gas exports increase and storage withdrawals outpace injections.
The relatively minor change in the U.S. average natural gas price for the residential sector masks broader changes in certain regions. In particular, we expect residential natural gas prices in the Mountain division to be more than they were last winter. We expect natural gas prices in the Pacific division and the western part of the South to be much lower than last winter.
Data values: U.S. Regional Natural Gas Prices
Electricity
- Higher winter expenditures for homes heating with electricity are primarily driven by higher retail electricity prices.
- Our assumption of a milder winter results in slightly lower electricity consumption for homes heating with electricity, but this result is muted because the space heating portion of electricity bills is relatively low.
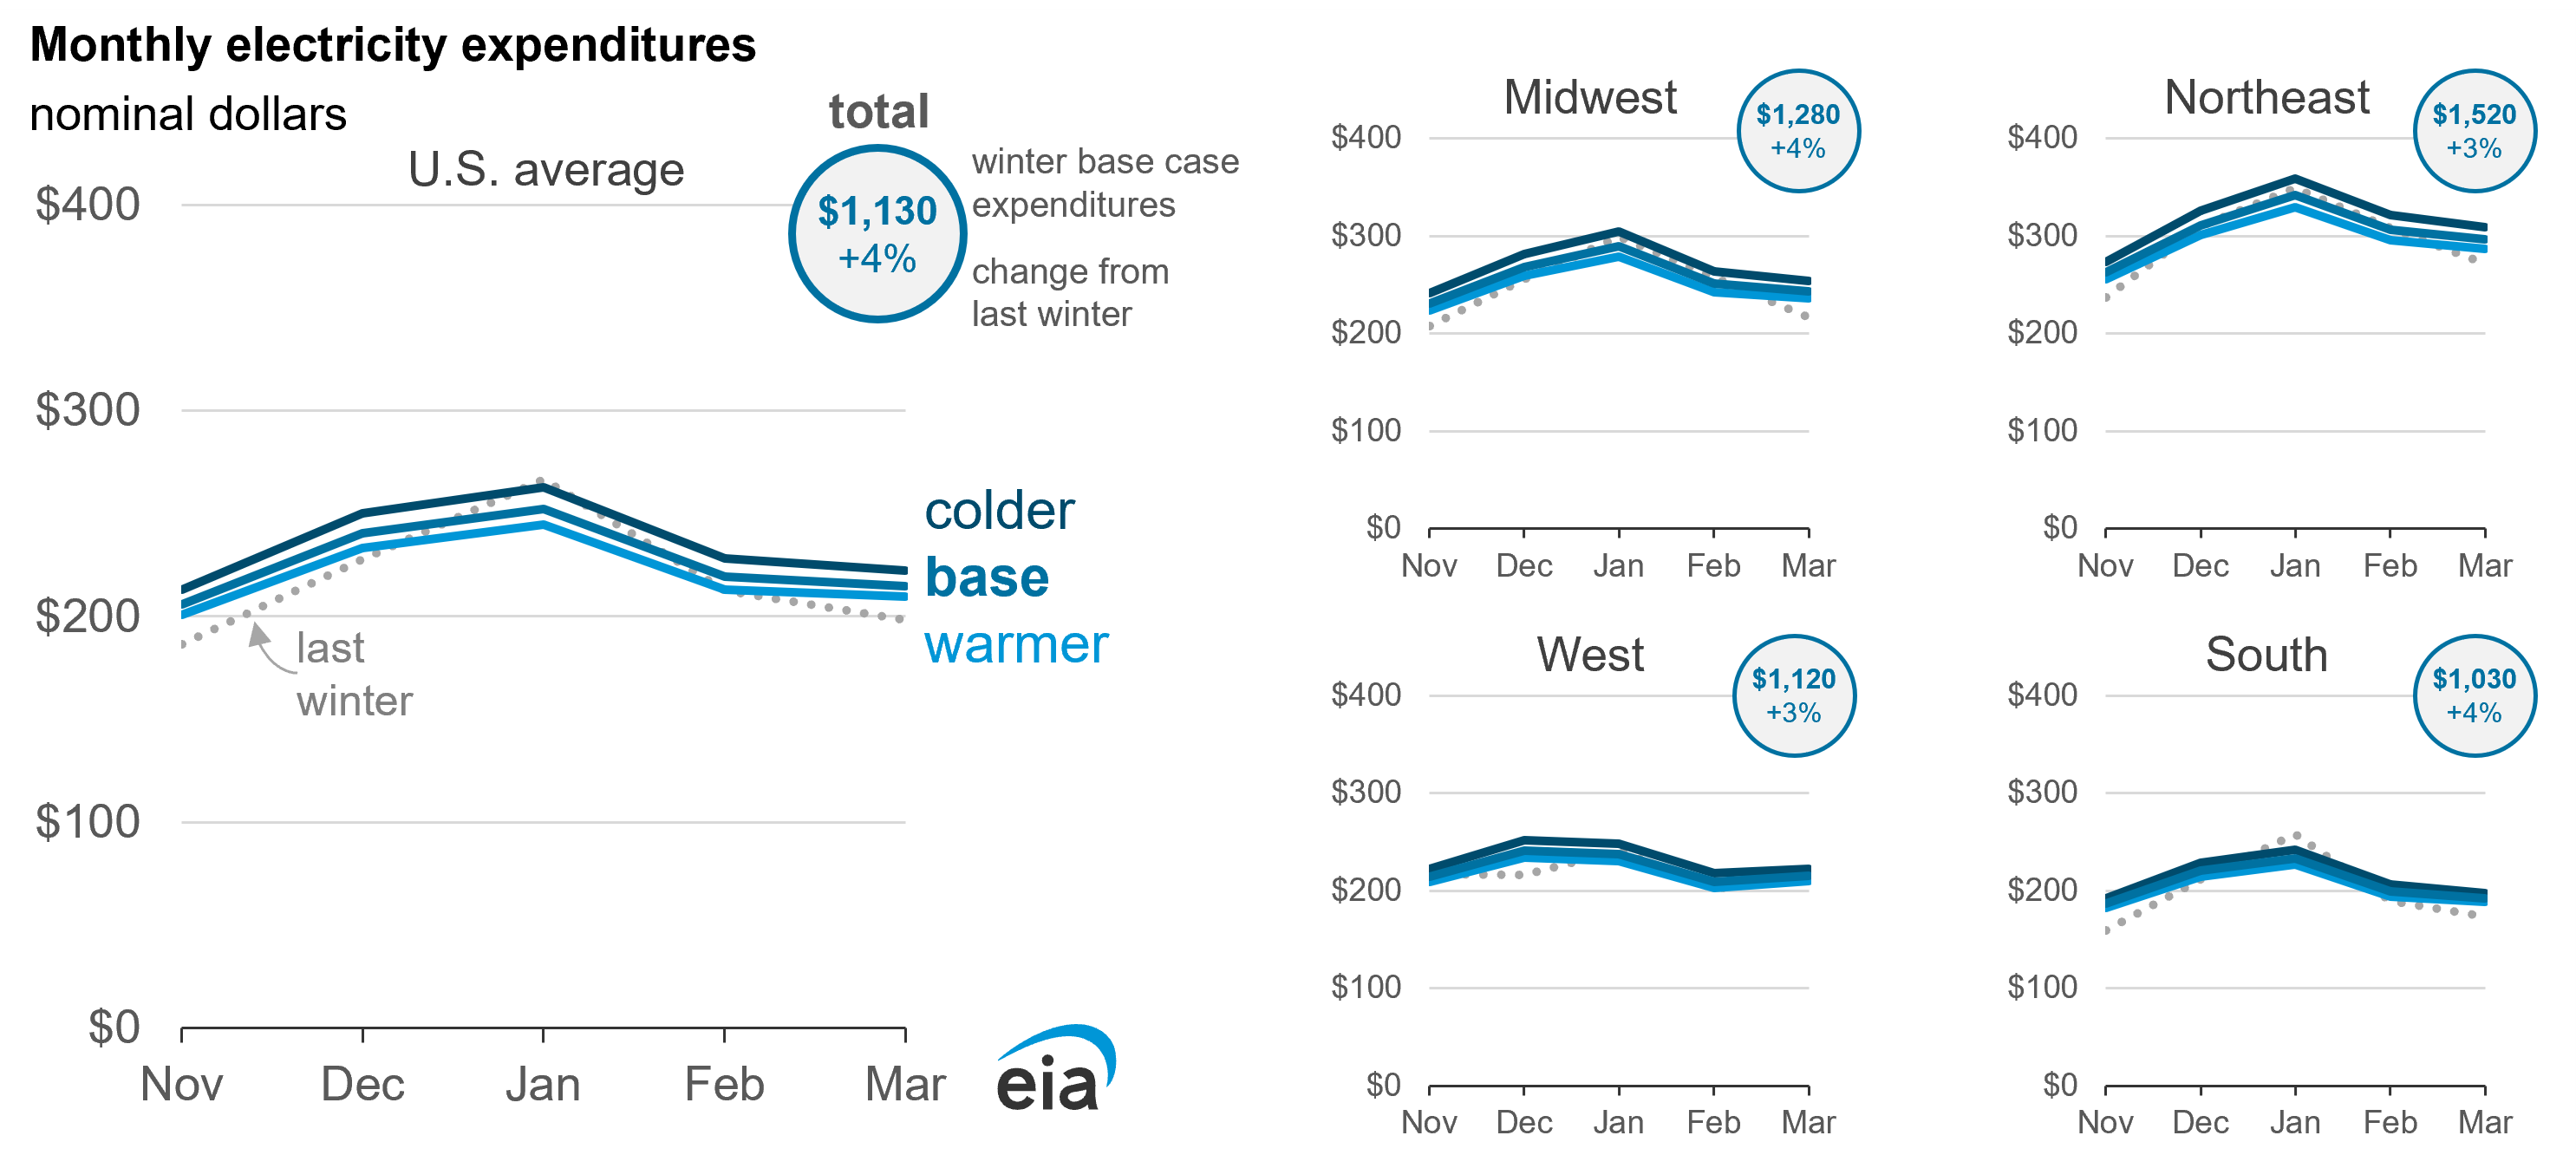
We expect U.S. households that primarily use electricity for heating will spend an average of 4% more on their electricity bills this winter, largely because of an expected 5% increase in retail electricity prices. The effect of higher electricity prices on expenditures is slightly offset by our expectation that residential electricity consumption will decrease by 1% because of milder weather this winter. We expect total electricity expenditures will increase in all U.S. regions.
Winter residential electricity expenditures in the Midwest and South regions increase by a similar rate as the national average, 4%, despite slightly lower electricity consumption. Expenditures in the Northeast and West regions are expected to increase by 3% this winter.
Forecast winter expenditures are highest in the coldest regions. We forecast homes heating with electricity in the Northeast will spend the most, at $1,520, followed by those in the Midwest, with expected electricity expenditures of $1,280 this winter.
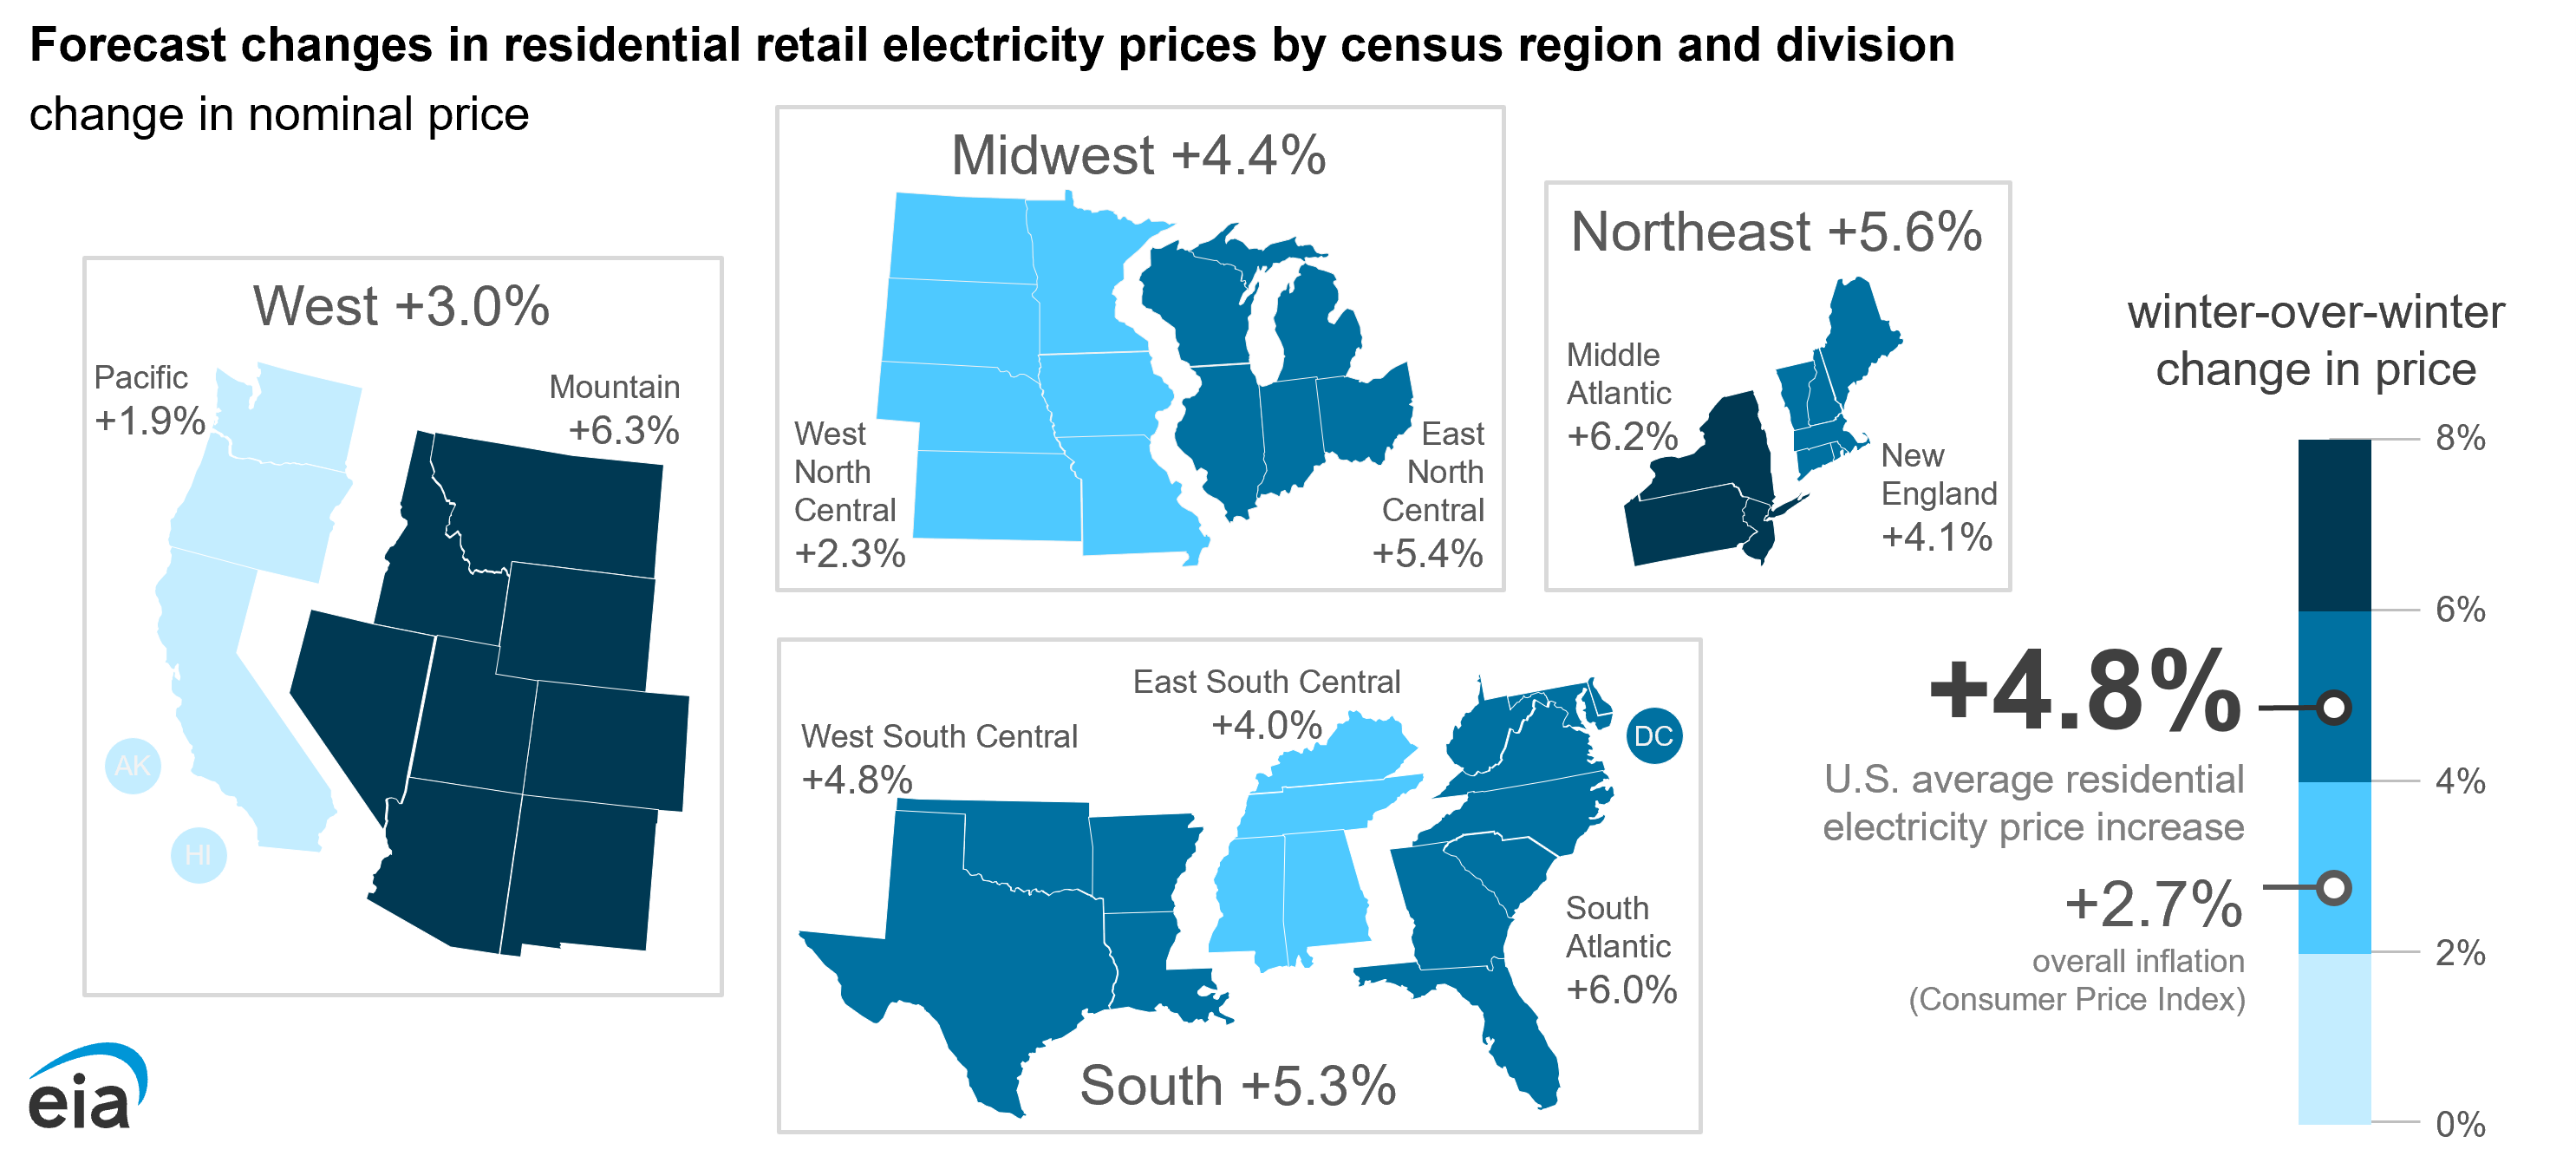
Sharp increases for residential electricity prices have occurred in recent months in some areas of the country. Electricity prices have increased particularly in the Mountain, Middle Atlantic, and South Atlantic census divisions due to various factors including increasing natural gas prices, expenses associated with damaging storms and wildfires, rising insurance costs, and expanding infrastructure to accommodate expected rapid demand growth.
Residential retail electricity price increases this winter are the largest in the Northeast, which includes the Middle Atlantic and New England states. We expect the residential electricity price this winter in the Northeast will average 24 cents per kilowatthour (kWh), or 6% more than last winter. Electricity prices in the Middle Atlantic division (New York, New Jersey, and Pennsylvania) increase by more than the Northeast average of 6%.
We forecast residential electricity prices in the West region, which includes the Pacific and Mountain divisions, to average 20 cents/kWh. States in the Pacific division (California, Oregon, and Washington) have the lowest expected increase (+2%) during the upcoming winter. Retail electricity prices in those states have increased in recent years as a result of expenses associated with damaging wildfires and related liability costs. We expect the Mountain region's electricity price to rise by more than the national average, with prices increasing by 6% since last winter.
Data values: U.S. Regional Electricity Prices to Ultimate Customers
Propane
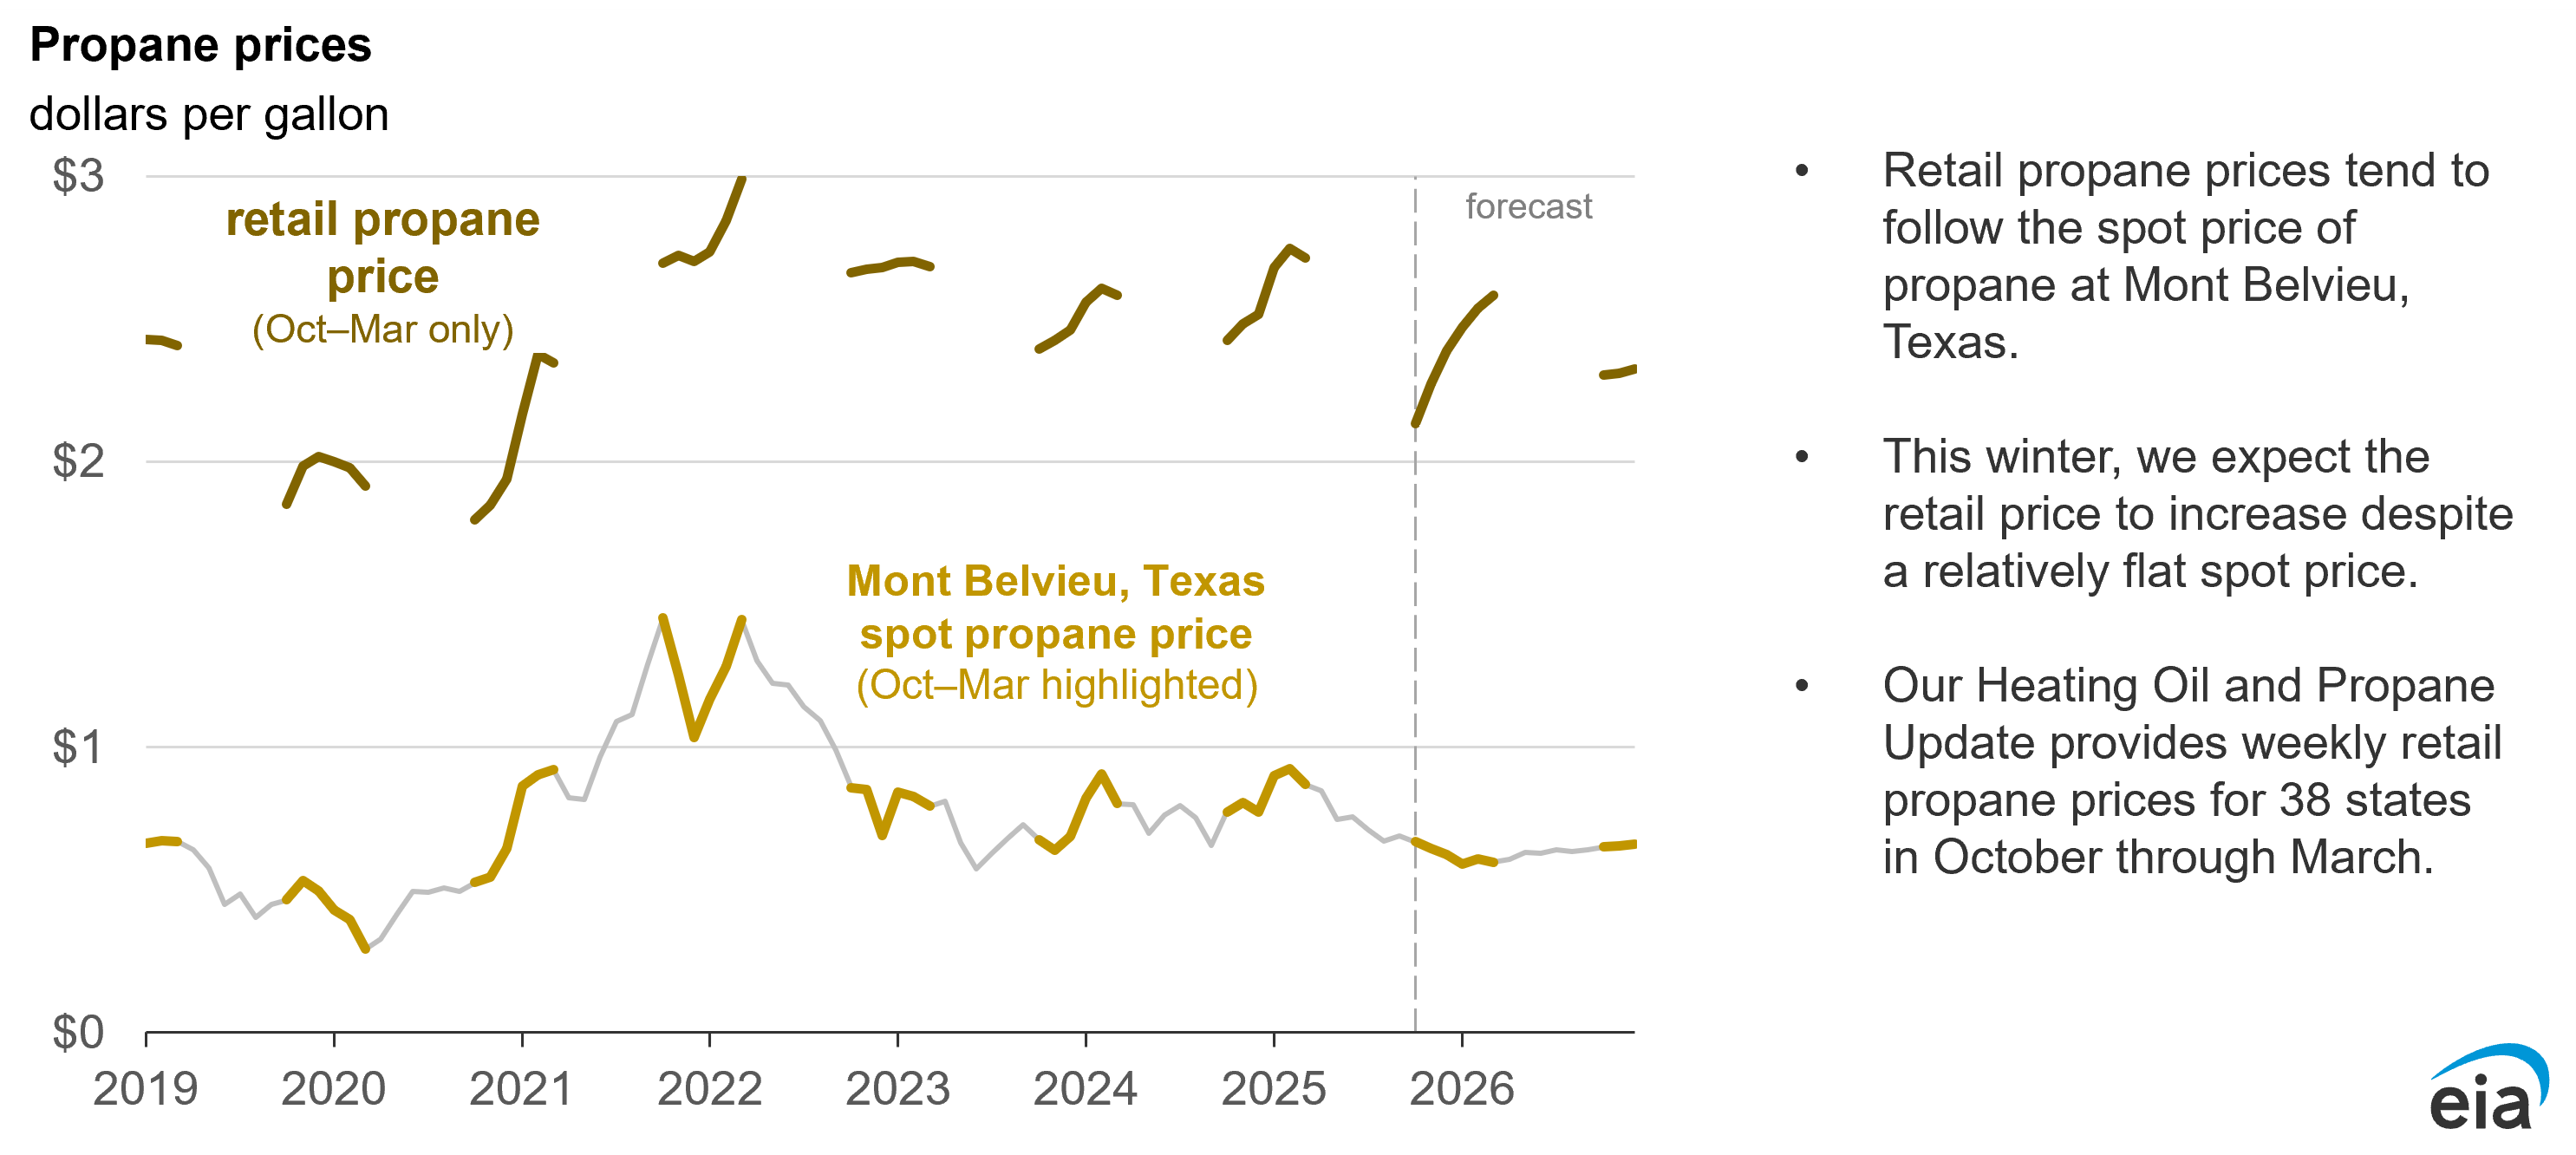
- Retail propane prices are lower this winter than last winter, following the trend in propane spot prices.
- Slightly milder winter weather also contributes to our expectation that propane expenditures will be less than last year's in the base case.
- Propane inventories are above their five-year average despite increased demand for propane for agricultural uses, especially grain drying.
In our base case forecast, we expect households heating primarily with propane will pay less than they did last winter on average across the United States, primarily as a result of lower prices. Propane is used as a heating fuel in 5% of U.S. households, mostly in rural areas.
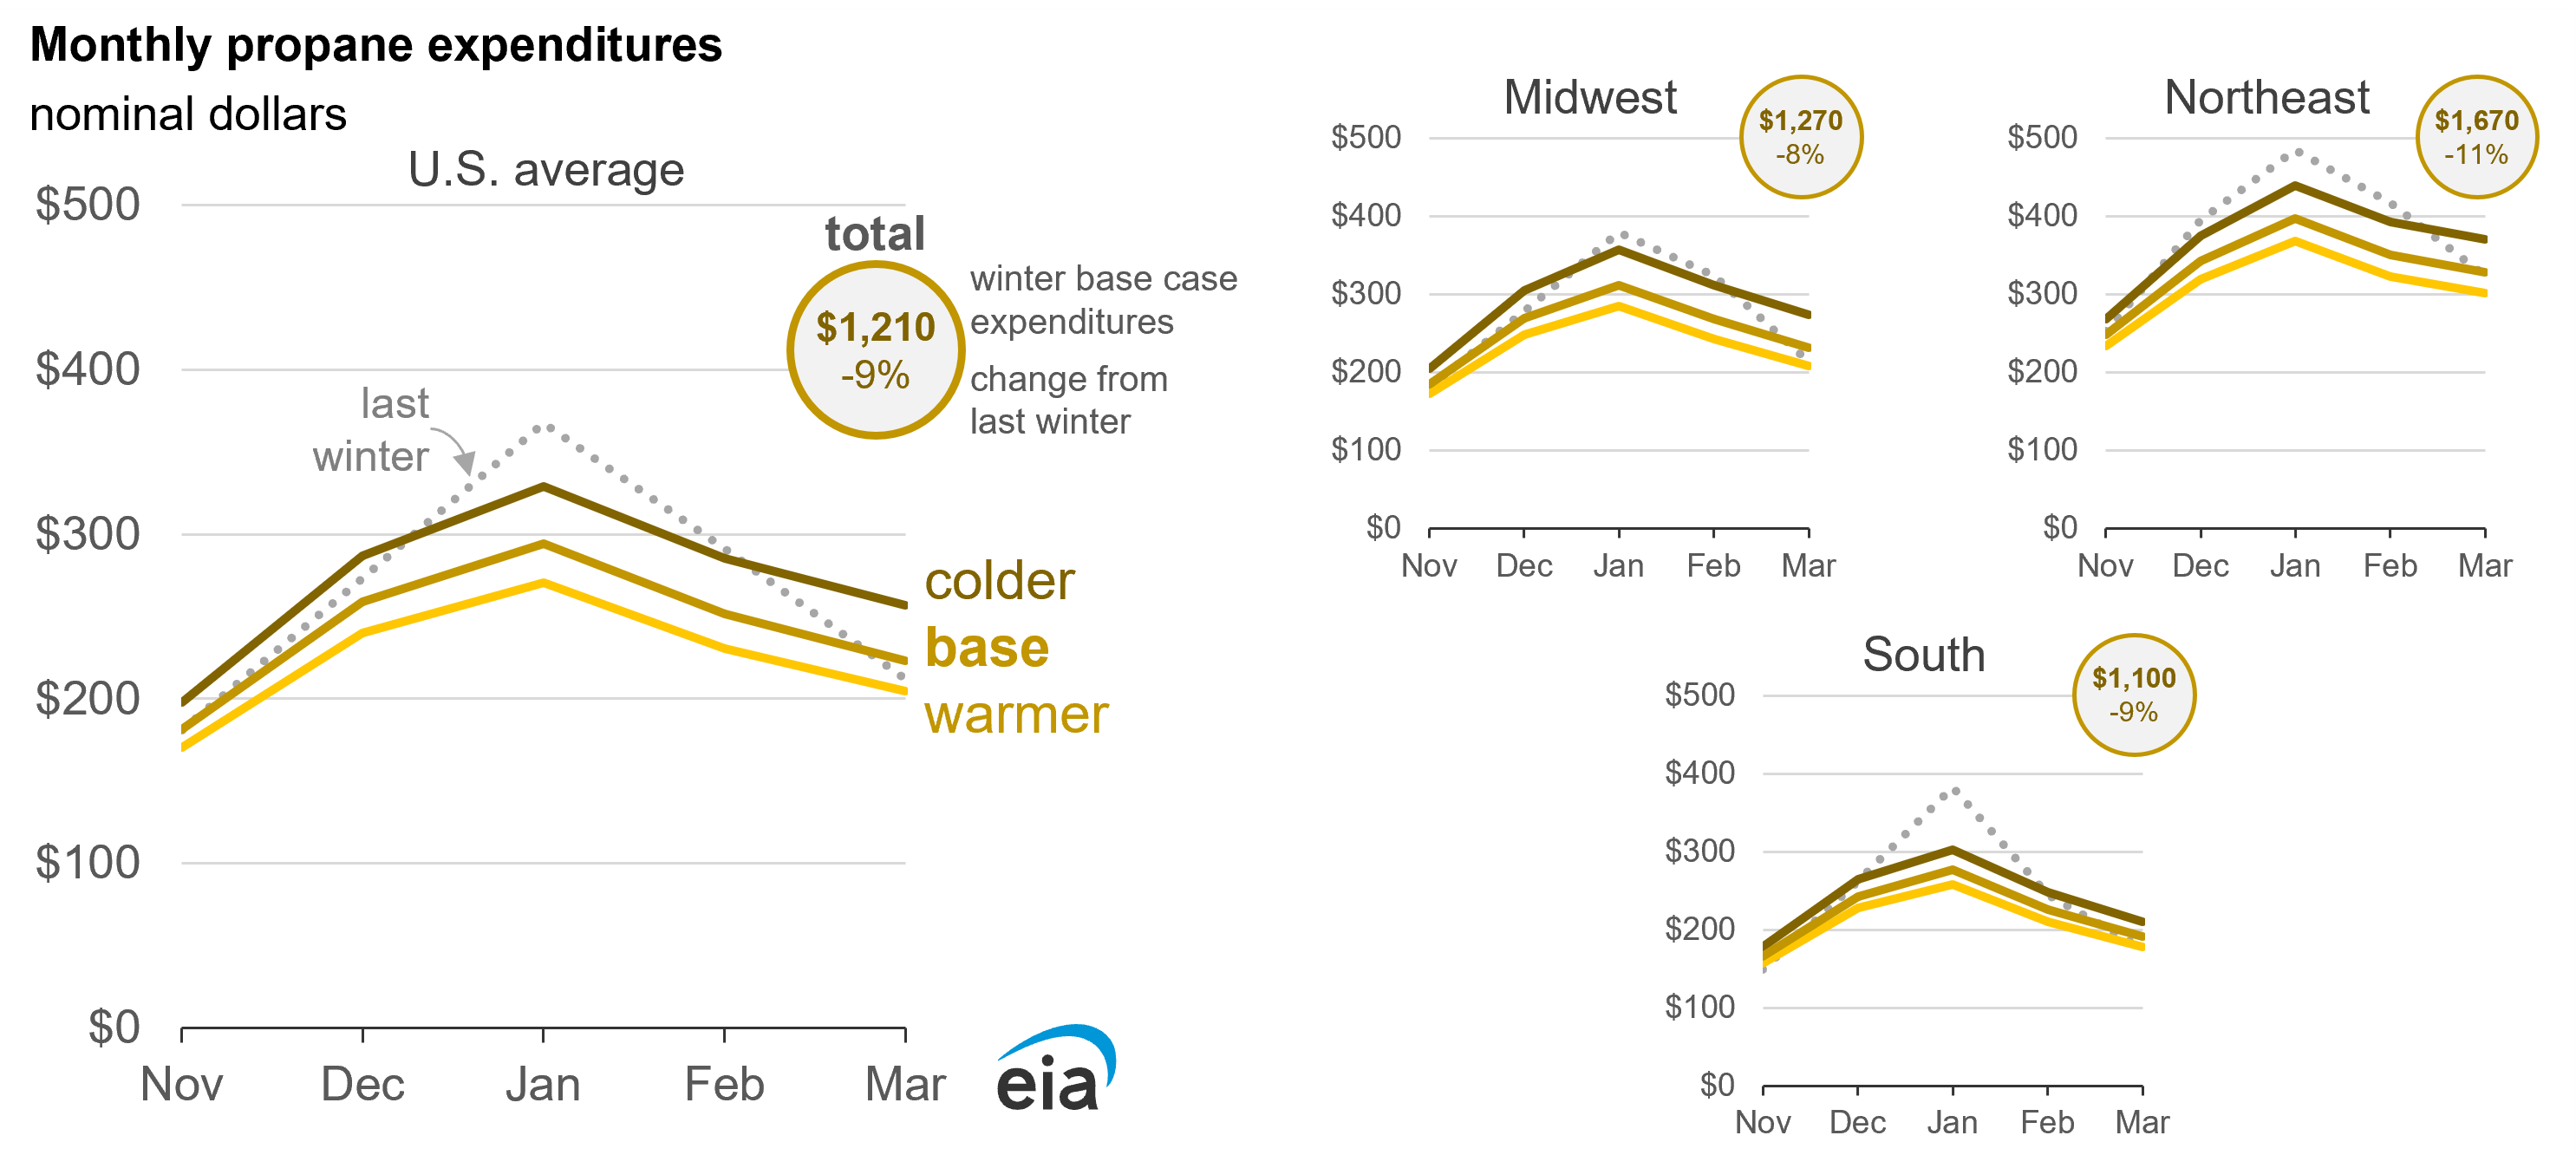
The Midwest has the highest share of homes that use propane as the main heating fuel, and in our base case, we expect that homes in the Midwest will spend 8% less on propane compared with last winter. We expect homes in the Midwest will consume about the same amount of propane as last year because of a similar temperature forecast to last winter.
In the Northeast, we expect households to spend 11% less this winter, the largest decrease among the regions, because of less consumption and lower prices. We expect households in the South to spend 9% less on propane this winter. In the colder scenario, these expectations shift to values that are closer to or more than last winter's propane expenditures, especially in the Midwest, where propane expenditures would be 6% more than last winter with colder weather assumptions.
Because propane can be produced from both crude oil and natural gas, propane prices typically follow the prices of crude oil and natural gas but can vary significantly depending on supply and demand conditions, particularly in response to winter weather. We expect the U.S. average retail propane price will average $2.46 per gallon (gal) throughout the winter, 7% less than the previous winter.
The Midwest often has lower retail propane prices than other regions. We forecast the Midwest retail price will average just under $2.00/gal this winter. The Midwest has a network of propane distribution hubs throughout the region, making retail supply more accessible compared with other regions.
Propane inventories typically build from April to September, when propane consumption is relatively low, and fall during the winter. At the end of September, U.S. propane inventories totaled 103 million barrels, 12 million barrels more than the previous five-year average. We forecast that U.S. propane inventories will remain well above their previous five-year average throughout the winter.
High propane inventory levels have helped keep propane prices relatively low this year, a trend we expect to continue throughout this winter unless temperatures are much colder than our base case forecast. We forecast U.S. propane production to increase by about 2% this winter compared with last winter and for U.S. propane consumption to fall by 12% because of less propane consumption in the residential and commercial sectors.
In the early winter, we assume increased use of propane for crop drying will offset some of the drop in space heating consumption. In October and November, propane is consumed in commercial grain dryers when the corn harvest takes place, and we expect slightly more grain drying demand for propane at the start of this winter because the U.S. Department of Agriculture expects a relatively large corn harvest.
Data values: U.S. Hydrocarbon Gas Liquids (HGL) and Petroleum Refinery Balances
In our Short-Term Energy Outlook, we forecast retail propane prices in October through March, as those months coincide with our weekly survey of propane prices in our Heating Oil and Propane Update. Retail propane prices at the beginning of the winter generally reflect trends in the wholesale price. We forecast that the wholesale price of propane at Mont Belvieu, Texas, for this October will be 14% less than it was it was in October 2024 and the U.S. average residential propane price will be 12% less than last year.
During the winter months, retail propane prices tend to increase. We expect the residential propane price to increase from $2.13/gal in October to $2.58/gal in March 2026, despite relatively little change in the wholesale price. Similar patterns occurred in previous years when retail prices increased during the winter despite smaller changes in wholesale propane prices.
Data values: Energy Prices
Heating oil
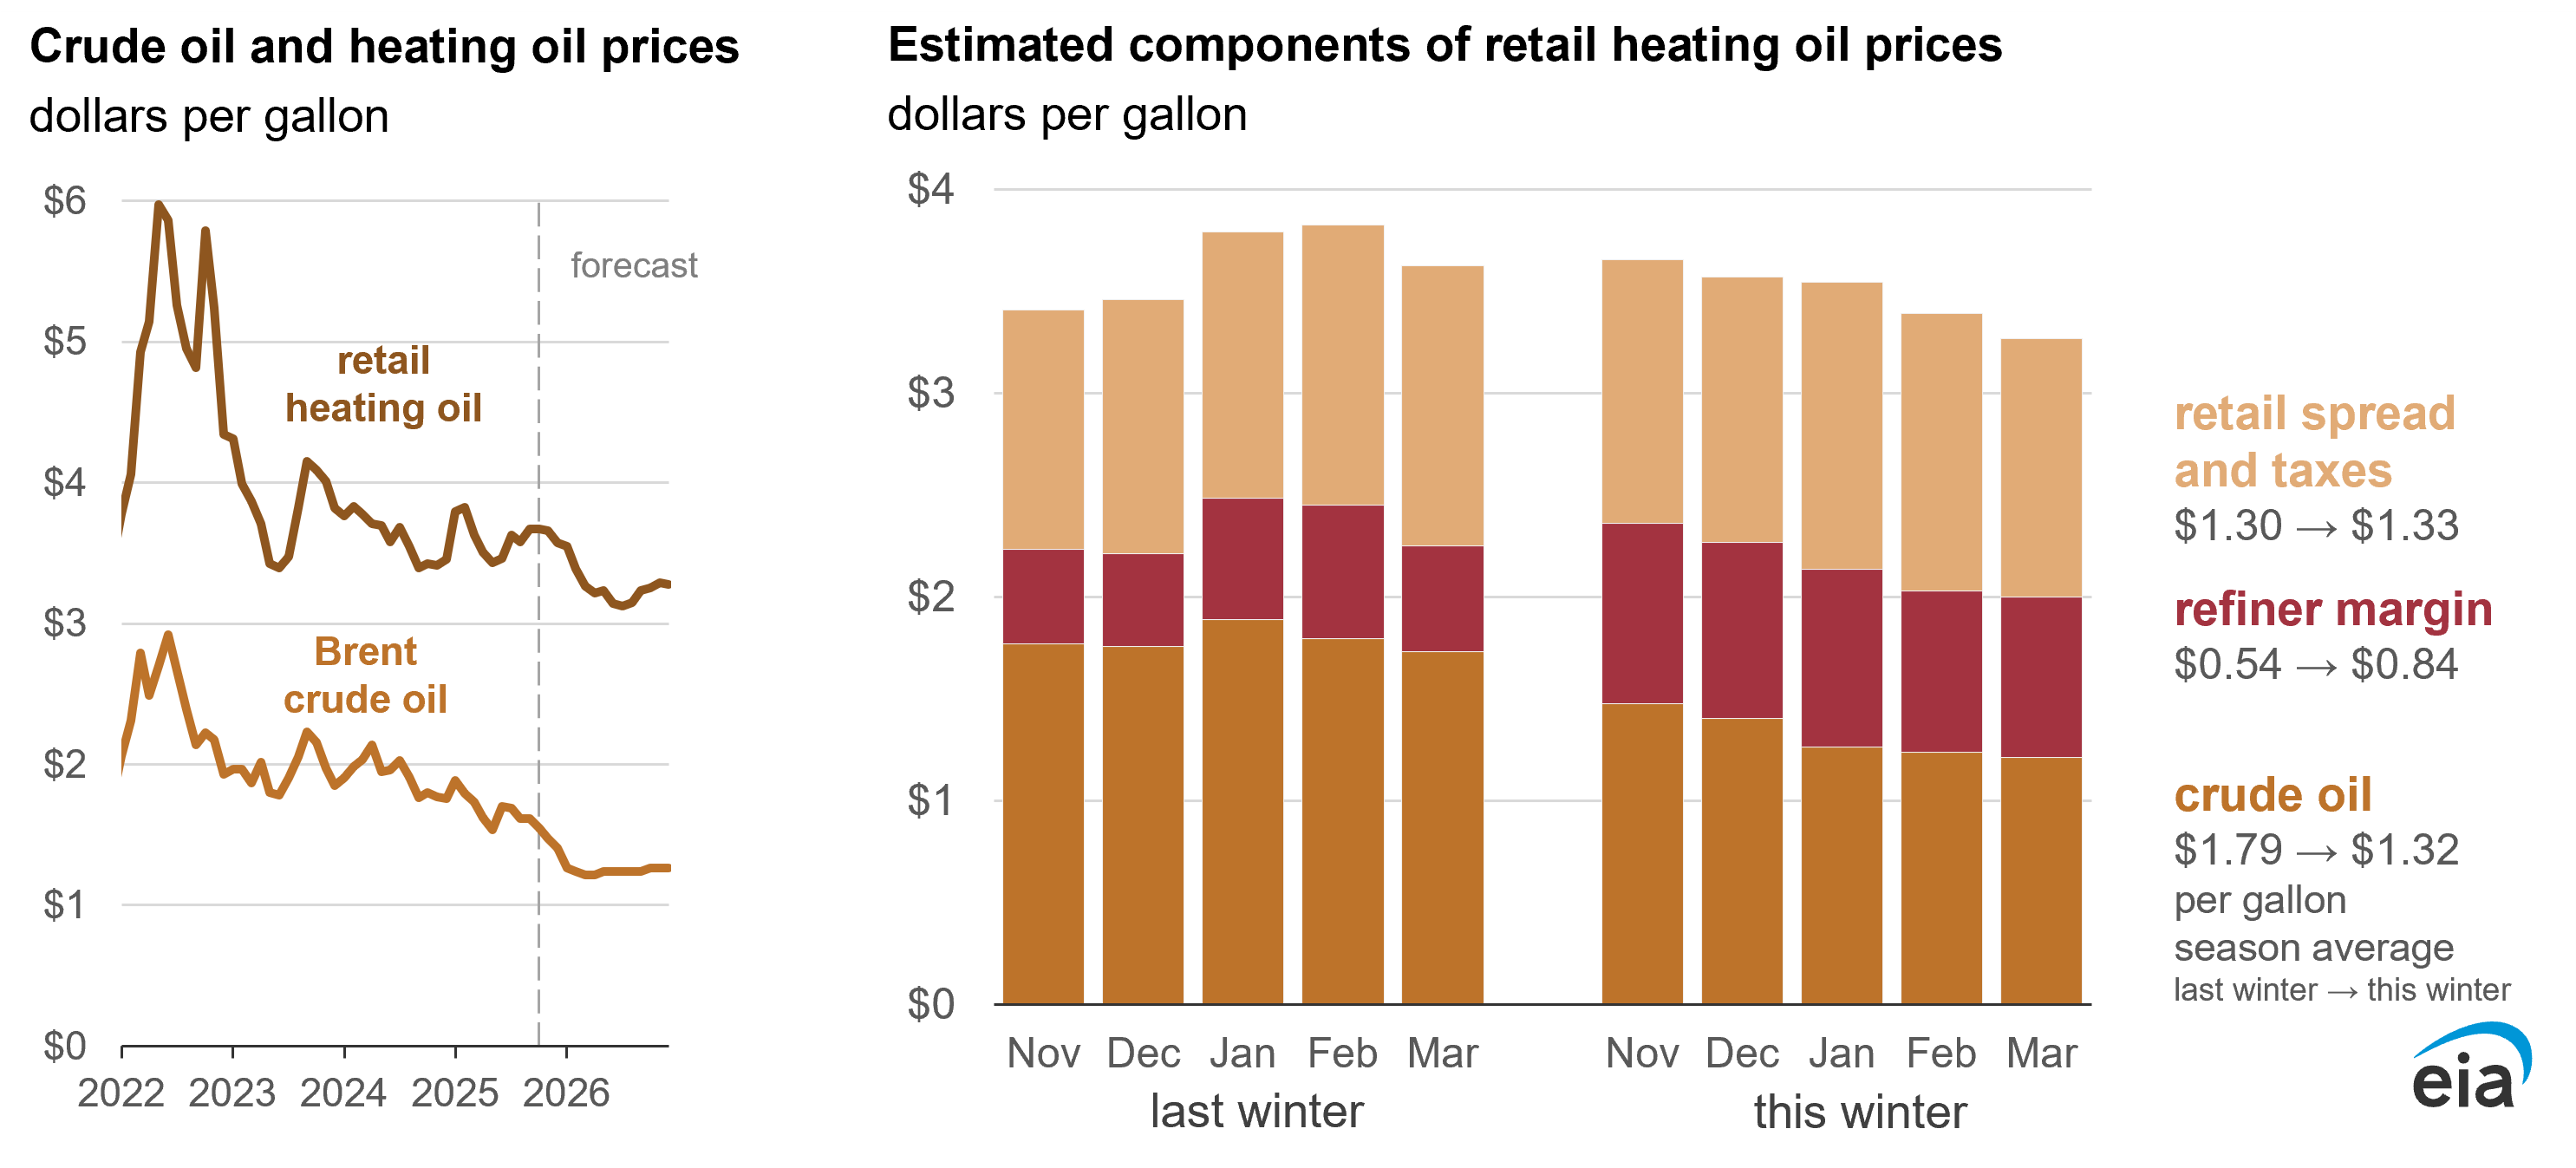
- We forecast retail heating oil prices will be lower this year because of lower crude oil prices.
- Residential heating oil consumption is highly concentrated in the Northeast, where we expect milder winter weather will contribute to lower heating oil expenditures.
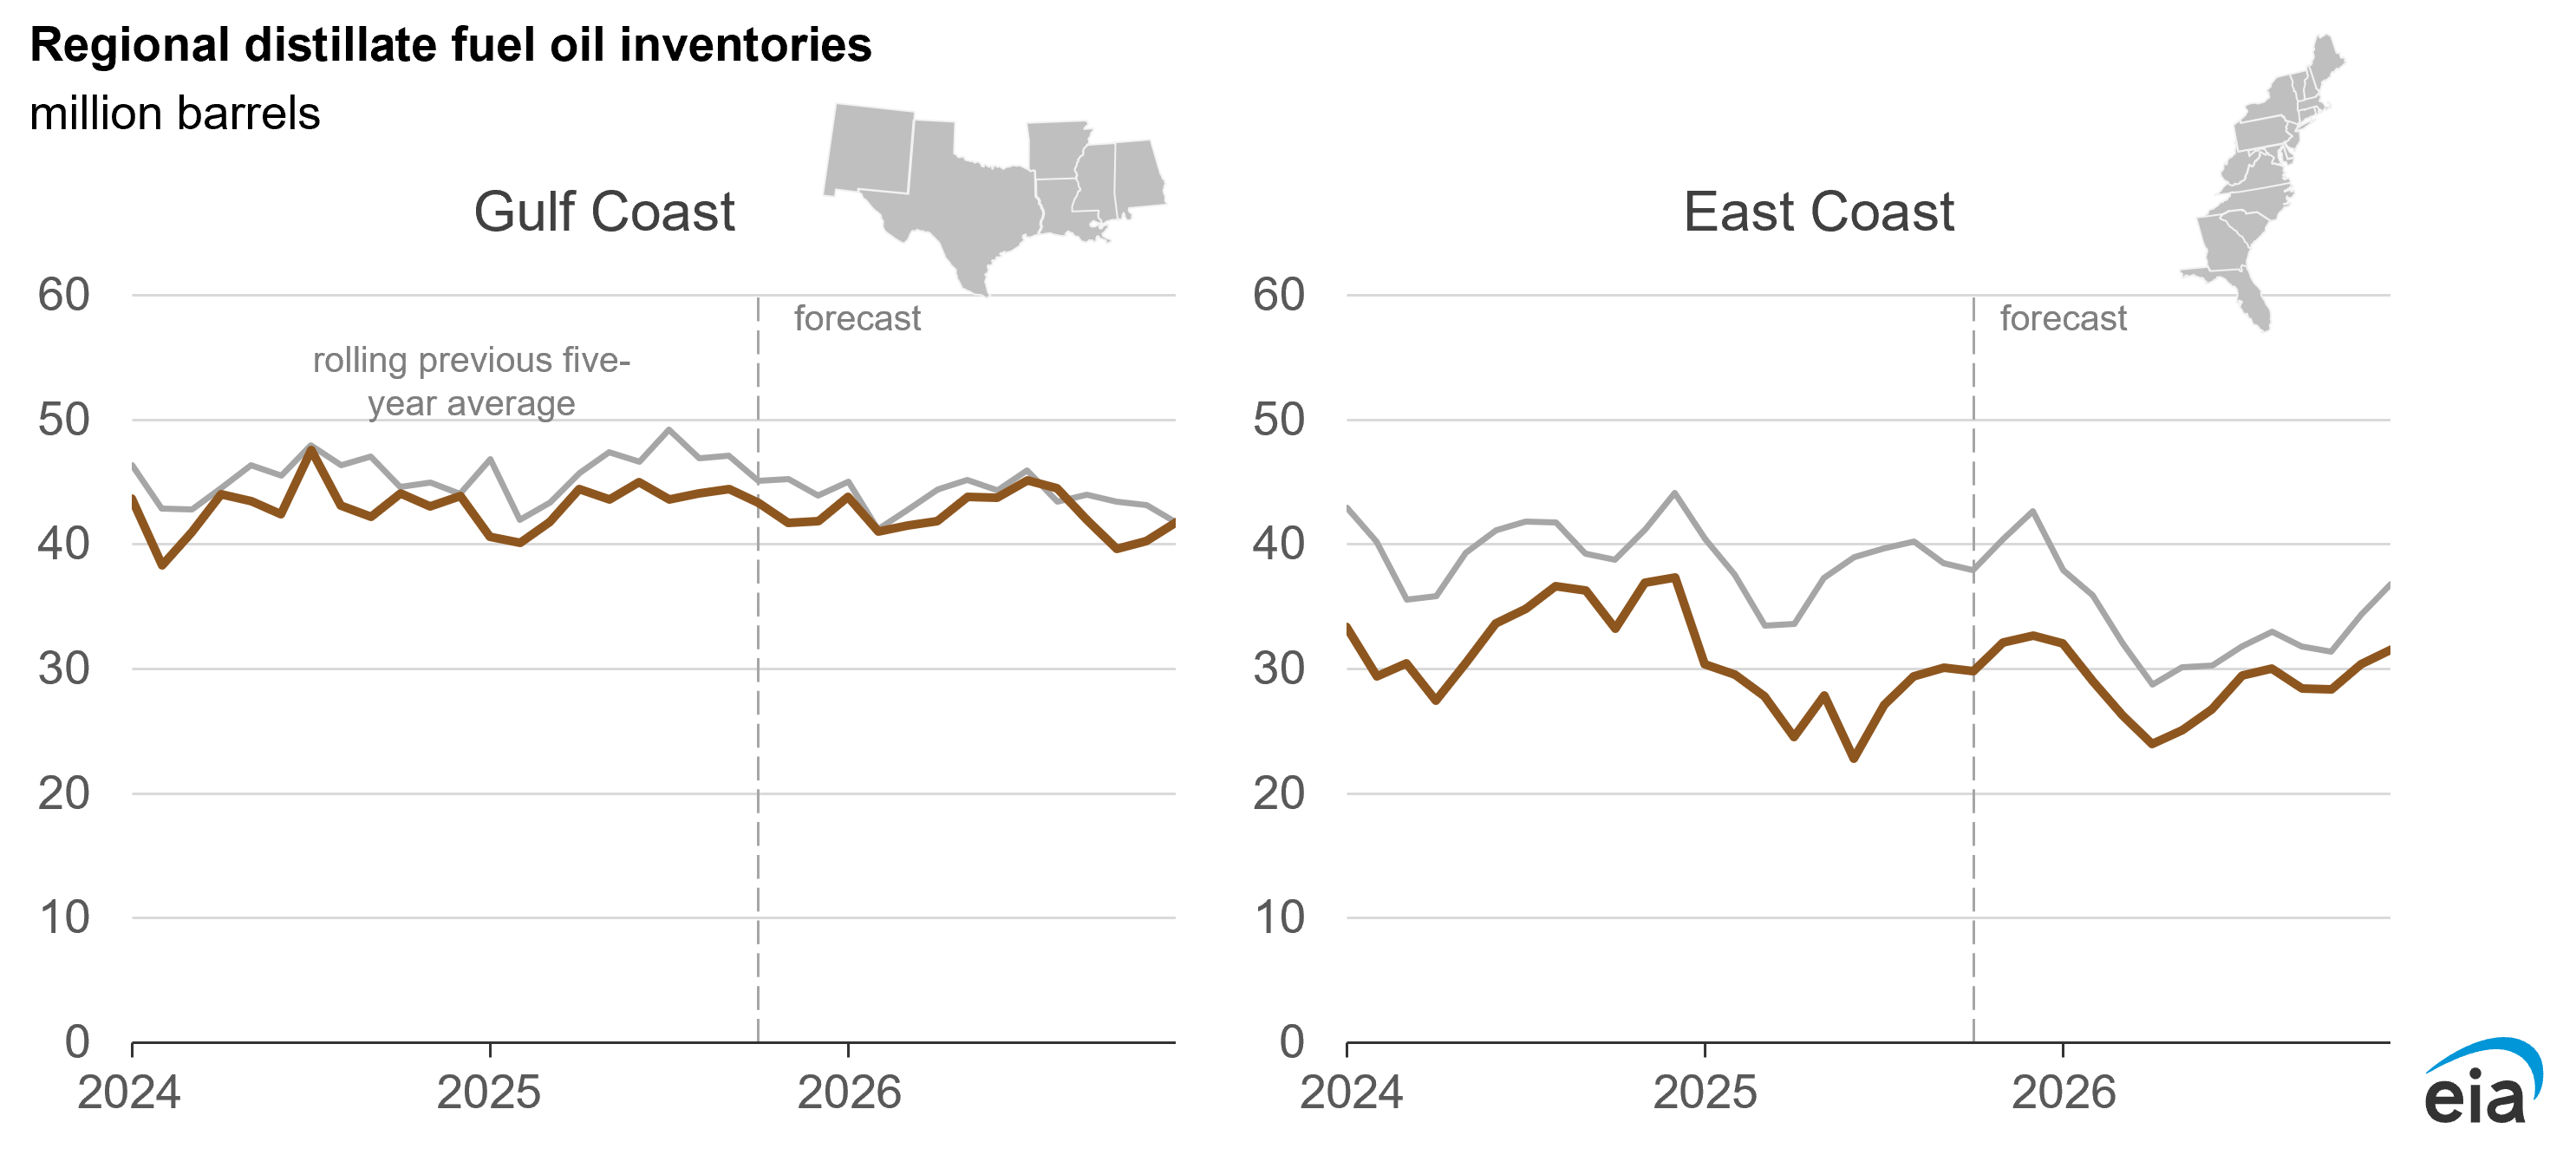
- Northeast inventories of distillate fuel oil are lower than they were last year, contributing to some uncertainty in our outlook, but we expect inventories will remain sufficient to supply the Northeast heating oil market.
Heating oil, a variation of distillate fuel oil or diesel, is the primary space heating fuel for 3% of U.S. households. We expect these homes will spend 8% less on heating oil this winter than last. More than 80% of the homes that use heating oil as their main heating fuel are in the Northeast.
Even though we publish heating oil consumption as a U.S. average, the lack of consumption outside of the Northeast means the U.S. average heating oil price is heavily weighted toward the Northeast and corresponds closely to the Northeast regional average price.
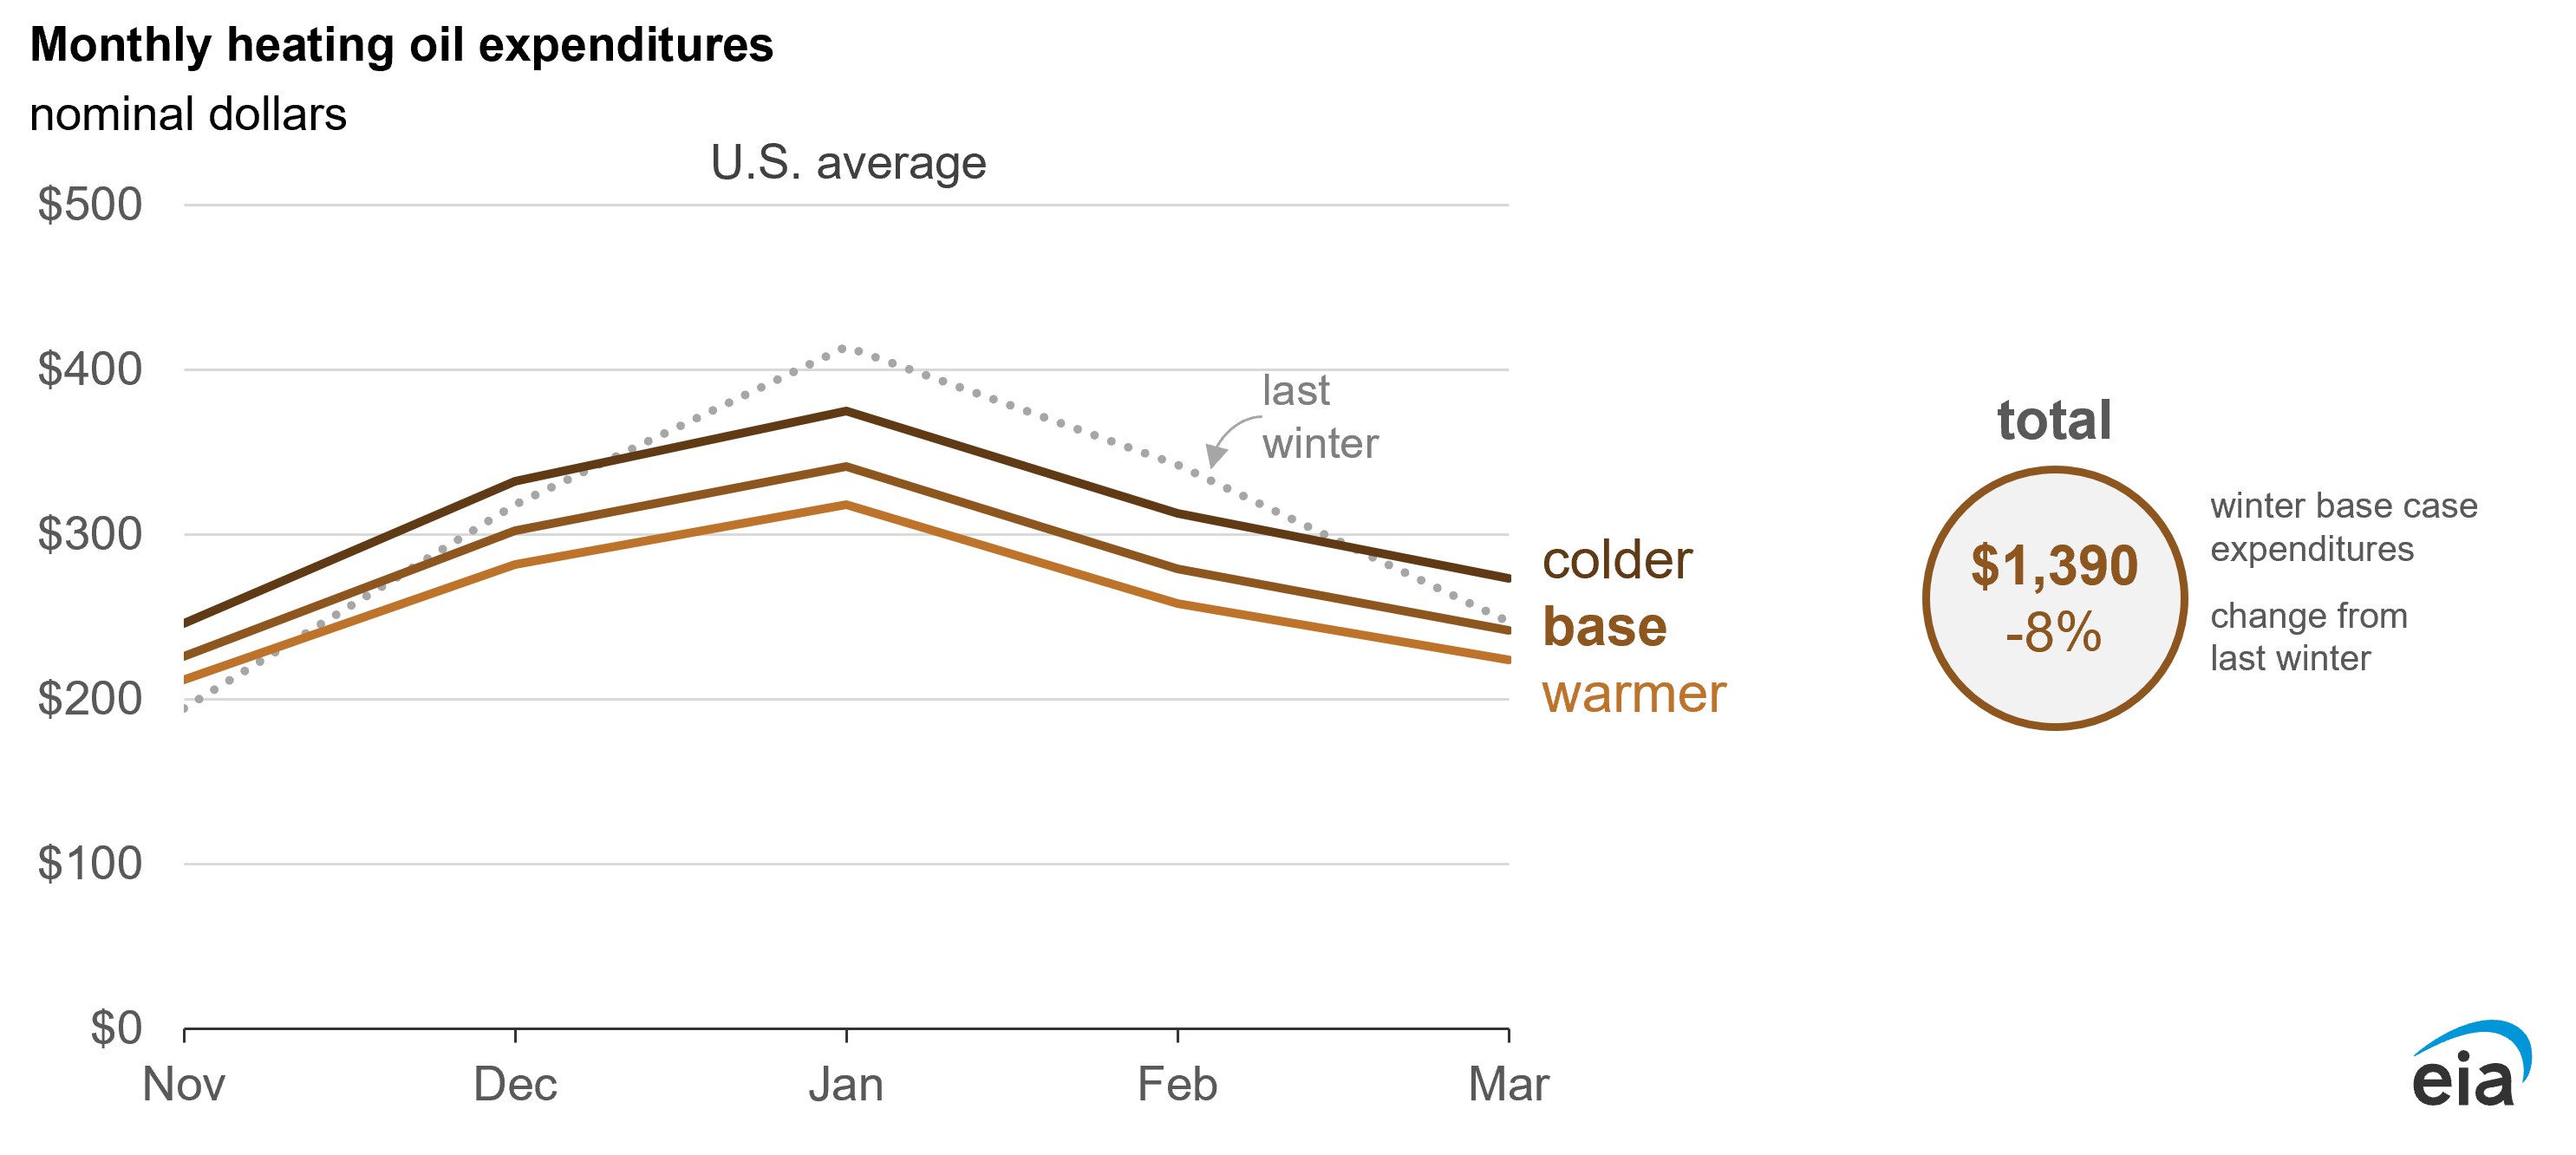
Lower heating oil prices and less heating oil consumption drive lower heating oil expenditures in our base case forecast. We estimate that U.S. households that use heating oil for space heating will consume an average of about 400 gallons (gal) of heating oil this winter, or 4% less than last winter. We expect heating oil prices will average about $3.50/gal, 4% less than last winter. At this price, homes that primarily heat with heating oil will spend an average of $1,390 this winter.
In our colder case, we expect the average household using heating oil as its primary heating fuel will consume 4% more heating oil than last winter. Although we expect heating oil prices will be 3% less than last winter in that case, the increase in consumption means heating oil expenditures would be 2% more than last winter. Conversely, in our warmer case, we estimate heating oil consumption would be 10% less than last winter and prices 5% lower, resulting in expenditures decreasing by 15% from last winter.
Lower heating oil prices reflect lower crude oil prices this winter. However, we forecast this drop in crude oil prices will be partly offset by wider crack spreads for distillate fuel. Crack spreads broadly indicate refiners' margins and are calculated by subtracting the price of crude oil from the wholesale price of a petroleum product. We expect crack spreads will increase this winter relative to last winter. For consumers, wider refining margins translate to higher prices for petroleum products.
Data values: U.S. Petroleum and Other Liquids Supply, Consumption, and Inventories
Inventories of distillate fuel oil on the East Coast (PADD 1) remain below the five-year average for this time of year. Although we expect refinery runs to decrease in line with seasonal trends, we don’t expect refinery maintenance that would delay production this winter.
The East Coast region has only 5% of the United States’ refining capacity and most of that capacity is concentrated in New Jersey and Pennsylvania. Additional supply of distillate in the Northeast generally comes by pipeline from elsewhere in the United States, especially from the U.S. Gulf Coast (PADD 3). In particular, the Colonial Pipeline system extends from the Gulf Coast to as far as New York Harbor. Imports from eastern Canada are also a crucial source of Northeast regional supplies, which enter the region through maritime imports into Boston and other coastal ports.
Data values: U.S. Petroleum and Other Liquids Supply, Consumption, and Inventories
Trends in heating oil prices tend to follow crude oil prices, which are subject to uncertainty associated with global petroleum markets. Possible changes in the outlook for crude oil prices or supply shortfalls on the global distillate market present a source of uncertainty that could contribute to higher-than-expected distillate prices. Any increase in global distillate prices is likely to translate to higher domestic heating oil prices.
Energy consumption methodology
The consumption values presented in this report are for all end uses associated with a home's main heating fuel. These consumption values are generally a subset of a household's total energy consumption except in homes that are all-electric homes.
We estimate household consumption and expenditures for space heating's and other end uses' portions based on information from our Residential Energy Consumption Survey (RECS). To develop our forecasts, we make several assumptions to convert annual RECS consumption data to monthly values, and we use monthly retail price forecasts available in our Short-Term Energy Outlook (STEO).
Data values: Table CE4.16: Annual household end-use expenditures by fuel in the U.S.—averages
Space heating: We used historical RECS information about the space heating consumption and weather for each fuel-region combination to estimate space heating consumption based on temperature. We assume heating consumption varies in proportion to heating degree days, so these consumption-per-degree-day values are allocated to the upcoming winter according to the number of forecasted heating degree days in each month.
Secondary heating: Although this report focuses on a home's main heating fuel, households may use multiple forms of heating equipment and even multiple heating fuels within a home. Many households use secondary equipment such as fireplaces and portable heaters. In situations where the fuel for secondary heating equipment is the same fuel used for main space heating, our estimates include both main and secondary heating. When the secondary fuel is different from the main fuel, our estimates only include consumption and expenditures for the main heating fuel.
Non-heating portion: The remaining portion of consumption—the part not associated with space heating—reflects all other consumption associated with a household's main space heating fuel in the winter months. For example, a household using natural gas as its main space heating fuel may also use natural gas for water heating, cooking, and clothes drying. For all fuels except electricity, these estimates are based on annual values converted to per-day rates and allocated to the 2024–25 winter according to the number of days in each month.
The remaining portion of consumption—the part not associated with space heating—reflects all other consumption associated with a household's main space heating fuel in the winter months. For example, a household using natural gas as its main space heating fuel may also use natural gas for water heating, cooking, and clothes drying. For all fuels except electricity, these estimates are based on annual values converted to per-day rates and allocated according to the number of days in each month.
For electricity, we subtracted air conditioning from the annual total—essentially assuming that all air conditioning occurs in April through October—and allocated the remaining consumption using the same approach described for non-electric fuels.
Effects of inflation
The prices and expenditures presented in this report are in nominal (not inflation-adjusted) terms. We assume inflation will average about 2% this winter based on forecasts for the Consumer Price Index from the S&P Global macroeconomic model we use in STEO. Given that rate of inflation, increases in prices and expenditures would need to be about 2% higher than the values reported to indicate increases beyond general inflation.
Comparisons across fuels
Readers should not assume that switching to another fuel with lower energy expenditures—as presented in this report—would necessarily result in lower expenditures for their household. Many factors complicate direct comparisons of the housing populations and their energy consumption and expenditures as presented in this report.
Even within the geographic regions presented in this report, the various heating fuels have different geographic distributions and therefore different exposure to weather conditions. For example, in the South, households heating with electricity experience milder winter weather on average than those heating with natural gas.
Energy consumption and expenditures also depend on household characteristics and energy efficiency—the insulation and air tightness of the home as well as the type of heating equipment and its operating efficiency. For example, an electric resistance heater used in a small, well-insulated home could consume less energy than an air source heat pump in a larger, drafty home.
Links to EIA's winter-related resources
EIA maintains several data series and products that can inform energy markets throughout winter.
For natural gas, we publish daily spot and futures prices and monthly residential natural gas prices by state. Our Weekly Natural Gas Storage Report captures changes in natural gas inventories, and these metrics are visualized in our Natural Gas Storage Dashboard. Our Natural Gas Weekly Update tracks price and consumption trends throughout the winter.
For propane and heating oil, our Heating Oil and Propane Update page provides wholesale and retail prices for several states. These prices are published weekly from October through March. Our Weekly Petroleum Status Report provides weekly inventory, production, and demand data series that are visualized on the Heating Oil and Propane Update page.
Specifically for propane, we provide a weekly briefing on propane inventory levels that offers more granular detail than the information in our Weekly Petroleum Status Report. This information will be updated weekly starting in November.
For electricity, our Hourly Electric Grid Monitor provides hourly information on electric demand and net electricity demand by source throughout the Lower 48 states. Our Electric Power Monthly compiles information on state-level retail electricity prices and demand. These series are also presented in our Electricity Data Browser.
We also publish a daily New England Dashboard that displays electricity, natural gas, and petroleum market metrics for the New England region.
Questions about the Winter Fuels Outlook can be sent to winterfuels@eia.gov.