
Daily natural gas spot prices in western United States exceed $50.00/MMBtu in December
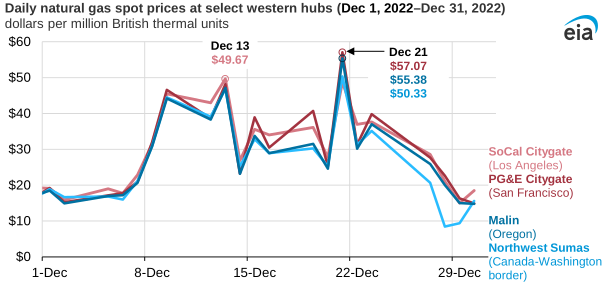
On December 21, 2022, daily natural gas spot prices at three major trading hubs in the western United States (Pacific Gas & Electric [PG&E] Citygate, Northwest Sumas on the Canada-Washington border, and Malin, Oregon) were higher than $50.00 per million British thermal units (MMBtu). These hub prices were higher than in any other market and averaged $48.12/MMBtu above the Henry Hub benchmark, which was $6.14/MMBtu on December 21. PG&E Citygate in Northern California and Malin, Oregon, the northern delivery point into the PG&E service territory, reported the highest natural gas spot prices since December 2000—in both real and nominal terms—according to pricing data from Natural Gas Intelligence. The price at Southern California (SoCal) Citygate was highest on December 13 at $49.67/MMBtu.
Several events occurring simultaneously in the West contributed to prices rising to these levels:
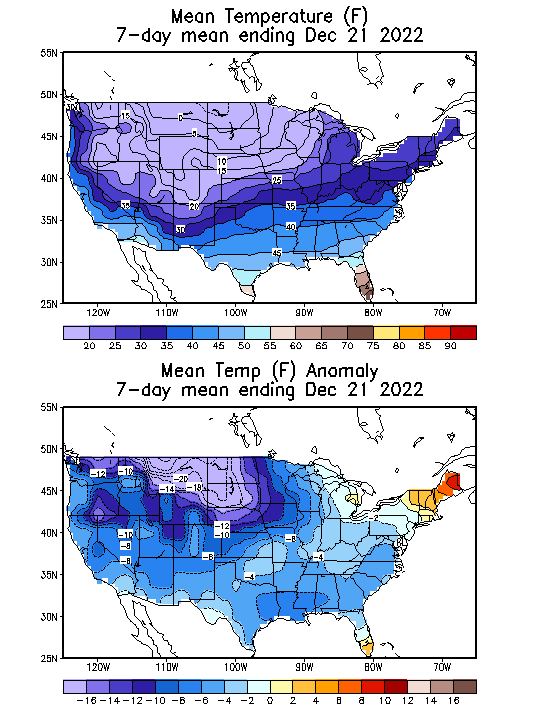
- Widespread, below-normal temperatures
- High natural gas consumption
- Lower natural gas imports from Canada
- Pipeline constraints, including maintenance in West Texas
- Low natural gas storage levels in the Pacific region
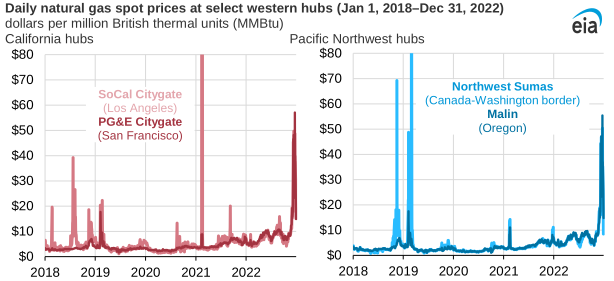
Note: Some prices exceeded the published range. The price at SoCal Citygate for February 12, 2021, averaged $144.00/MMBtu. The price at Sumas for March 1, 2019, averaged $161.33/MMBtu.
From the end of November to mid-December, below-normal temperatures stretched from Western Canada to California, leading to more demand for natural gas for heating. In the first three weeks of December, natural gas consumption in the residential and commercial sectors in the Pacific Northwest and California, combined, increased by 23% from the second half of November; in the electric power sector, natural gas consumption increased 14%, according to data from Point Logic.
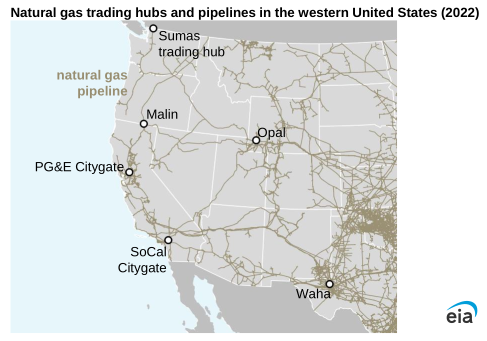
Natural gas supply did not keep pace with the increased demand. The western region receives most of its supply from other parts of the United States and Canada. Net natural gas flows from Canada dropped by 4% in the first three weeks of December compared with the second half of November, and 9% less natural gas was delivered from the Rocky Mountains.
Reduced pipeline capacity because of maintenance in West Texas led to less natural gas flowing west, raising Southern California natural gas prices. In addition, natural gas storage inventories in the Pacific that were 30% below their previous five-year average (as of December 16) also contributed to higher prices. In Northern California, PG&E’s injections to rebuild natural gas inventories over this past summer were lower than in summer 2021.
Principal contributor: Katy Fleury
Tags: natural gas, spot prices, Oregon, Northwest, Washington, California, states, West Coast, map