PADD regions enable regional analysis of petroleum product supply and movements
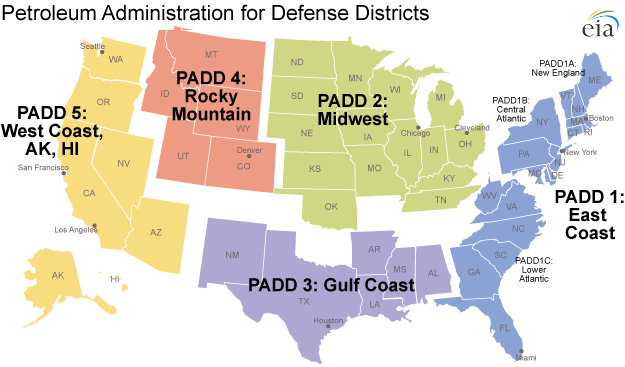
The Petroleum Administration for Defense Districts (PADDs) are geographic aggregations of the 50 States and the District of Columbia into five districts: PADD 1 is the East Coast, PADD 2 the Midwest, PADD 3 the Gulf Coast, PADD 4 the Rocky Mountain Region, and PADD 5 the West Coast. Due to its large population, PADD 1 is further divided into sub-PADDs, with PADD 1A as New England, PADD 1B the Central Atlantic States, and PADD 1C comprising the Lower Atlantic States. There are two additional PADDs (PADDs VI and VII) that encompass U.S. Territories (these are not pictured on the map). The PADDs help users of EIA's petroleum data assess regional petroleum product supplies.
During World War II the Petroleum Administration for War, established by an Executive order in 1942, used these five districts to ration gasoline. Although the Administration was abolished after the war in 1946, Congress passed the Defense Production Act of 1950, which created the Petroleum Administration for Defense and used the same five districts, only now called the Petroleum Administration for Defense Districts.
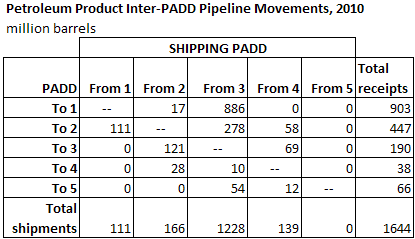
The PADDs also allow data users to analyze patterns of crude oil and petroleum product movements throughout the nation. During 2010 (the latest full year for which published data are available), the bulk of petroleum product pipeline movements took place among PADDs 1, 2, and 3 (see table below). More than half of the total U.S. inter-PADD product pipeline movements were from PADD 3 (an area with significant refining capacity) to PADD 1 (a major population center). By contrast, PADDs 4 and 5 show very small volumes entering and leaving by pipeline, with nothing leaving PADD 5.
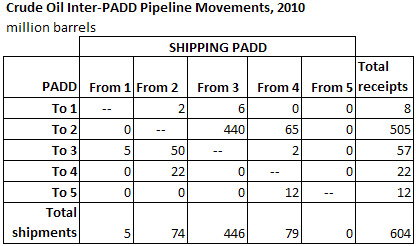
For crude oil, nearly three-quarters of the inter-PADD pipeline movements in 2010 were movements from PADD 3 to PADD 2 (see table below). These volumes include crude oil produced in the Gulf of Mexico and imports to the Gulf Coast region that move inland to refineries in PADD 2. The volume of crude oil moving by pipeline from PADD 3 to PADD 2 has steadily declined in recent years, as pipeline receipts of Canadian oil sands crude oil and increased production from North Dakota's Bakken formation have bolstered PADD 2 crude oil supplies. This increase in PADD 2 crude supplies has reduced their need for crude oil supplies from the Gulf Coast. The vast majority of the inter-PADD crude oil pipeline movements occur among PADDs 2, 3, and 4, with very little crude oil pipeline activity into or out of PADDs 1 and 5. Such crude oil and petroleum product movement patterns would be hard to discern without the availability of PADD-level data.
Download CSV Data
Download CSV Data
Tags: crude oil, liquid fuels, map, oil/petroleum, pipelines, states