Natural gas
Natural gas prices
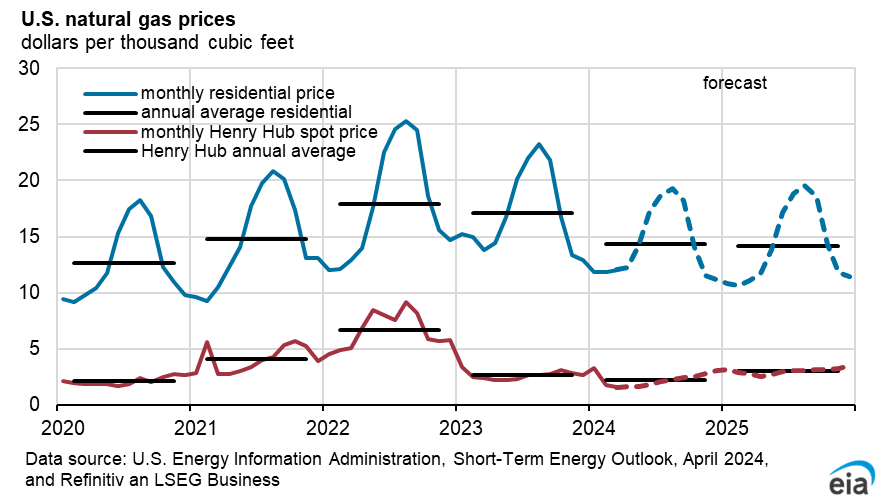
In May, the Henry Hub spot price for natural gas averaged $2.94 per million British thermal units (MMBtu), up 17 cents/MMBtu from April. Daily prices edged above $3.00/MMBtu towards the end of the month, as the season shifted into summer. The slight increase came as higher temperatures began to raise natural gas demand for electricity generation used for cooling, typically the main source of seasonal growth in summer natural gas consumption. These marginal price increases are attributable to steadily rising natural gas demand, which will likely continue into the third quarter of 2026.
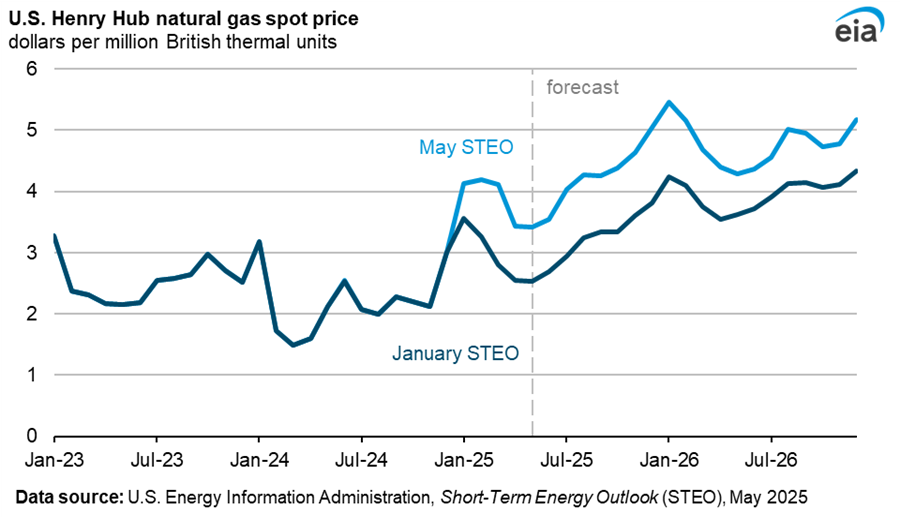
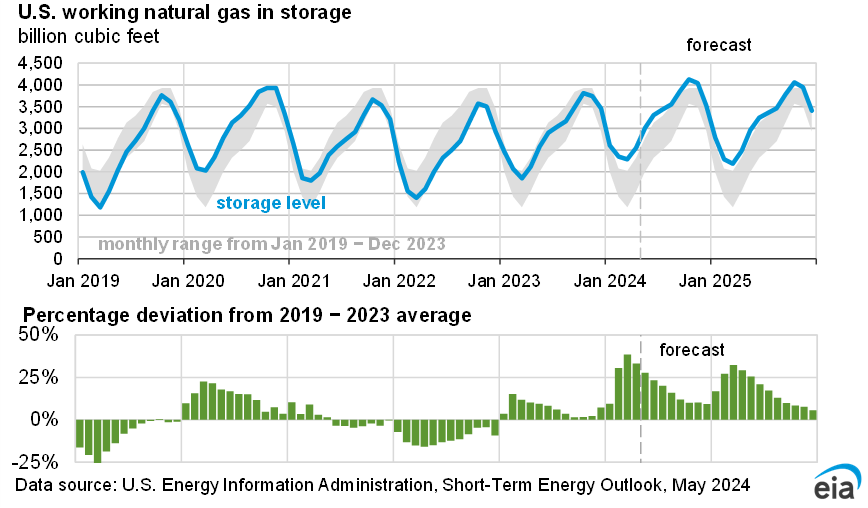
Despite expectations of rising demand, prices are lower in our outlook than we had forecast earlier this year. We now expect more natural gas will be held in inventory throughout the forecast than we had expected in the January 2026 STEO, largely because we have raised our forecast for natural gas production. The price curve retains the same general shape but has been translated vertically downward.
With more natural gas in storage, we have lowered our expectations for Henry Hub prices by $1.13/MMBtu for 2027, compared with our January STEO. Crude oil prices increased significantly in the first half of 2026 (1H26), and we expect that this will encourage additional oil production, concurrently producing more associated natural gas. With more production, we lowered our price forecast for 2027. We now expect the Henry Hub spot price will average about $3.34/MMBtu in 2H26 and $3.46/MMBtu in 2027.
Natural gas production
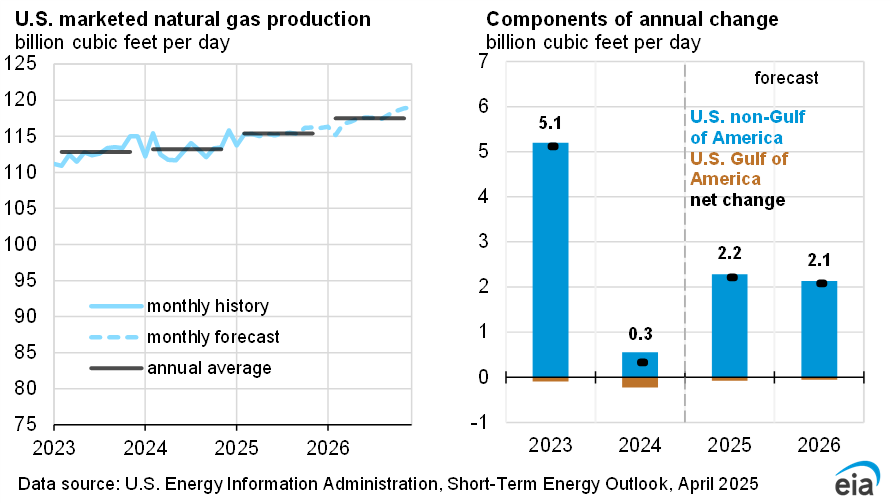
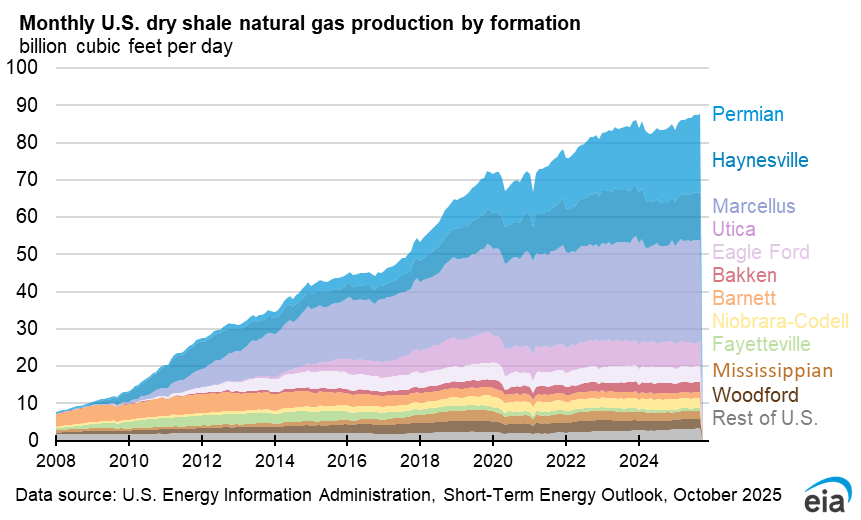
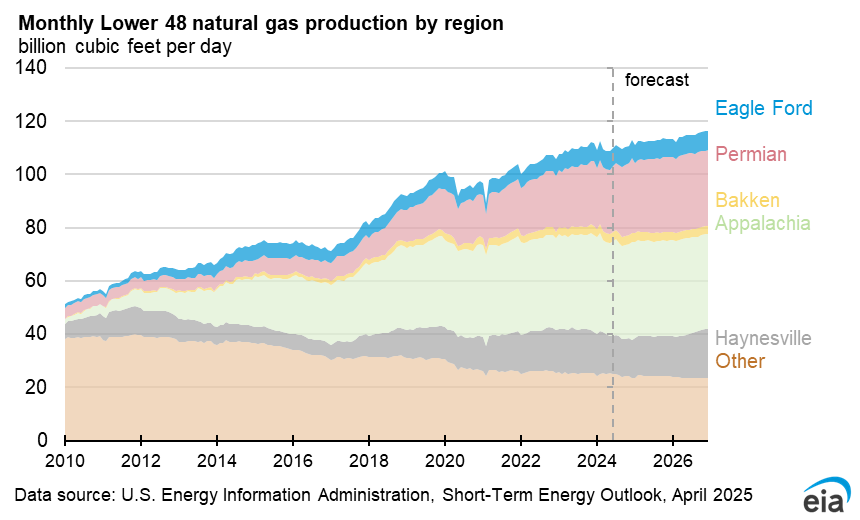
U.S. marketed natural gas production in our forecast grows by 3.3% in 2026, or about 3.9 billion cubic feet per day (Bcf/d), and by an additional 2.5% in 2027. We now expect the United States will produce 4.6 Bcf/d more natural gas in 2027 than we were forecasting in our January STEO. This upward revision is almost entirely the result of higher associated natural gas in the Permian region than we had previously expected.
Natural gas production growth is not limited to the Permian, but the Permian region drives most of the increase between our January and June forecasts. We also expect natural gas production growth in the Haynesville region, where production is more directly tied to natural gas prices and demand from U.S. Gulf Coast LNG export facilities. Together, these regions produce enough natural gas to keep inventories above the five-year average and limit upward pressure on Henry Hub prices.