Global oil markets
Global oil prices
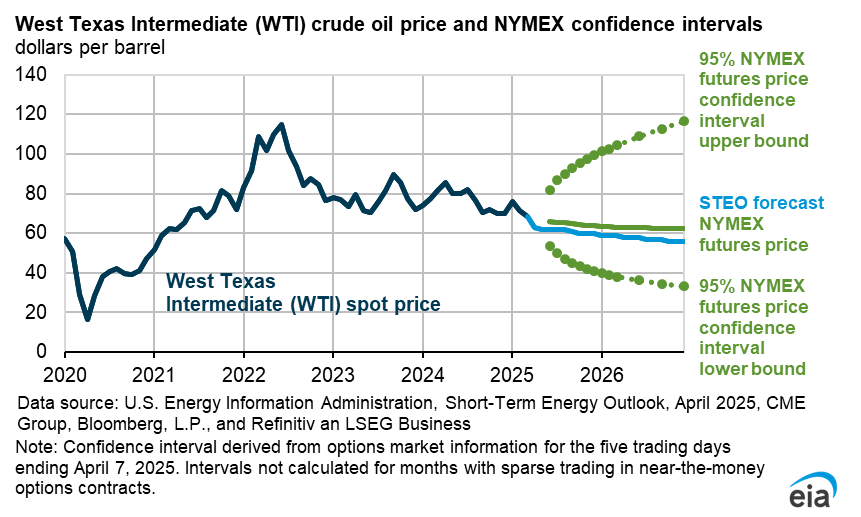
The Brent crude oil spot price averaged $64 per barrel (b) in May, $4/b lower than in April and $17/b lower than at the same time last year. Crude oil prices fell for the fourth consecutive month in May, driven by rising global oil inventories that have resulted from slowing global oil demand growth and the accelerated unwinding of OPEC+ voluntary production cuts, which began in April. On May 31, OPEC+ members agreed to a third month of planned production increases in July, with the potential for revisions pending market conditions. These factors contribute to our expectation that global oil production will exceed consumption over the forecast period, causing global oil inventories to build and putting downward pressure on oil prices. We expect Brent crude oil prices will average $66/b this year and $59/b next year.

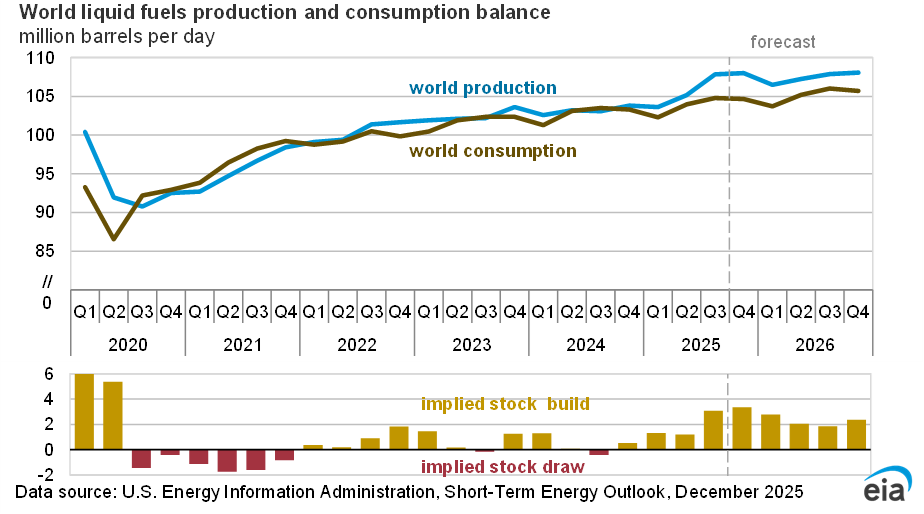
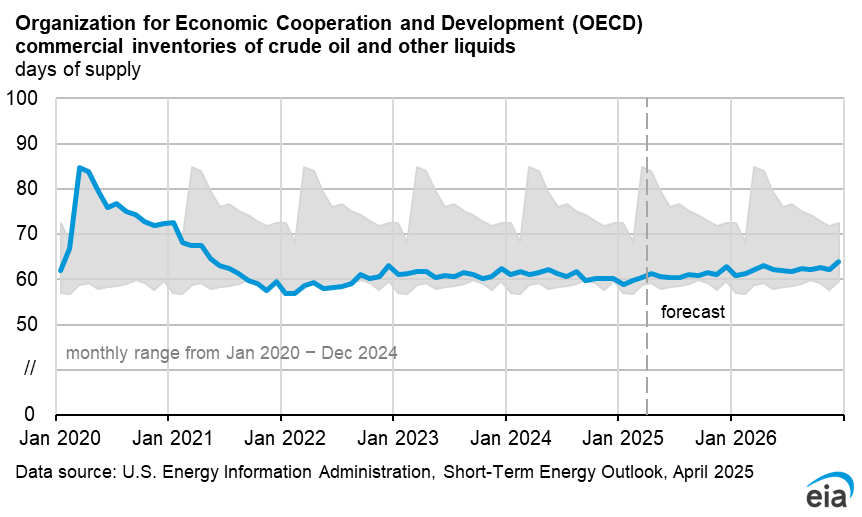
Global oil inventories increased over the first five months of 2025 and will continue to grow significantly over the forecast period. We expect they will increase by an average of 0.4 million barrels per day (b/d) for the remainder of the year. We expect global oil inventory builds will average 0.8 million b/d in 2025, 0.4 million b/d higher than in last month’s STEO. For the second half of the year, we expect that slowing global oil production growth—led by relatively flat U.S. crude oil production—and rising oil consumption growth mean builds will moderate to 0.6 million b/d next year, with markets moving towards balance.
Global inventory builds in 2025 are higher in this month’s STEO than last due to a combination of lower oil demand in the OECD in 2025 and increased supply growth from both OPEC+ countries and from countries outside of the group. Although the recent OPEC+ announcement added near-term supply to oil balances in our forecast, we made additional upward revisions to our Kazakhstan production forecast to accurately account for recent production levels from the Tengiz field. We also revised our forecast for Brazil because the Bacalhau Floating Production, Storage, and Offloading (FPSO) vessel is set to begin earlier than we had previously assumed in our forecast.
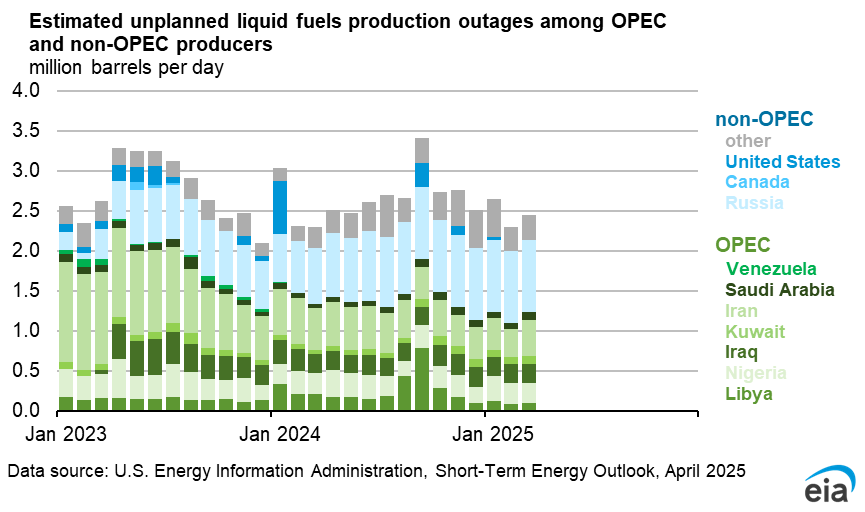
Significant uncertainty remains in our price forecast. Although we do not currently forecast any major supply disruptions, oil supply risks remain. Wildfires around Canada’s major oil sands facilities in Alberta, elevated tensions in the ongoing Russia-Ukraine conflict, as well a potential force majeure on oil exports in Libya have the potential to disrupt supply. Another source of uncertainty is the willingness and ability of OPEC+ members to coordinate future production targets in the face of falling oil prices and increasing oil supply from sources outside of OPEC+.
In addition, uncertainty around the status of ongoing trade negotiations between the United States and its trading partners could greatly affect oil prices. The status of sanctions on Russia and Iran remains uncertain, as does future development around Venezuelan oil assets, which have the potential to influence trade flows and affect oil prices.
Global oil production and consumption
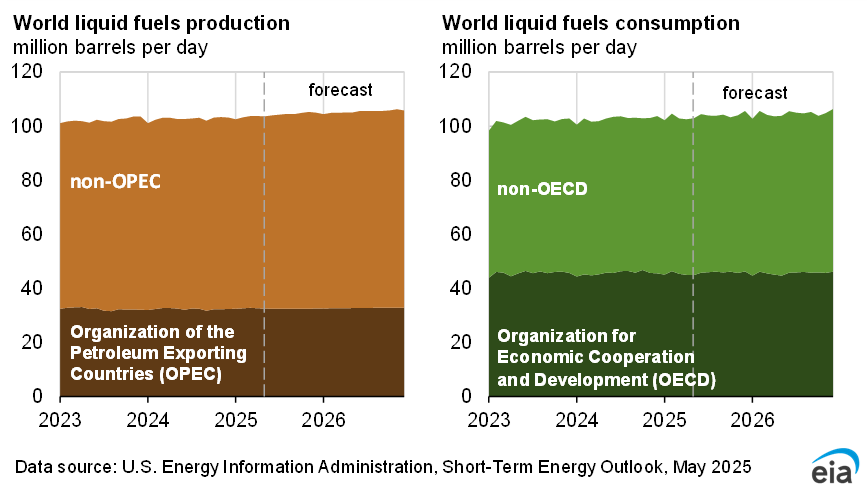
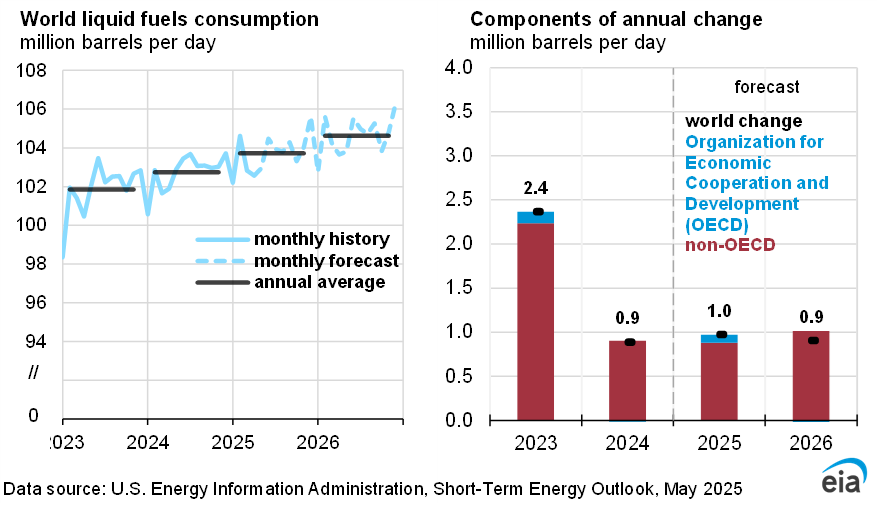
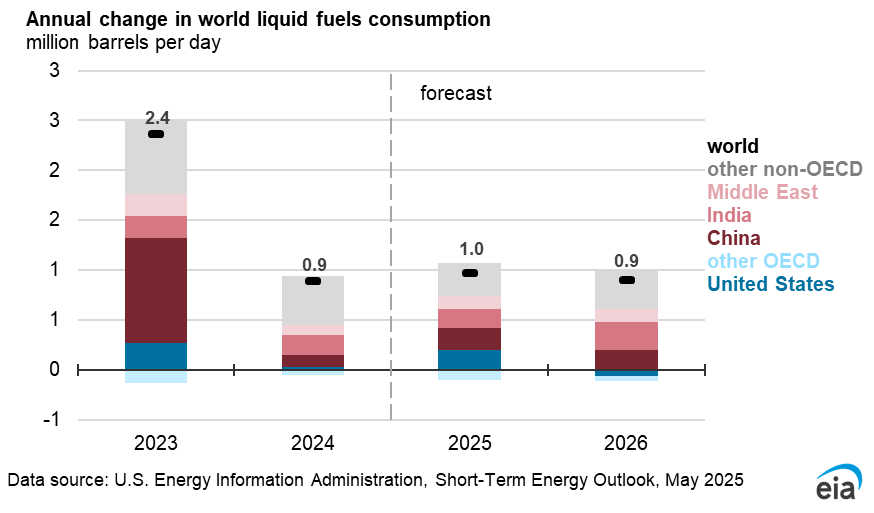
Oil consumption growth in our forecast continues to be less than the pre-pandemic trend. Forecast global liquid fuels consumption increases by 0.8 million b/d in 2025 and 1.1 million b/d in 2026, driven primarily by demand from non-OECD countries. Total non-OECD consumption grows by 0.9 million b/d in 2025 and 1.0 million b/d in 2026, while OECD consumption is largely unchanged over the forecast.

We expect India will increase its consumption of liquid fuels by 0.2 million b/d in 2025 and 0.3 million b/d in 2026, compared with an increase of 0.2 million in 2024, driven by rising demand for transportation fuels. We forecast China’s liquid fuels consumption will grow by 0.2 million b/d in both 2025 and 2026, up from an increase of 0.1 million b/d in 2024.
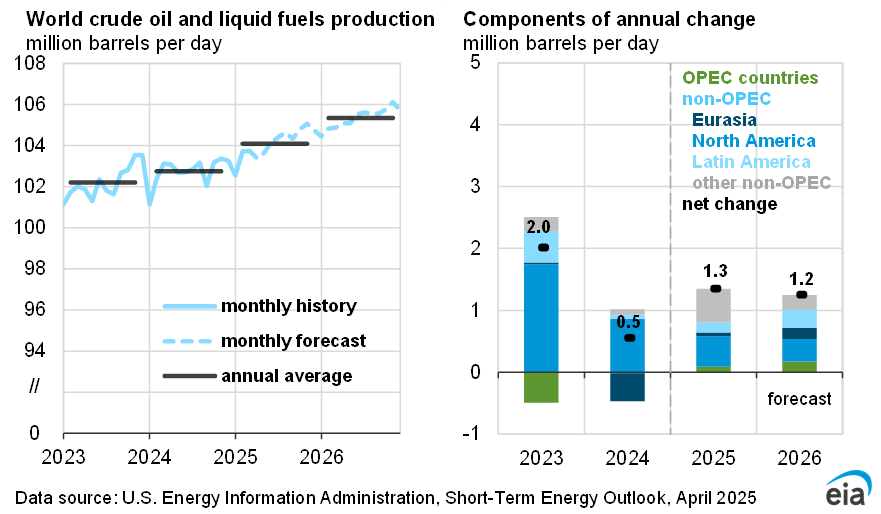
The planned increases to OPEC+ production combined with supply growth outside of the group continue to drive strong global liquid fuels production growth in our forecast. Global liquid fuels production increases by 1.6 million b/d in 2025, 0.2 million b/d higher than in last month’s STEO, before increasing by 0.8 million b/d in 2026.

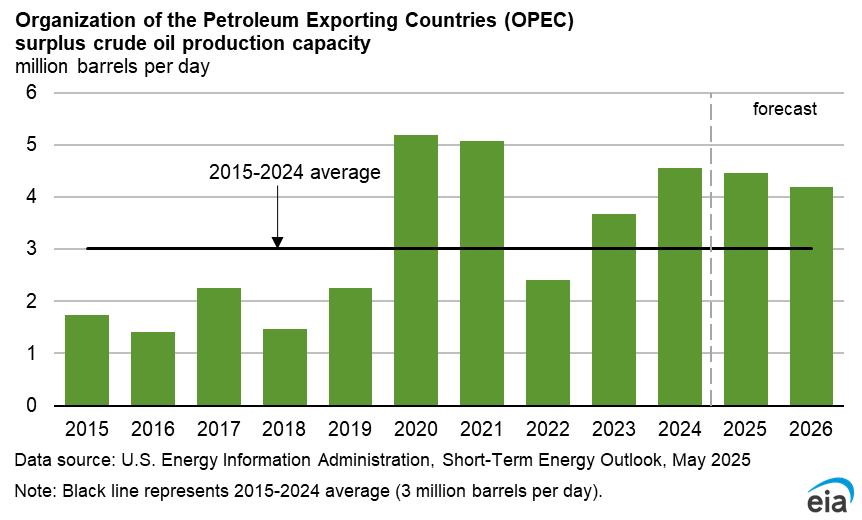
Although OPEC+ recently announced its third consecutive planned monthly crude oil production increase for July 2025, we still anticipate OPEC+ members will produce below the current target path to limit increases in global oil inventories and attempt to support falling prices. We expect OPEC+ will increase its crude oil production by 0.3 million b/d this year, compared with a decrease of 1.4 million b/d in 2024, before increasing by 0.5 million b/d in 2026.
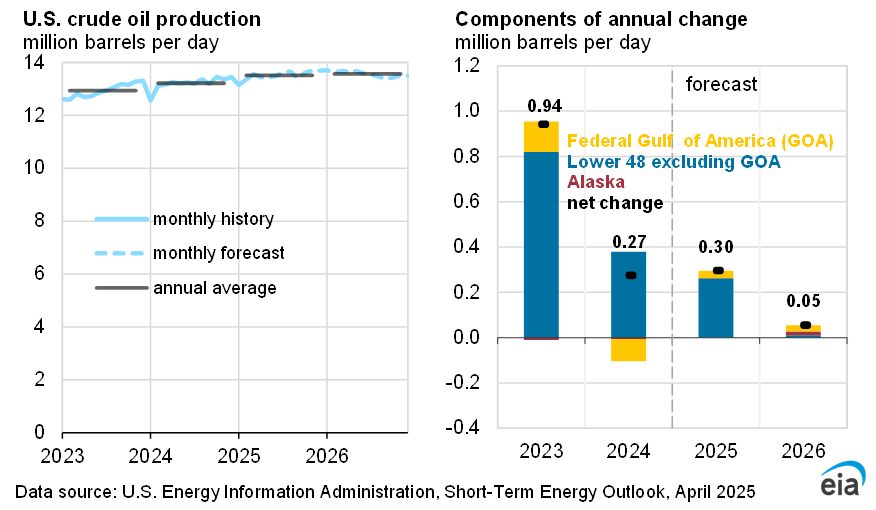
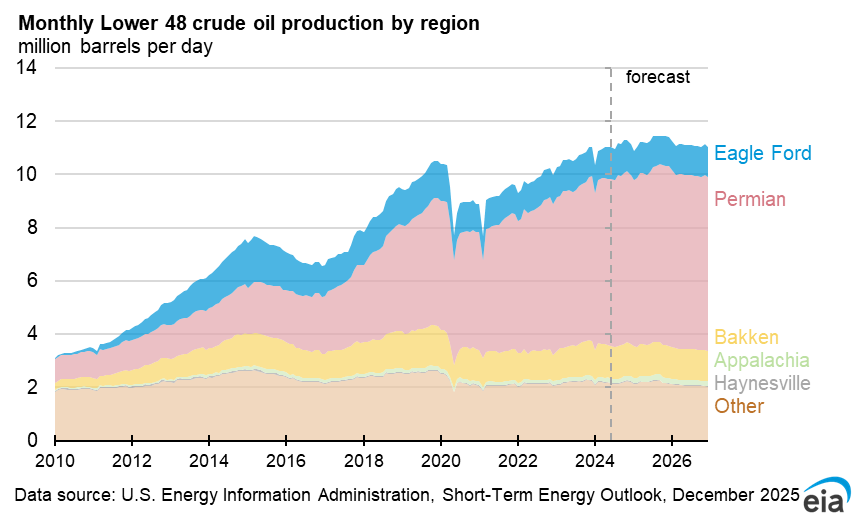
We expect countries outside of OPEC+ will drive global liquid fuels production growth this year, increasing production by 1.1 million b/d. However, OPEC+ drives growth next year in our forecast, as Non-OPEC+ growth in our forecast slows to 0.2 million b/d, with growth from Brazil, Guyana, and Canada being partly offset by a slight drop in U.S. production.