Release Date: July 18, 2023
STEO Perspectives: How do hurricane-related outages affect gasoline production and prices?
Hurricanes can significantly disrupt U.S. offshore crude oil production as well as refining activity. We estimate a high-impact hurricane event this year could result in a temporary loss of monthly offshore crude oil production of about 1.5 million barrels per day (b/d) and a nearly equivalent temporary loss of refining capacity. Outages on that scale could increase monthly average U.S. retail gasoline prices by between 25 cents per gallon and 30 cents per gallon. These pricing effects diminish over time. To do this analysis, we considered the results of a high-impact hurricane event and compared those results to the Base case in our Short-Term Energy Outlook (STEO). Although our STEO forecasts through 2024, we only analyzed the near-term effects of a potential disruption.
Case Design
Our Base case in this analysis assumes a level of disrupted crude oil production in the U.S. Federal Offshore Gulf of Mexico (GOM) in line with an average hurricane season. We also generated a side case that assumes a hurricane season with a higher-than-average impact on GOM production. This High Impact case also includes assumptions for temporary outages in U.S. petroleum refining. Hurricanes typically affect refinery activity for a shorter time period than they do offshore crude oil production, and this is reflected in our analysis.
Base case
The National Oceanic and Atmospheric Administration (NOAA) defines the Atlantic hurricane season as June through November, and we use this time frame for our STEO GOM model assumptions of hurricane disruptions in every STEO forecast.
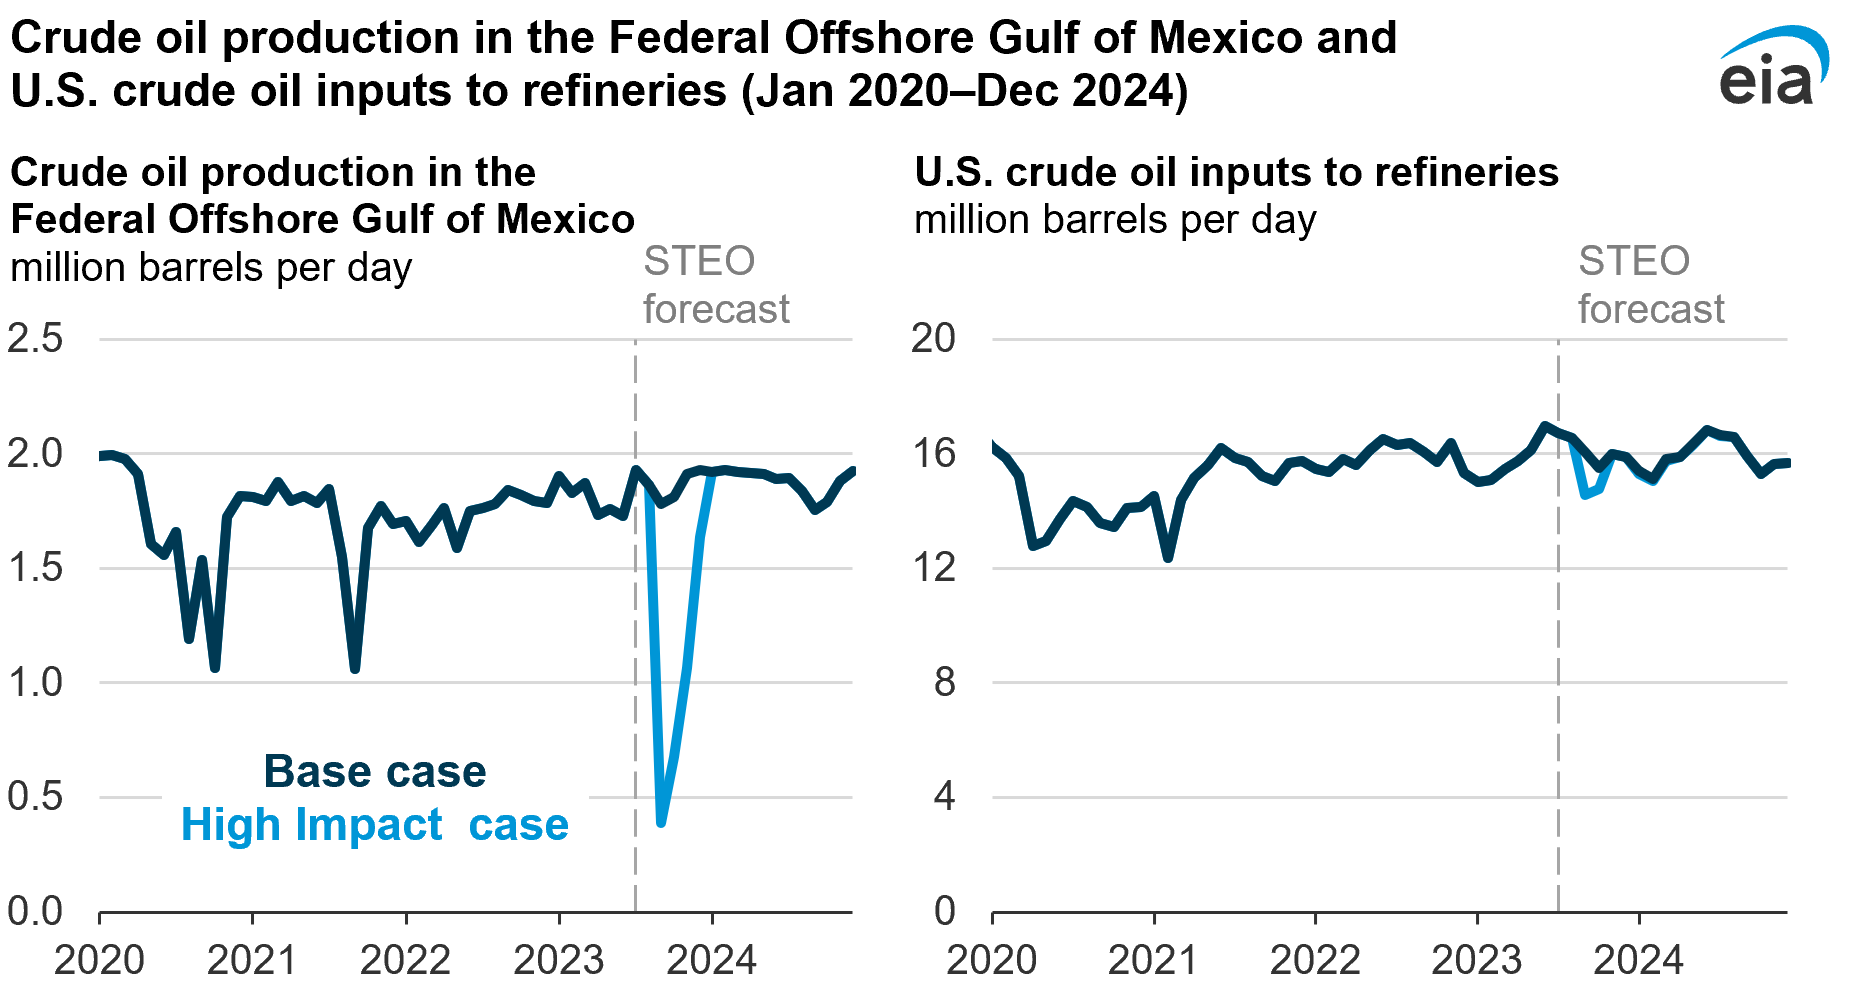
In the Base case, we assume that some percentage of GOM crude oil production will be offline during each month of hurricane season, based on the average percentage of offline monthly production during the previous 10 hurricane seasons (2013–2022). In last month’s STEO, we expected outages for the month of June (an assumed 1% of GOM production), but because June 2023 passed without any hurricane-related outages, we removed the assumed June outages from both cases in this analysis.
Assumed impacts of hurricane-caused disruptionsthousand barrels per day
| Reductions in Gulf of Mexico crude oil production | Reductions in crude oil inputs to U.S. refineries | |||
|---|---|---|---|---|
| Month | Base case | High Impact case | Base case | High Impact case |
| July | 20 | 20 | 0 | 0 |
| August | 80 | 80 | 0 | 0 |
| September | 150 | 1,500 | 0 | 1,500 |
| October | 120 | 1,300 | 0 | 750 |
| November | 20 | 900 | 0 | 0 |
| December | 0 | 300 | 0 | 0 |
For refining, we forecast in our Base case that U.S. refinery gross inputs will average 15.9 million b/d from July through October, or 89% utilization of U.S. refining capacity. Our Base case assumes seasonal declines in refining activity heading into the fall because of reduced demand from summer driving patterns. It does not explicitly assume outages because of hurricane activity. Many refiners schedule maintenance during September and October, seasonally reducing refinery operations. Our model accounts for both factors by using a monthly seasonality variable.
High Impact case
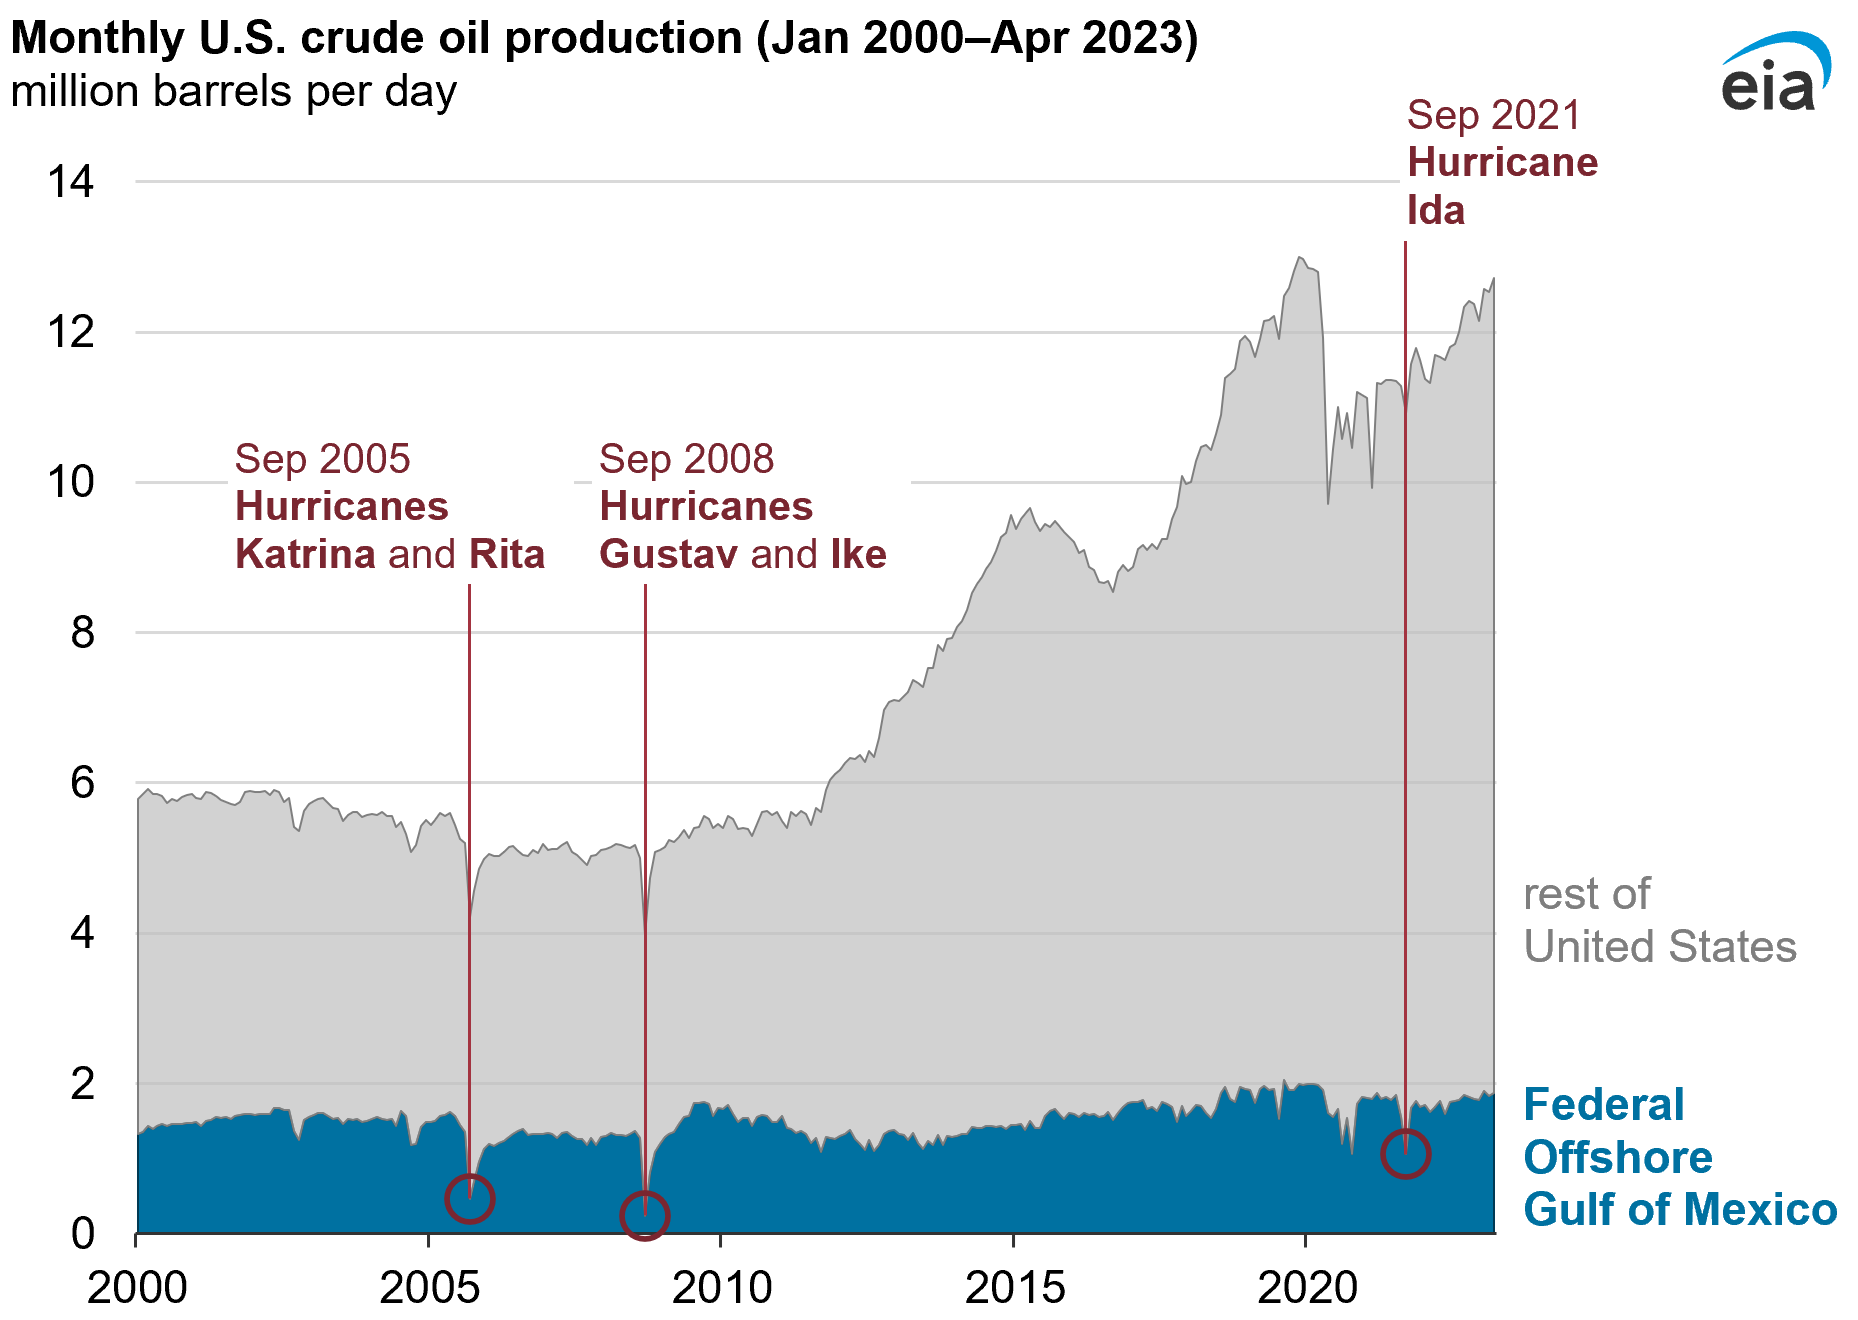
To develop our assumptions for hurricane-related GOM production outages, we analyzed the effects of several past hurricane seasons. Hurricanes Katrina and Rita in 2005 and Hurricanes Gustav and Ike in 2008 disrupted GOM production and inputs to refineries the most in terms of both volumes taken offline and in duration of impact.
Data values: Federal Offshore Gulf of Mexico Field Production of Crude Oil
Typically, hurricane disruptions affect GOM production for a few weeks or less. However, if damage to infrastructure such as platforms or pipelines occurs, the outages can last longer. In the case of Hurricanes Katrina and Rita, GOM production was disrupted for 10 months, from August 2005 through June 2006, according to the Bureau of Safety and Environmental Enforcement (BSEE). After Hurricanes Gustav and Ike, BSEE reported GOM production outages lasting six months, from September 2008 through February 2009.
We set a peak impact of 80% of GOM production to be taken offline in September (the peak of the Atlantic hurricane season) in the High Impact case, based on our assessment of how past high-impact hurricane seasons have affected GOM production. GOM production outages last through December in this case—reflecting the possibility of damage to production infrastructure—and gradually improve until no outages remain in January.
The assumed outages in the High Impact case result in 2023 annual average GOM crude oil production of 1.5 million barrels per day (b/d), or about 300,000 b/d less production than in our Base case (1.8 million b/d). A volume of 300,000 b/d represents 2% of our forecast 2023 total U.S. crude oil production.
For refining, we also reviewed historical examples of active hurricane seasons to identify what a significant disruption to U.S. refining might look like. Although a hurricane can reduce a significant portion of refining capacity for days or weeks, the decline over an entire month is considerably lower because refiners affected by a hurricane can often resume operations at or near their previous rate within a few days, absent significant unit damage. Because hurricanes have affected offshore production and refining in different ways historically, we developed independent assumptions surrounding the effects in the High Impact case.
The most common impacts of hurricanes are precautionary refinery shutdowns in the affected regions, but units can experience longer-term outages if they have been flooded or otherwise damaged. As a recent example, damage sustained at the Phillips 66 Alliance refinery complex during Hurricane Ida in 2021 led to the decommissioning of that facility.
For the High Impact case, we modeled a 15% reduction in regional refining capacity on the U.S. Gulf Coast, or 8% of total U.S. refining capacity for one month, starting in September. The September disruption amounts to 1.5 million b/d less crude oil inputs to refineries compared with the Base case. This reduction is nearly equivalent to 40% monthly average utilization for refineries in the Houston/Galveston Bay region, or the complete shutdown of all refineries in the New Orleans area for a month. We assume the impact of the disruption is halved in October (750,000 b/d offline) and resolved entirely by November. The change in Gulf Coast crude oil production between the base case and the High Impact case does not contribute to any further impact on refinery inputs in the High Impact case.
In addition to the impact on refining, we use a -0.24 to -0.36 global price elasticity to model a price response to refiner gasoline prices for resale, based upon the value of gasoline production taken offline in the outage. Elasticity is an economic term that describes the degree to which prices respond to changes in supply or demand. It is combined with the change in volume of supply lost between scenarios, relative to estimated global gasoline consumption, to determine the impact on prices. This price effect is determined exogenously (outside of the STEO model) based on the modeled gasoline production value.
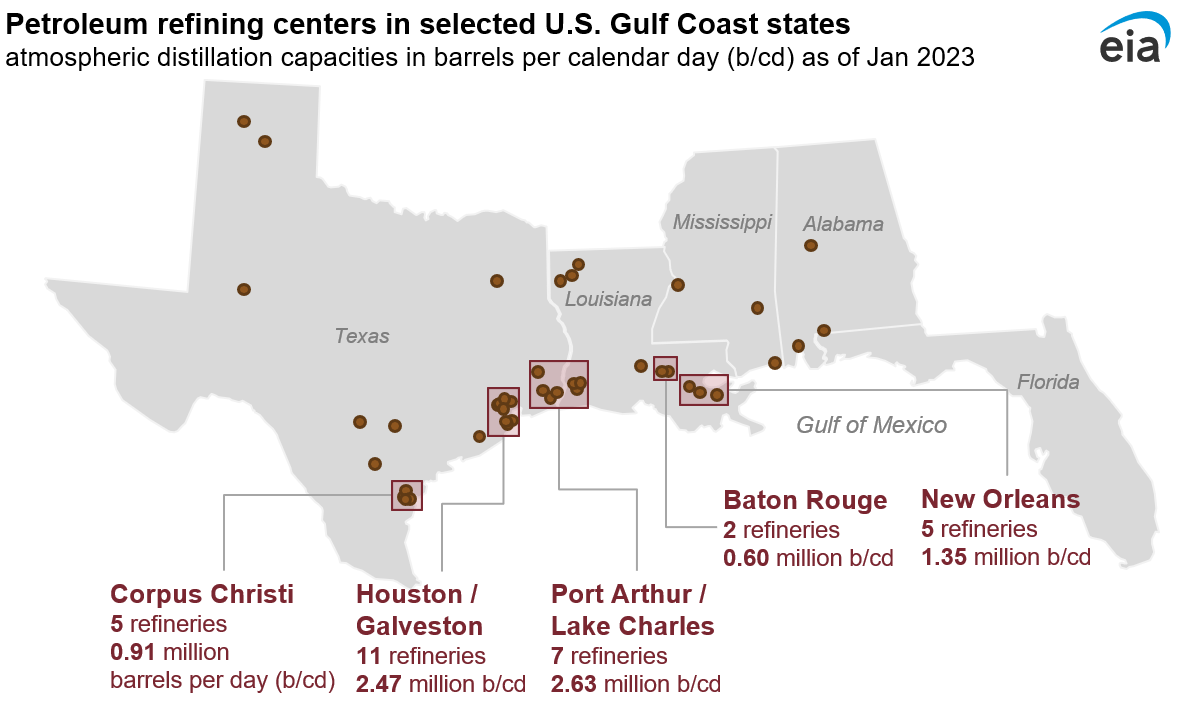
Historically hurricanes have been most disruptive to the refining industry when they significantly affect conditions near regional refinery hubs. Although Hurricane Ian in 2022 had a significant humanitarian and economic effect, particularly on Florida, no major refining hubs were in the affected areas, so the impact on U.S. refinery operations was relatively mild. Conversely, Hurricane Harvey in 2017 primarily affected the Houston/Galveston Bay region, and the major hurricanes in 2005 and 2008 affected the Louisiana Gulf Coast. Those all had more substantial impacts on refinery operations.
Data values: Refinery Capacity Data
Key Assumptions
Crude oil prices temporarily increase. Crude oil prices are one of the key inputs to our model and must be determined exogenously based on assumed changes in supply and demand. In our analysis, the assumed loss of crude oil supply from the Gulf of Mexico is longer in duration than the assumed loss of demand for crude oil from refiners, based on our analysis of historical hurricane impacts.
For this reason we anticipate stronger draws on global petroleum inventories, contributing to a September average Brent crude oil price that is $4.00 per barrel (b) more in the High Impact case than in our Base case. When Hurricane Harvey hit the Houston area in late August 2017, the monthly average Brent crude oil price increased by nearly $4.50/b from August to September. The U.S. Gulf Coast is home to several major hubs for U.S. crude oil exports, particularly at Corpus Christi and Houston. A hurricane contributing to lasting disruptions to U.S. crude oil exports at either location may contribute to larger increases in global crude oil prices.
Price effects to short-term disruptions are more elastic. Market-derived prices will have a more limited response to an outage that is clearly temporary than a loss of crude oil or gasoline production that is permanent or unknown in duration. As a result, our assumed price elasticity of demand range of -0.24 to -0.36 is reasonable when considering a temporary, short-term outage.
This value is centered on a -0.3 elasticity, which is more consistent with historical examples compared with a -0.1 price elasticity that would be associated with a higher price impact from a more permanent impact on supply. An elasticity closer to 0 means prices are more sensitive to supply disruptions, and we assume a temporary disruption results in a less sensitive price response because market participants can change the timing of some purchases and sales.
Petroleum product consumption is unchanged. Consumers typically do not immediately change behavior when prices temporarily rise because of a lack of alternatives and substitutes in many parts of the United States. Although some consumers would be affected by a hurricane because of physical infrastructure damage or lack of fuel access, we did not incorporate such effects into our cases. In addition, some loss of petroleum demand might be offset by increased demand from emergency response or panic-buying surrounding the event.
Other sources of crude oil supply remain unchanged. Hurricanes can affect U.S. crude oil imports and exports because of the trade infrastructure on the Gulf Coast. For this analysis, we assume no additional changes in crude oil imports or exports as refiners draw on inventories. Moreover, given the relatively short impact of GOM production outages on prices, we also assume no change in onshore production. Onshore production usually takes about six months to change following a change in crude oil prices.
Refiners in other regions are unable to increase utilization. We assume that other refiners throughout the United States and globally will be unable to meaningfully increase utilization during a short-term disruption in the U.S. Gulf Coast region. Aside from limitations on increasing activity on short notice, we anticipate most refiners will already be operating at near-maximum utilization because it will be just after the peak summer demand season.
Inventory draws and changes in trade offset reductions in gasoline production. Supply lost because of reduced motor gasoline production will need to be replaced by increased draws from motor gasoline inventories, increased imports into regions typically supplied by Gulf Coast refiners, and decreased exports from the Gulf Coast. We assume that the loss of gasoline supply from refinery production in the affected period will be evenly replaced by increased inventory draws and net imports.
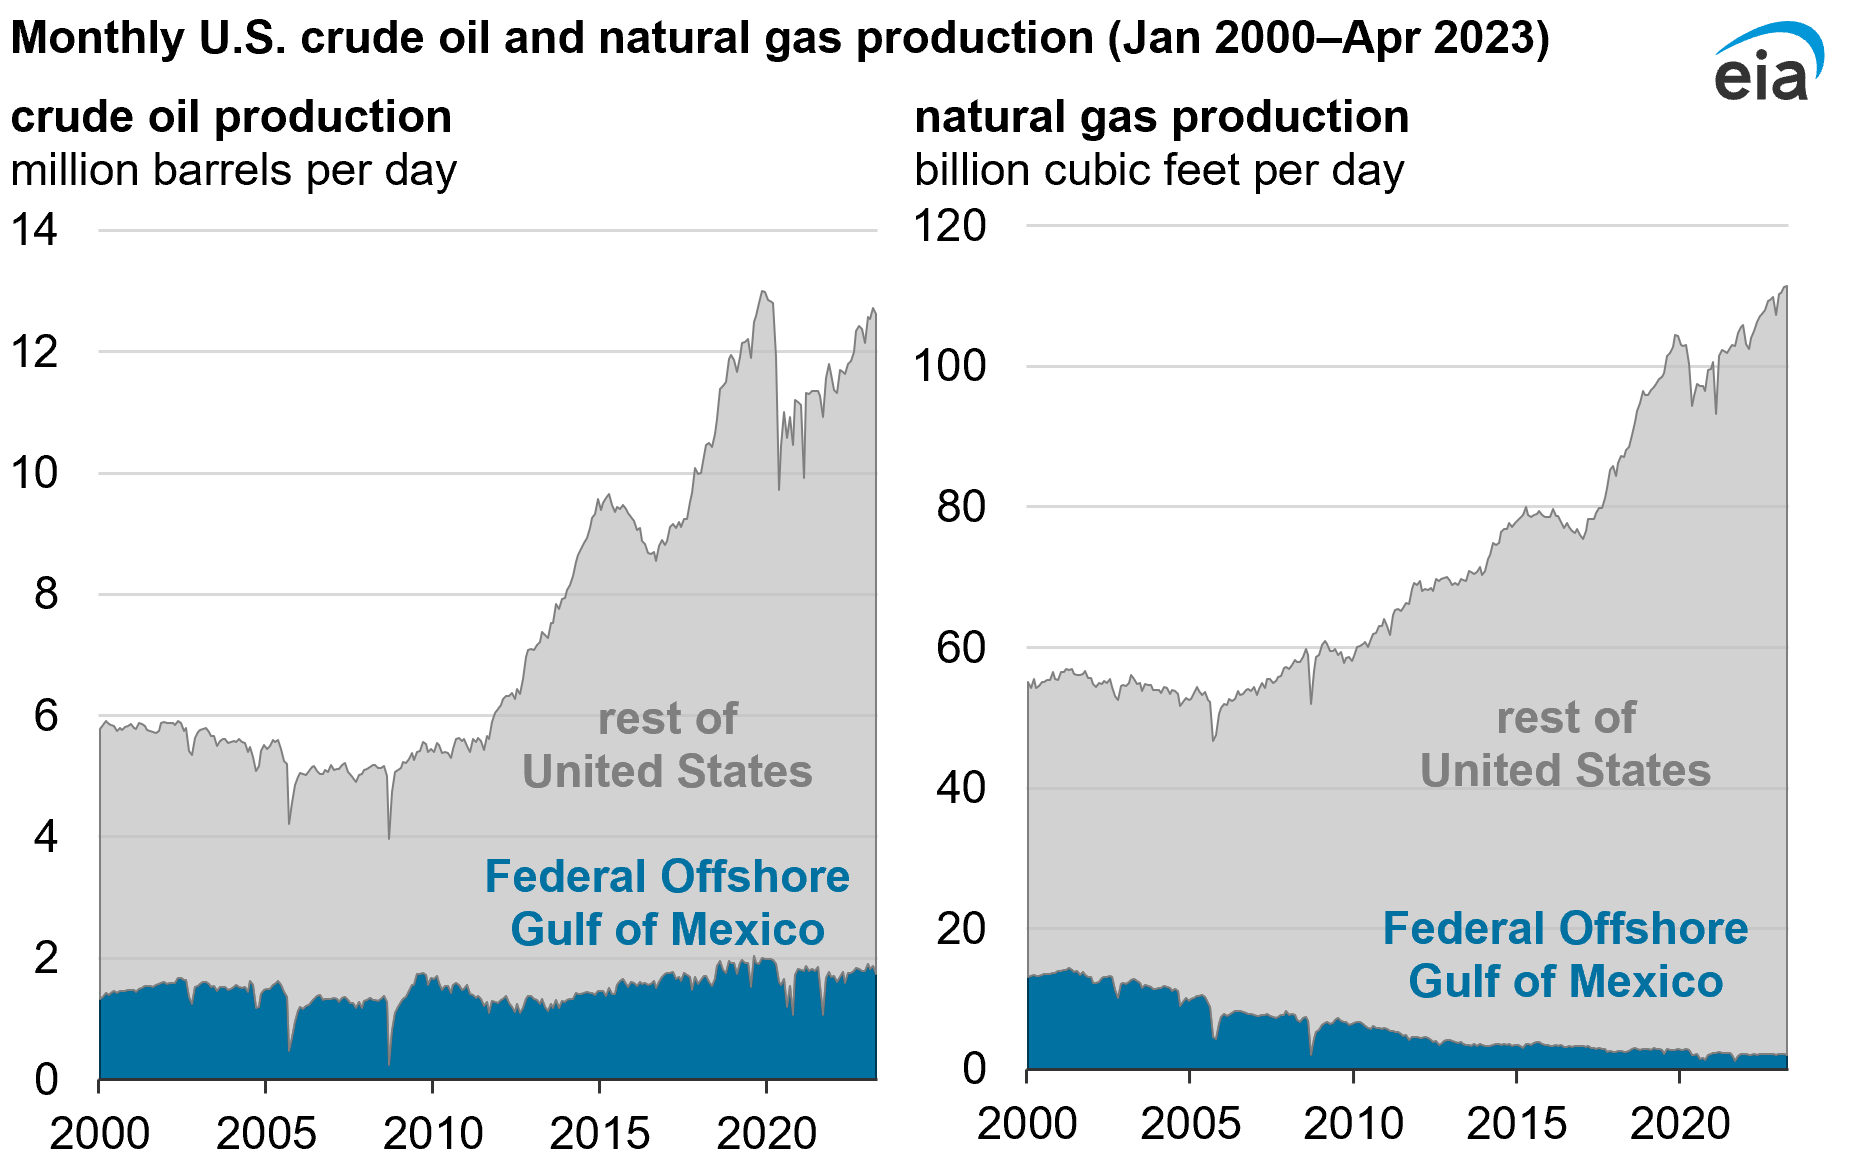
Natural gas production and exports remain unchanged. A hurricane could also reduce production of natural gas in the GOM; however, recent hurricanes have had a much smaller impact on total U.S. supply of natural gas because natural gas production in the GOM has been declining for years. The share of total U.S. natural gas production that comes from the GOM was 2% in 2022, down from 13% in 2005 when Hurricanes Katrina and Rita took significant levels of natural gas production offline. GOM oil production is more significant: GOM crude oil production made up 15% of total U.S. crude oil production in 2022.
Data values: Federal Offshore Gulf of Mexico Field Production of Crude Oil and Gross Withdrawals of Natural Gas
The United States has more than 12 billion cubic feet per day of liquefied natural gas (LNG) export capacity located on the Gulf Coast, making it vulnerable to weather-related disruptions such as hurricanes. Although LNG facilities generally have multiple levels of protection from direct impact, hurricanes can damage electrical and marine infrastructure and affect movement of ships. For example, the effects of Hurricane Laura, which made landfall in August 2020, temporarily halted LNG exports from Louisiana’s Sabine Pass and Cameron LNG facilities. Consideration of the impact to LNG infrastructure is outside of the scope of this analysis, which focuses on a hurricane’s impact on crude oil and refining infrastructure.
Results
Gasoline production: In our analysis, we assumed disrupted crude oil inputs at refineries reduced motor gasoline production by 620,000 b/d in September and by about 90,000 b/d in October in the High Impact case compared with the Base case.
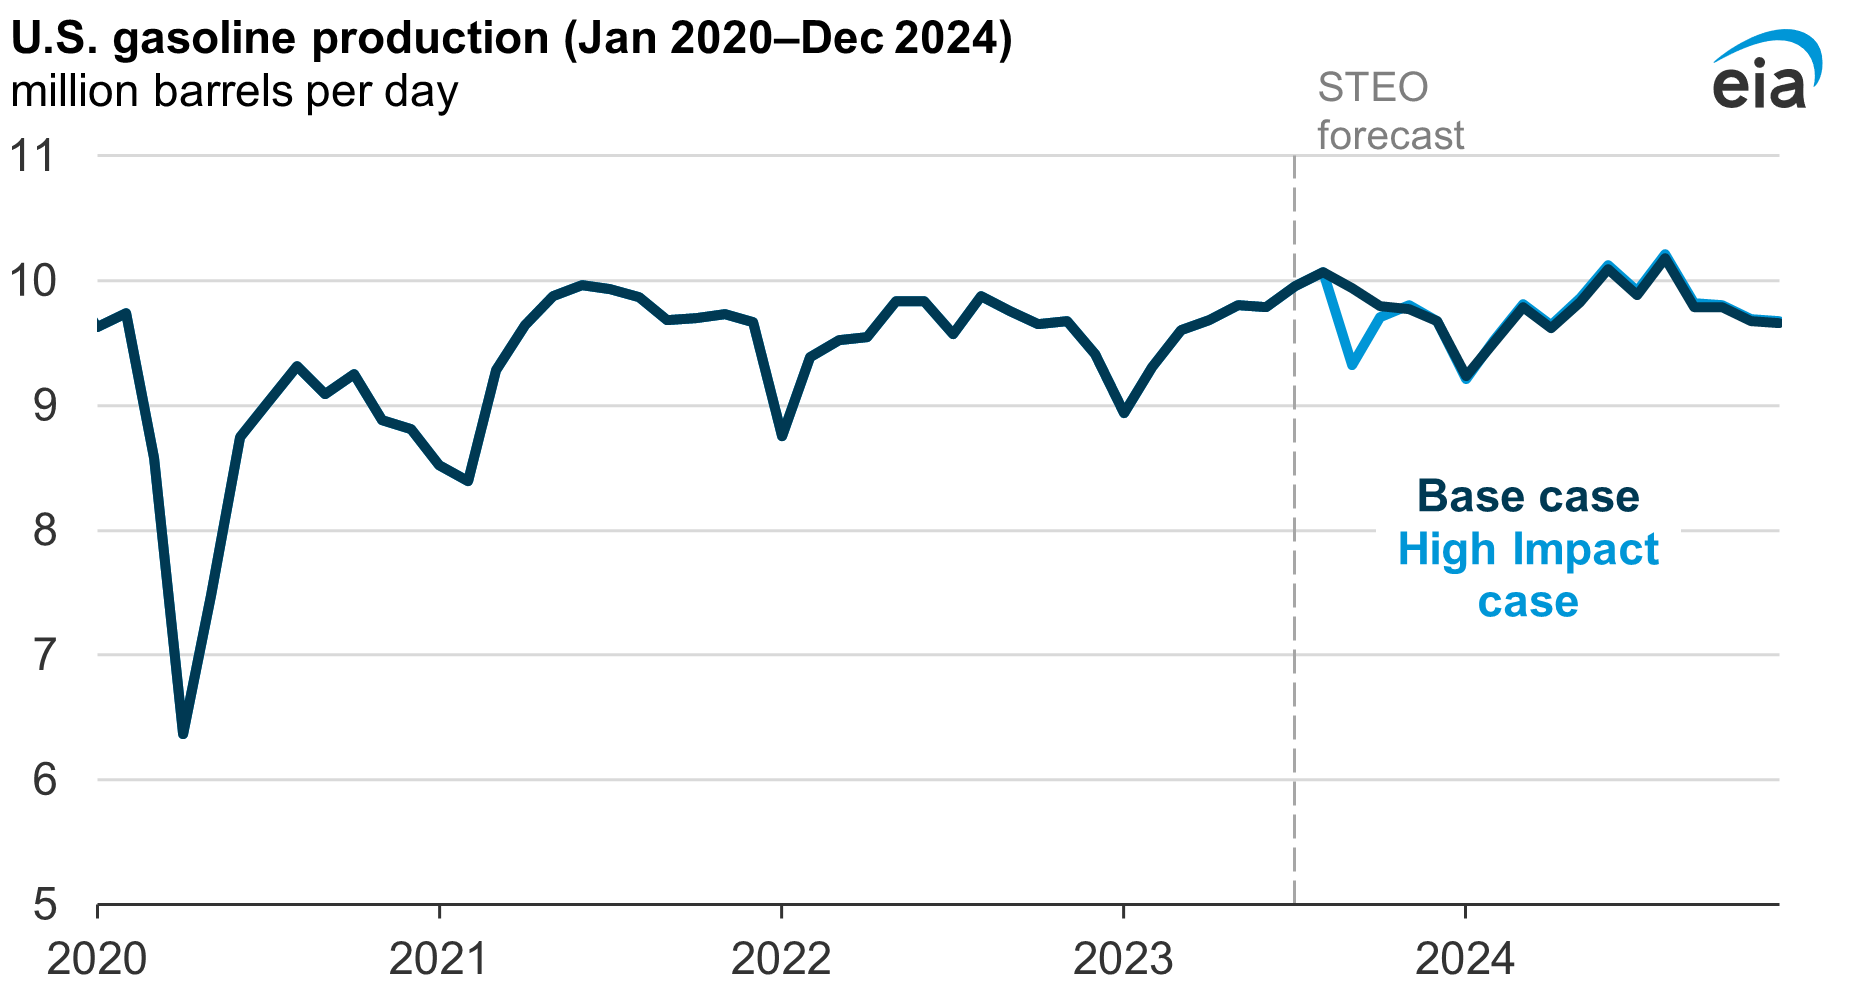
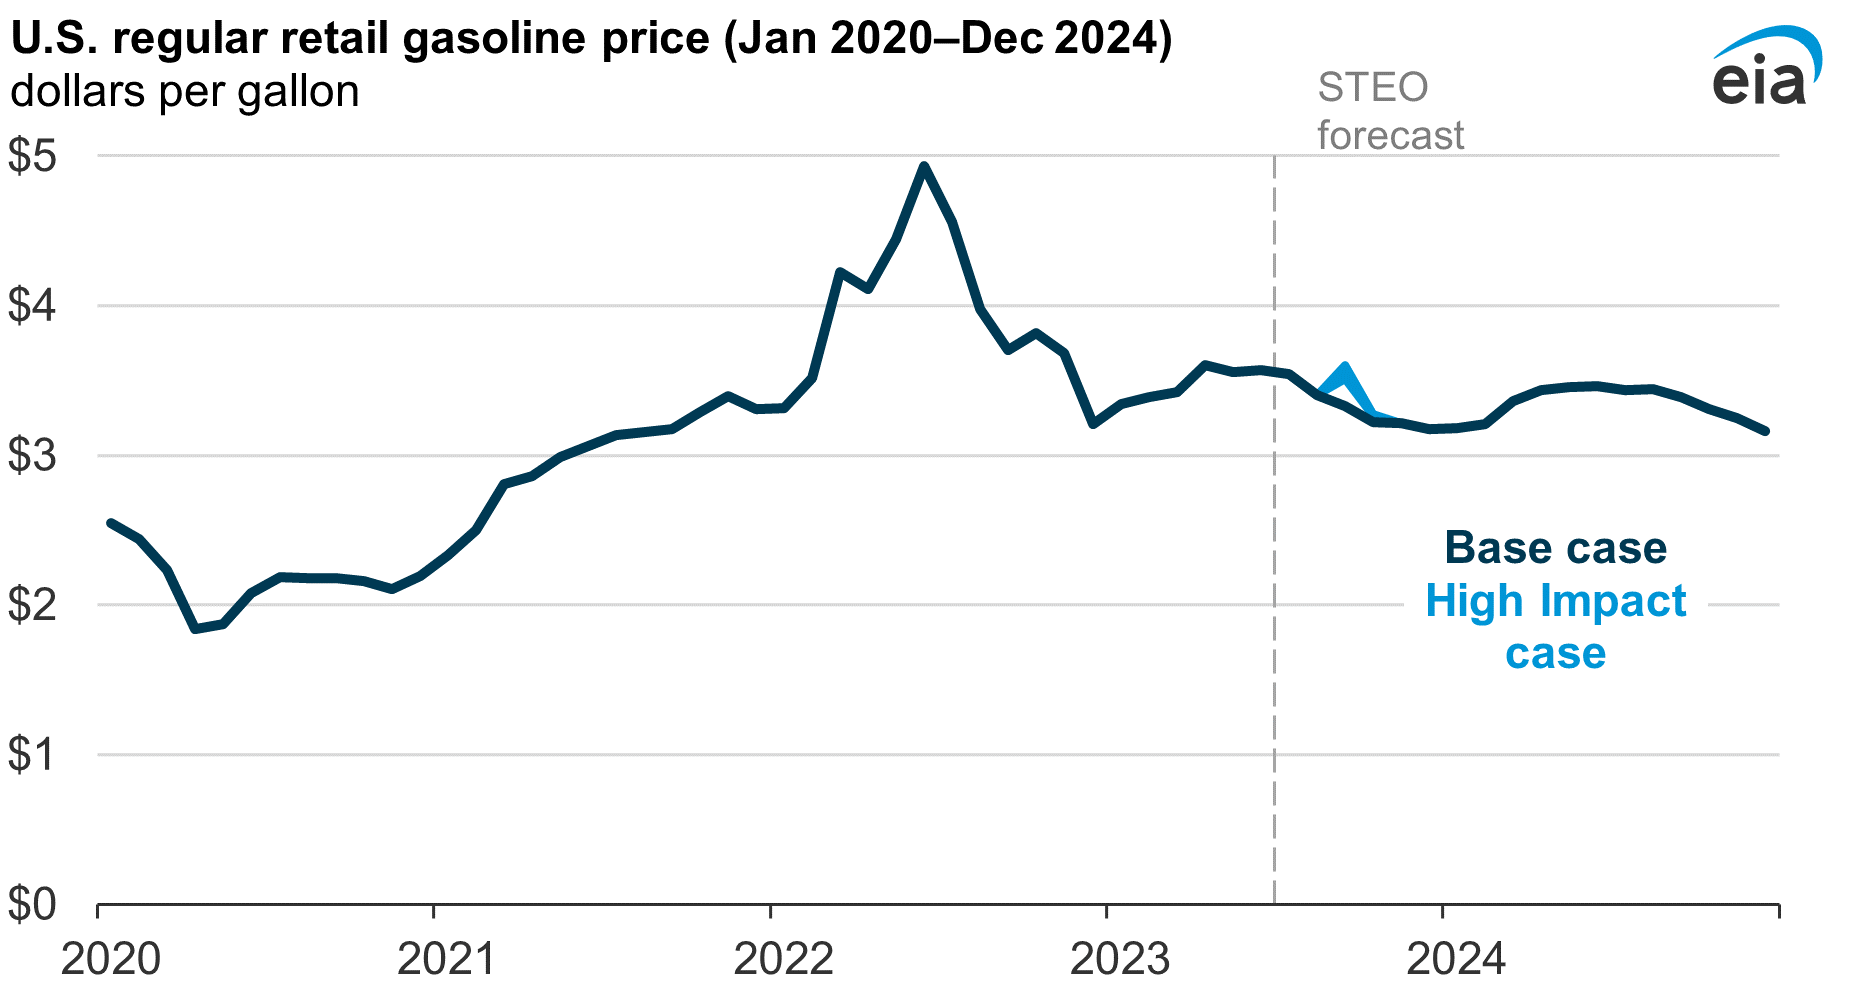
Retail gasoline prices: Disrupted gasoline production, lower U.S. gasoline inventory levels, and the impact of the short-term modeled price disruption increase retail gasoline prices. In the Base case, we estimate a retail gasoline price of $3.33 per gallon (gal) in September 2023, but in the High Impact case, the gasoline retail price is $3.51/gal to $3.60/gal, or about 18 cents/gal to 27 cents/gal higher, depending on the assumed elasticity value. The gasoline price difference between cases declines significantly in October and is equal by November.
Gasoline inventory: The High Impact case results in a monthly draw of 12.8 million barrels from inventories in September 2023, compared with a 1.9 million barrel increase in our Base case. As a result, we estimate gasoline inventories at the end of September to be about 229 million barrels in the Base case, compared with 215 million barrels in the High Impact case.
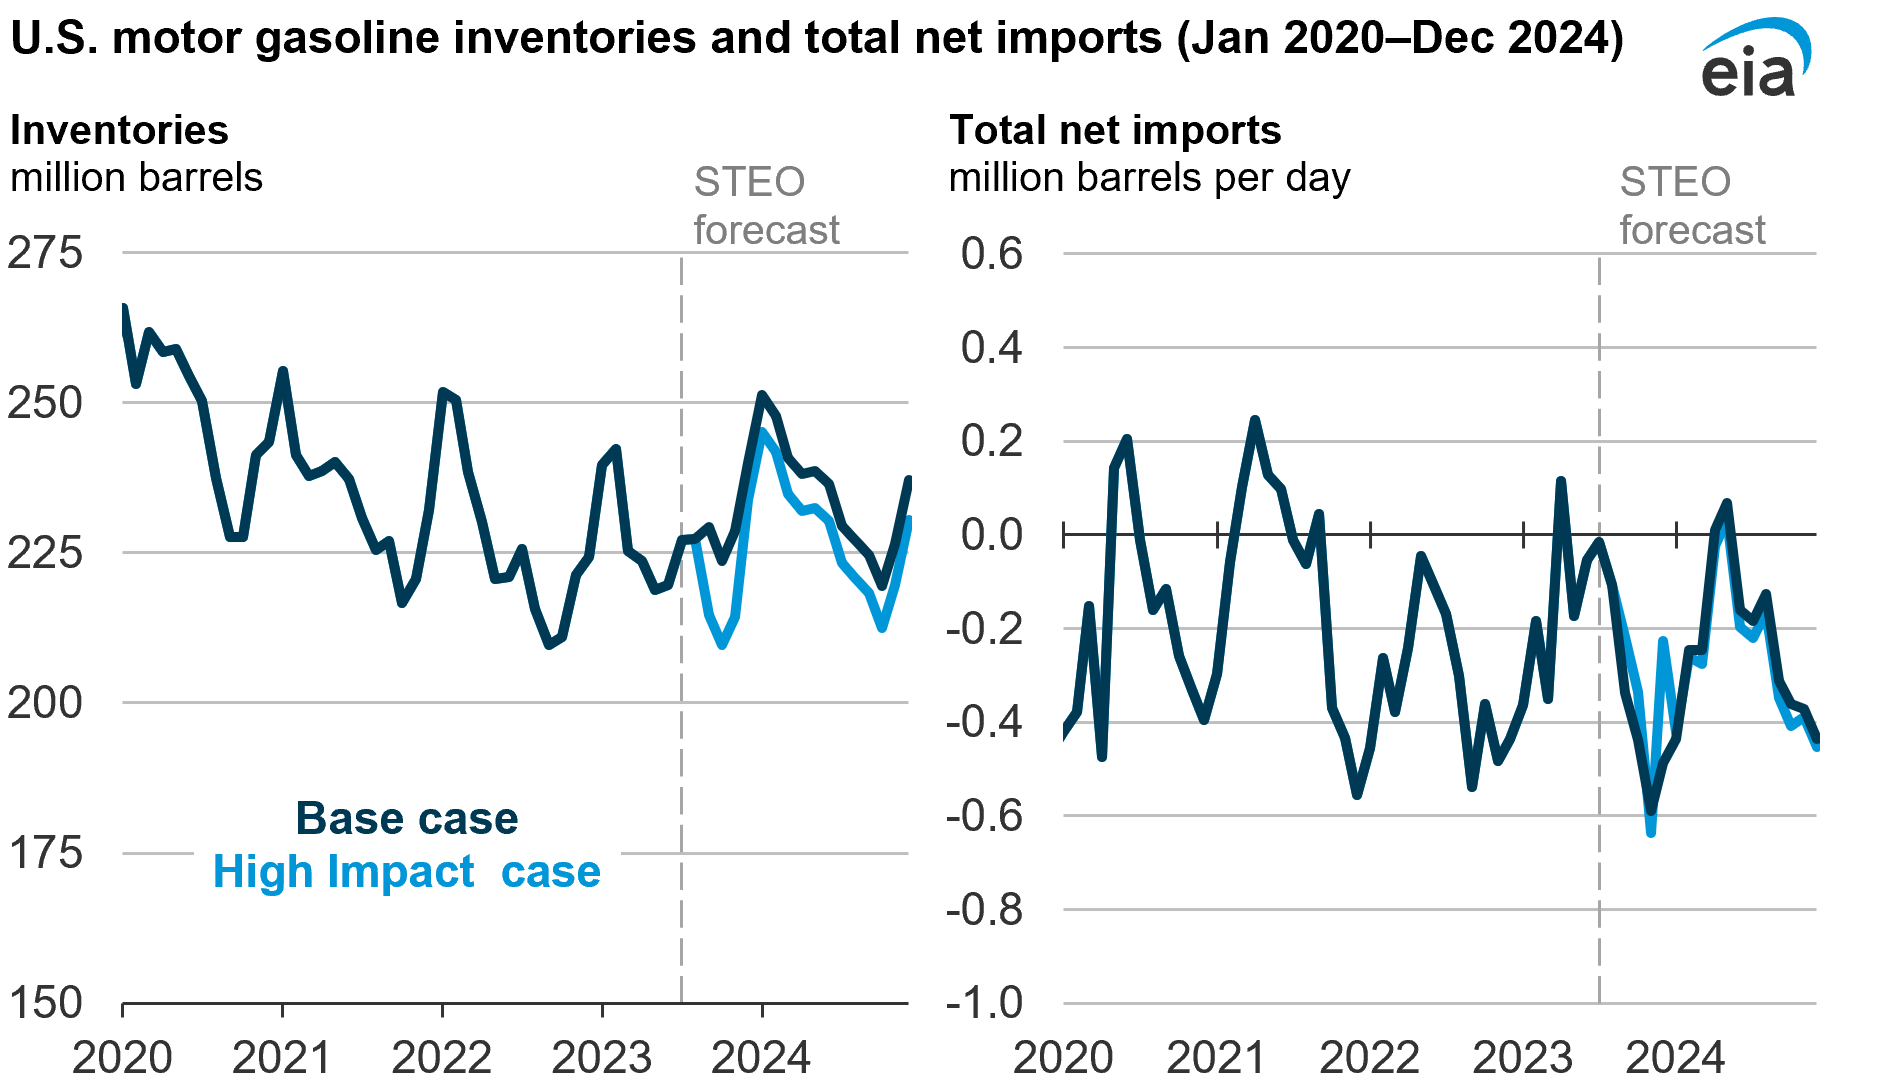
Gasoline trade: Total net imports of gasoline (including both finished motor gasoline and motor gasoline blending components) in September 2023 are about 120,000 b/d higher in the High Impact case than in the Base case, reflecting reduced Gulf Coast exports and increased imports into other regions following a hurricane-related disruption.
Caveats and Uncertainties
The results presented here are generally monthly average values for the entire United States. Depending on the unique aspects of a hurricane’s path and timing or the cumulative effect of multiple hurricanes in one season, these effects may be more significant when considered within narrower geographic areas or on shorter time spans.
Because disruptions could have any number of rapid and severe effects on fossil fuel markets, crude oil and gasoline prices could change well beyond the results presented here. For example, if supply and demand conditions are tighter than our forecasts, the price response would likely be significantly larger than even our range of estimated price effects.
Although we modeled prices based primarily on assumptions about price sensitivities in response to supply shocks, actual price movements in response to major market disruptions reflect nonlinear effects such as the cost of rerouting cargos already in transit, which is not a significant factor in the market under normal circumstances.
We also do not forecast global prices, supply, or demand for gasoline outside of the United States, while the cost of rerouting shipments is determined by those market conditions. Our models may not capture the severity of these price movements following hurricanes or other natural disasters.