Forecast overview
- Global oil production. We make the assumption that the Strait of Hormuz will remain effectively closed in the near term. In our forecast, oil shipments through the strait resume in the third quarter of 2026 (3Q26), however, we assume that it will likely take several months to ramp up to pre-conflict traffic, which we do not think will occur until early 2027. We expect some oil production in the Middle East to remain disrupted beyond the Short-Term Energy Outlook (STEO) forecast.
- Global oil inventories. Global oil markets remain highly volatile as very limited shipping traffic through the Strait of Hormuz has caused oil producers in the Middle East to reduce crude oil production by more than 11 million barrels per day (b/d) in May compared with pre-conflict levels. This drop in production has resulted in large global inventory draws to meet demand. Under our assumptions, we expect global oil inventories will fall by an average of 6.3 million b/d in 2Q26 and by 7.6 million b/d in 3Q26. Oil inventories in the Organization for Economic Cooperation and Development in our forecast fall to their lowest levels since 2003.
- Global oil consumption. High fuel prices, reduced fuel availability, and government initiatives have lowered oil demand. As a result, we now forecast that global oil demand will decrease by 1.1 million b/d over the course of 2026, compared to 104.0 in 2025. In our May STEO we forecast global oil consumption would increase by 0.2 million b/d in 2026, and in our February STEO we forecast demand would increase by 1.2 million b/d. We assume oil demand will rebound next year following a return of supply flows later in 2026, with oil demand growing by 2.5 million b/d in 2027 to 105.3 million b/d.
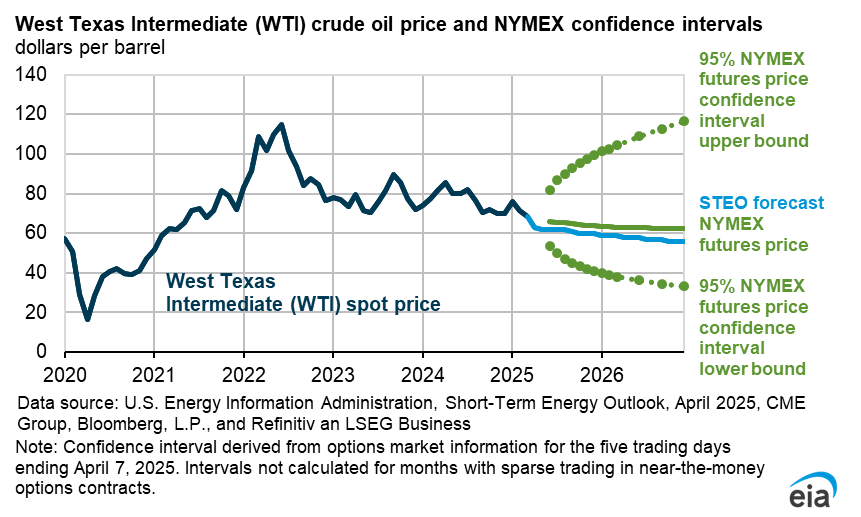
- Crude oil price forecast. Despite production outages and lower oil inventories, the Brent crude oil spot price fell in May following reductions in oil demand and reports of a possible agreement between the United States and Iran. However, based on the assumption that the Strait of Hormuz remains closed to most shipping traffic in the near term, falling oil inventories keep Brent prices at an average of $105 per barrel (b) in June and July. Once flows through the Strait of Hormuz incrementally resume allowing producers to gradually restore shut-in production, we expect prices to fall to an average of $79/b in 2027.
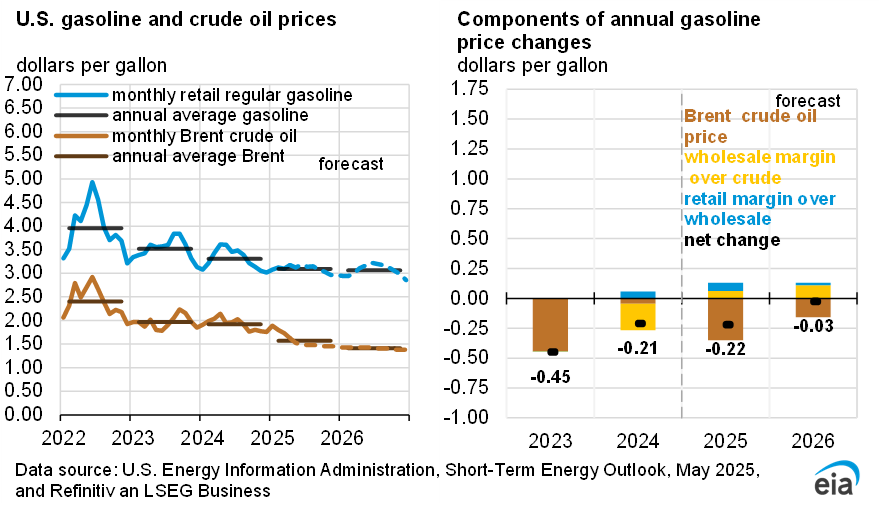
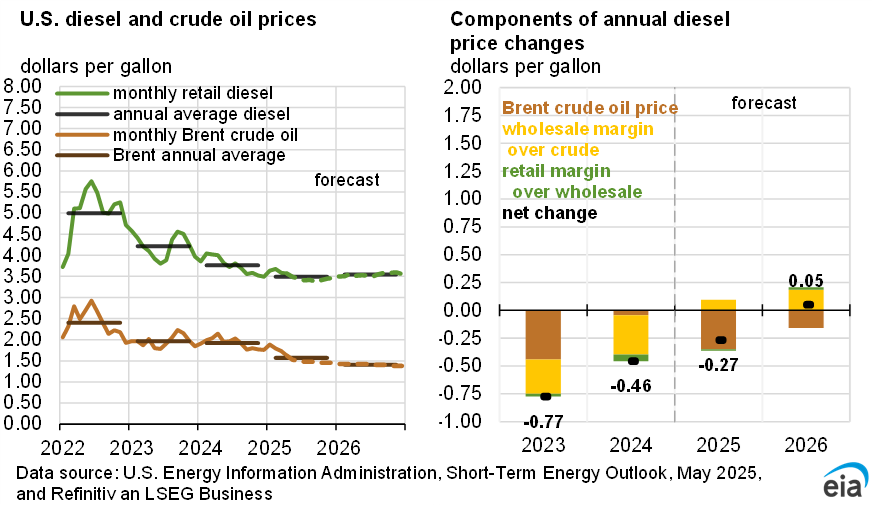
- U.S. petroleum product prices. Higher global crude oil prices are pushing U.S. petroleum wholesale price forecasts higher. Diesel and jet fuel wholesale prices rise the most—more than 60% in 2026 and 40% in 2027, respectively—compared with our pre conflict February STEO. We expect the wholesale gasoline price to increase by around 50% in 2026 and nearly 40% in 2027, compared with our February STEO.
- U.S. petroleum product trade. Disruptions to crude oil and refined product flows through the Strait of Hormuz have led to increased demand for U.S. supply, pushing U.S. crude oil and petroleum product net exports in April to a record 5.8 million b/d, with May net exports staying close to that level. Demand for U.S. diesel and jet fuel in particular has risen, with net exports for both expected to increase in 2Q26 compared with 2Q25. Overall, we expect U.S. crude oil and petroleum product net exports to average 4.2 million b/d this year, up 1.4 million b/d from 2025.
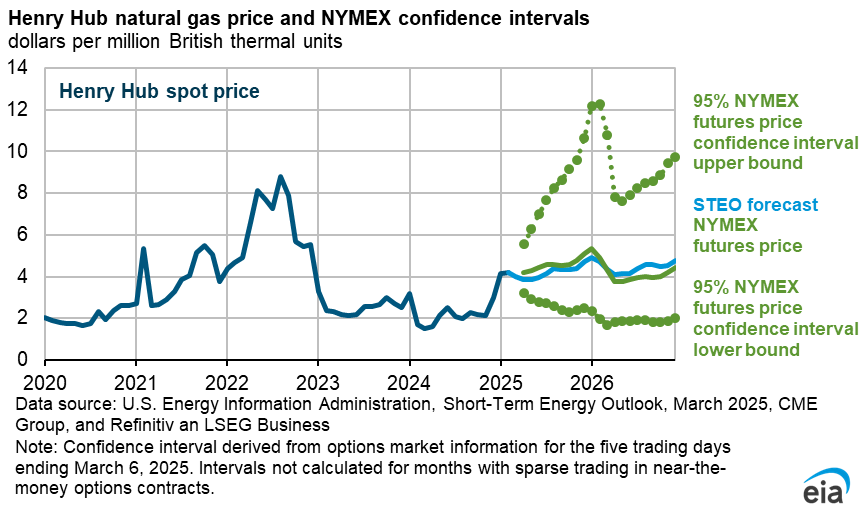
- Natural gas prices. The Henry Hub spot price rose slightly in May as warmer weather increased electric power sector demand. Despite the rising demand, natural gas prices remain relatively flat in 2026 as supply growth outpaces demand. Rising crude oil prices drive crude oil production higher in our forecast, which results in growth in associated natural gas production. However, rising natural gas demand next year for electricity generation and ongoing growth in U.S. natural gas exports put upward pressure on natural gas prices in the second half of (2H27). We expect the Henry Hub spot price to average about $3.34 per million British thermal units (MMBtu) in 2H26 and $3.55/MMBtu in 2H27.
- Electricity generation. Above-average temperatures this summer contribute to a 3% increase in forecast U.S. electricity generation compared with the summer of 2025. This growth is met by increased generation from renewable fuel sources, with solar generation increasing by 19% and wind generation increasing by 10%. Generation from coal is forecast to decrease by 2%. Natural gas generates about the same amount of electricity it did last summer.
| Notable Forecast Changes | 2026 | 2027 |
|---|---|---|
The current STEO forecast was released June 9. |
||
| Henry Hub spot price (dollars per million British thermal units) | $3.60 | $3.46 |
| Previous forecast | $3.50 | $3.18 |
| Percentage change | 2.8% | 9.0% |
| OPEC+ crude oil production (million barrels per day) | 34.0 | 39.8 |
| Previous forecast | 35.6 | 39.8 |
| Percentage change | -4.5% | 0.0% |
| World liquid fuels consumption growth (million barrels per day) | -1.1 | 2.5 |
| Previous forecast | 0.2 | 1.5 |
| Percentage point change | -1.3 | 1.0 |
| U.S. crude oil inventories (million barrels) | 419 | 422 |
| Previous forecast | 431 | 434 |
| Percentage change | -2.8% | -2.6% |
You can find more information in the detailed table of forecast changes.