Forecast overview
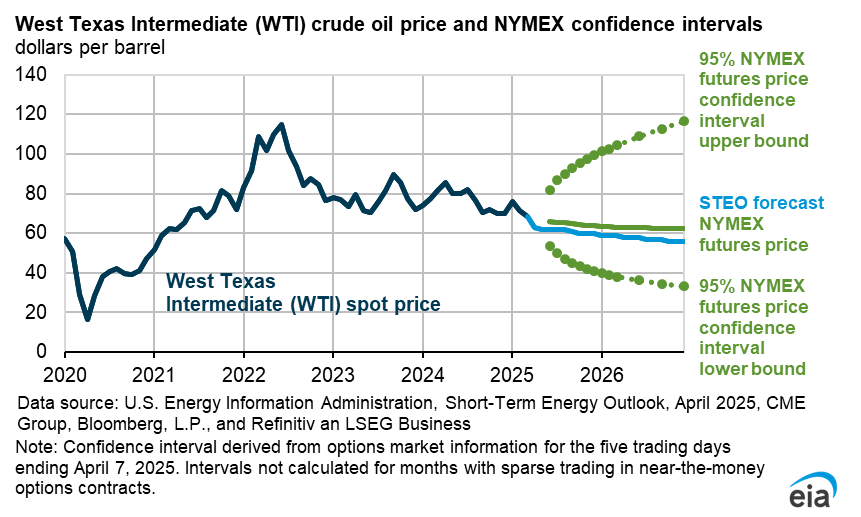
- Crude oil price movements. The Brent crude oil spot price has risen sharply following the onset of military action in the Middle East. Brent settled at $94 per barrel (b) on March 9, up about 50% from the beginning of the year and the highest since September 2023. Crude oil prices have risen as petroleum shipments through the Strait of Hormuz have fallen, and some Middle East oil production has been shut in.
- Middle East oil production. We make the assumption in our modeling that the effective closure of the Strait of Hormuz will cause oil production in the Middle East to fall further in the coming weeks. We assume this shut-in production will gradually ease as transit through the Strait resumes.
- Crude oil price forecast. We forecast the Brent crude oil price will remain above $95/b over the next two months, before falling below $80/b in the third quarter of 2026 and around $70/b by the end of the year. We expect prices to average $64/b in 2027. This price forecast is highly dependent on our modeled assumptions of both the duration of conflict in the Middle East and resulting outages in oil production.
- U.S. crude oil production. Higher oil prices lead to more U.S. crude oil production in our forecast. We expect U.S. crude oil production will average 13.6 million barrels per day (b/d) in 2026 and rise to 13.8 million b/d in 2027. Our 2027 forecast is 0.5 million b/d higher than last month’s forecast.
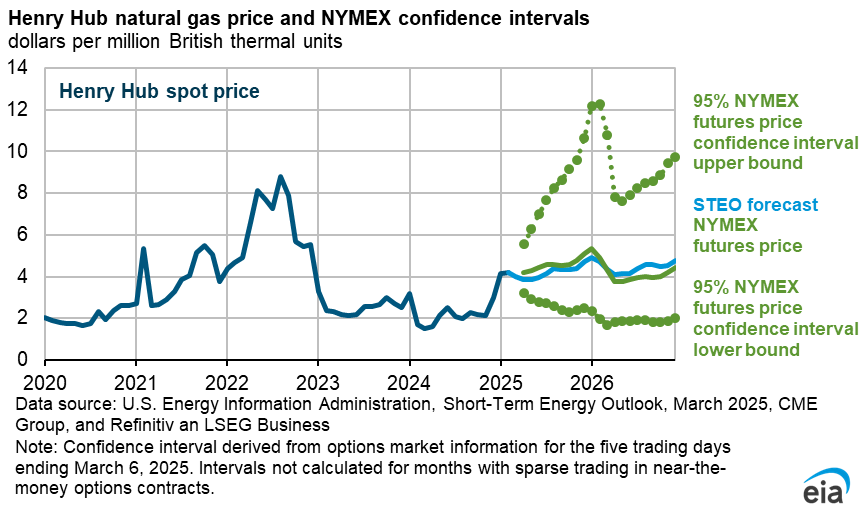
- Natural gas prices. Although reduced liquefied natural gas (LNG) flows through the Strait of Hormuz have caused the price of natural gas in Europe and Asia to increase, we expect U.S. natural gas prices to be relatively unaffected by this development. In our forecast, the Henry Hub spot price averages about $3.80 per million British thermal units (MMBtu) in 2026, or 13% less than our forecast last month. Prices in the early part of our forecast are lower because of milder-than-forecast temperatures in February that left more natural gas in storage than we expected. The Henry Hub spot price averages nearly $3.90/MMBtu in 2027, 12% lower than our forecast last month. Lower prices in 2027 mostly reflect more associated natural gas production as a result of the recent increase in oil prices and the related increase in production later in the forecast.
- Natural gas production. Higher crude oil production results in more associated natural gas production. We expect marketed natural gas production to average 121 billion cubic feet per day (Bcf/d) this year, an increase of 2% from 2025. Production rises by an additional 3% in 2027 to reach 124 Bcf/d. The 2027 forecast is almost 2 Bcf/d higher than last month’s outlook.
- Natural gas inventories. We expect U.S. natural gas inventories to end the withdrawal season in March around 1,840 billion cubic feet (Bcf), which is near the five-year average (2021–2025). Storage withdrawals slowed in February, as milder weather moved across much of the country, following historic withdrawals in January related to Winter Storm Fern and subsequent cold weather.
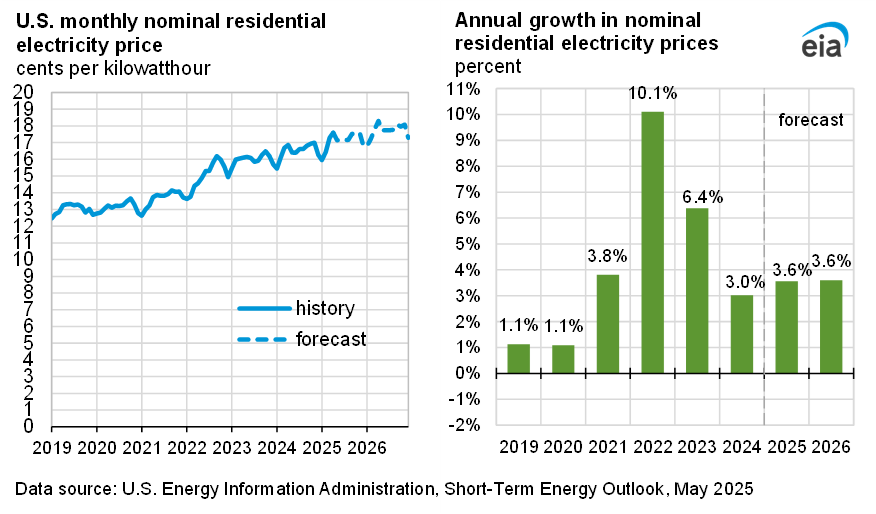
- Electricity. U.S. electricity generation has been increasing by an average of 2% per year since 2021 to meet growing electricity demand following a period of flat demand growth between 2010 and 2019. We expect U.S. electricity generation will grow by 1.2% in 2026 and by 3.1% in 2027 led by demand growth in the Electric Reliability Council of Texas (ERCOT) region. In 2026, U.S. coal generation declines by 7% in our forecast as generation from renewable sources increases and the electric power sector retires about 4% of its coal-fired generating capacity.
- Coal exports. Coal exports fell in 2025 due to a combination of low prices, weak global demand, and increased domestic consumption. Our forecast assumes coal exports will rise slightly in 2026, supported by an increase in metallurgical coal exports, as additional production capacity comes online. Disruptions to the flow of global LNG exports through the Strait of Hormuz led to an increase in thermal coal spot prices, which may support higher U.S. coal exports should LNG trade disruptions persist.
| Notable Forecast Changes | 2026 | 2027 |
|---|---|---|
The current STEO forecast was released March 10. |
||
| Brent crude oil spot price (dollars per barrel) | $79 | $64 |
| Previous forecast | $58 | $53 |
| Percentage change | 37% | 22% |
| Global oil inventory change (million barrels per day) | 1.9 | 3.0 |
| Previous forecast | 3.1 | 2.7 |
| Change | -1.2 | 0.3 |
| U.S. crude oil production (million barrels per day) | 13.6 | 13.8 |
| Previous forecast | 13.6 | 13.3 |
| Percentage change | 0.1% | 3.8% |
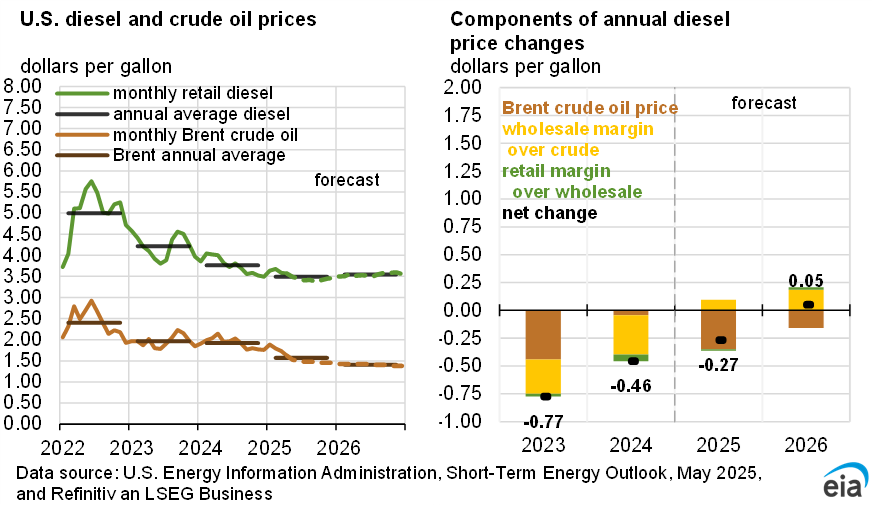
| Retail diesel price (dollars per gallon) | $4.12 | $3.78 |
| Previous forecast | $3.43 | $3.47 |
| Percentage change | 20.1% | 9.1% |
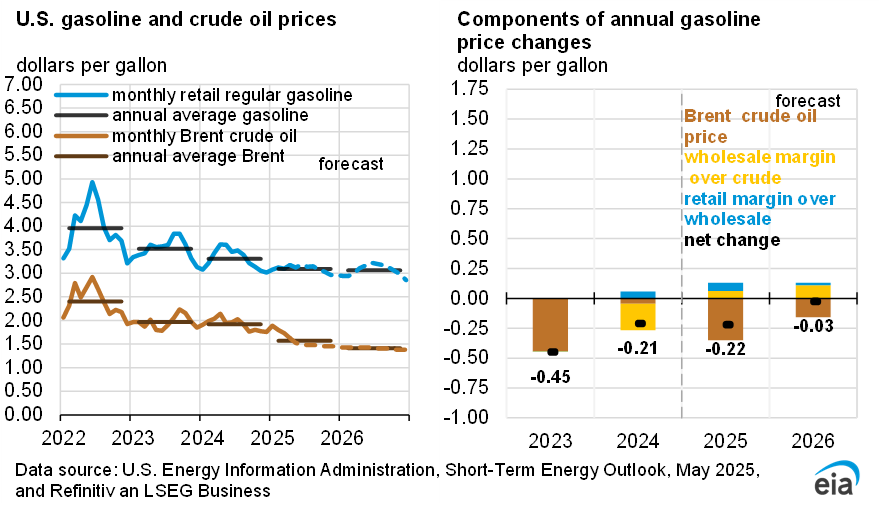
| Retail gasoline price (dollars per gallon) | $3.34 | $3.18 |
| Previous forecast | $2.91 | $2.93 |
| Percentage change | 14.7% | 8.4% |
| Henry Hub spot price (dollars per million British thermal untis) | $3.76 | $3.85 |
| Previous forecast | $4.31 | $4.38 |
| Percentage change | -12.8% | -12.1% |
You can find more information in the detailed table of forecast changes.