Release Date: November 16, 2023
STEO Perspectives: How do different crude oil prices affect U.S. crude oil and natural gas production?
Data values: Energy Prices and U.S. Petroleum and Other Liquids Supply, Consumption, and Inventories
Analysis summary and key findings
Crude oil prices significantly affect U.S. crude oil production: higher prices, especially when sustained, provide an incentive for producers to drill and produce more crude oil. Similarly, producers reduce drilling activity and production during periods of low crude oil prices. These changes in crude oil production also affect natural gas production because some natural gas is produced from oil wells.
In our Short-Term Energy Outlook (STEO) forecast, we expect the West Texas Intermediate (WTI) Cushing crude oil price to average $89 per barrel ($/b) through 2024 and for U.S. Lower 48 crude oil production to average 10.8 million barrels per day (b/d) next year. This analysis presents two scenarios with a sustained higher or lower WTI price in 2024 to illustrate the effects on drilling and, ultimately, on crude oil and natural gas production.
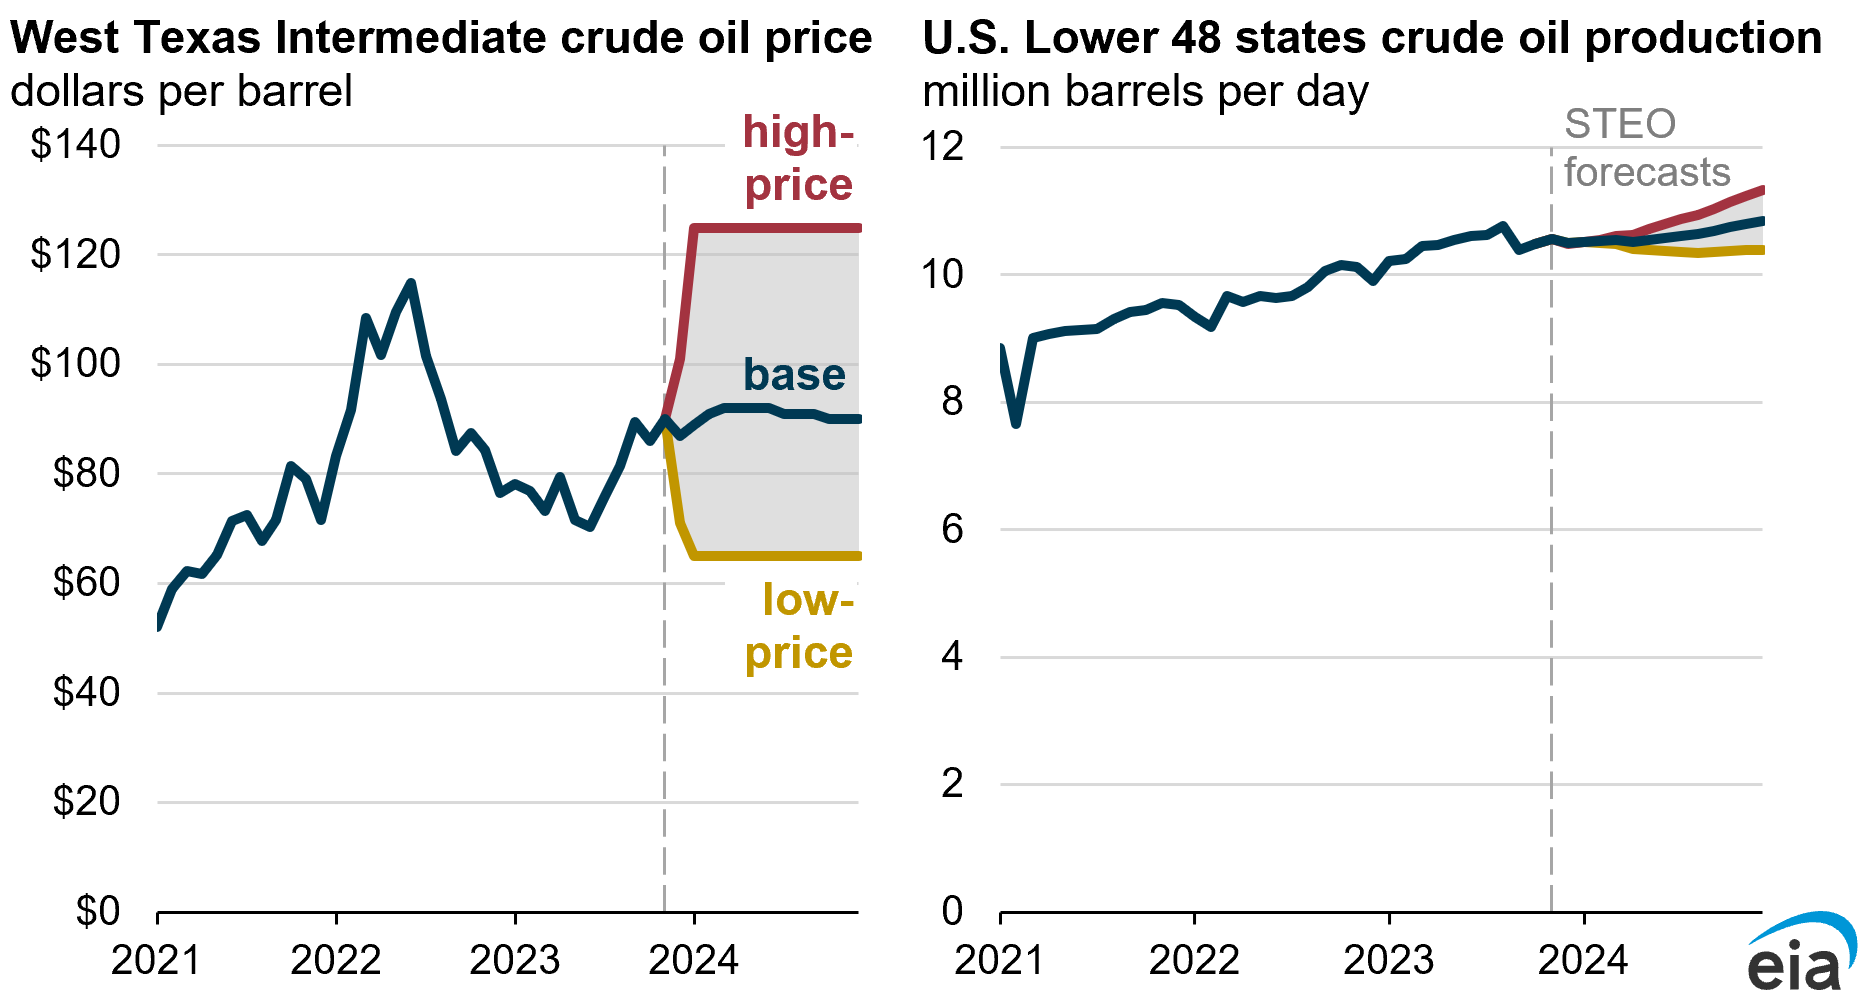
If we instead assume, based on past WTI closing prices, a 45% higher price environment of $125/b, we forecast a 4% increase in crude oil production from the Lower 48 states by the end of 2024 over the base case. In a 24% lower price case with WTI at $65/b, we forecast 4% less production in the Lower 48 states relative to the base case.
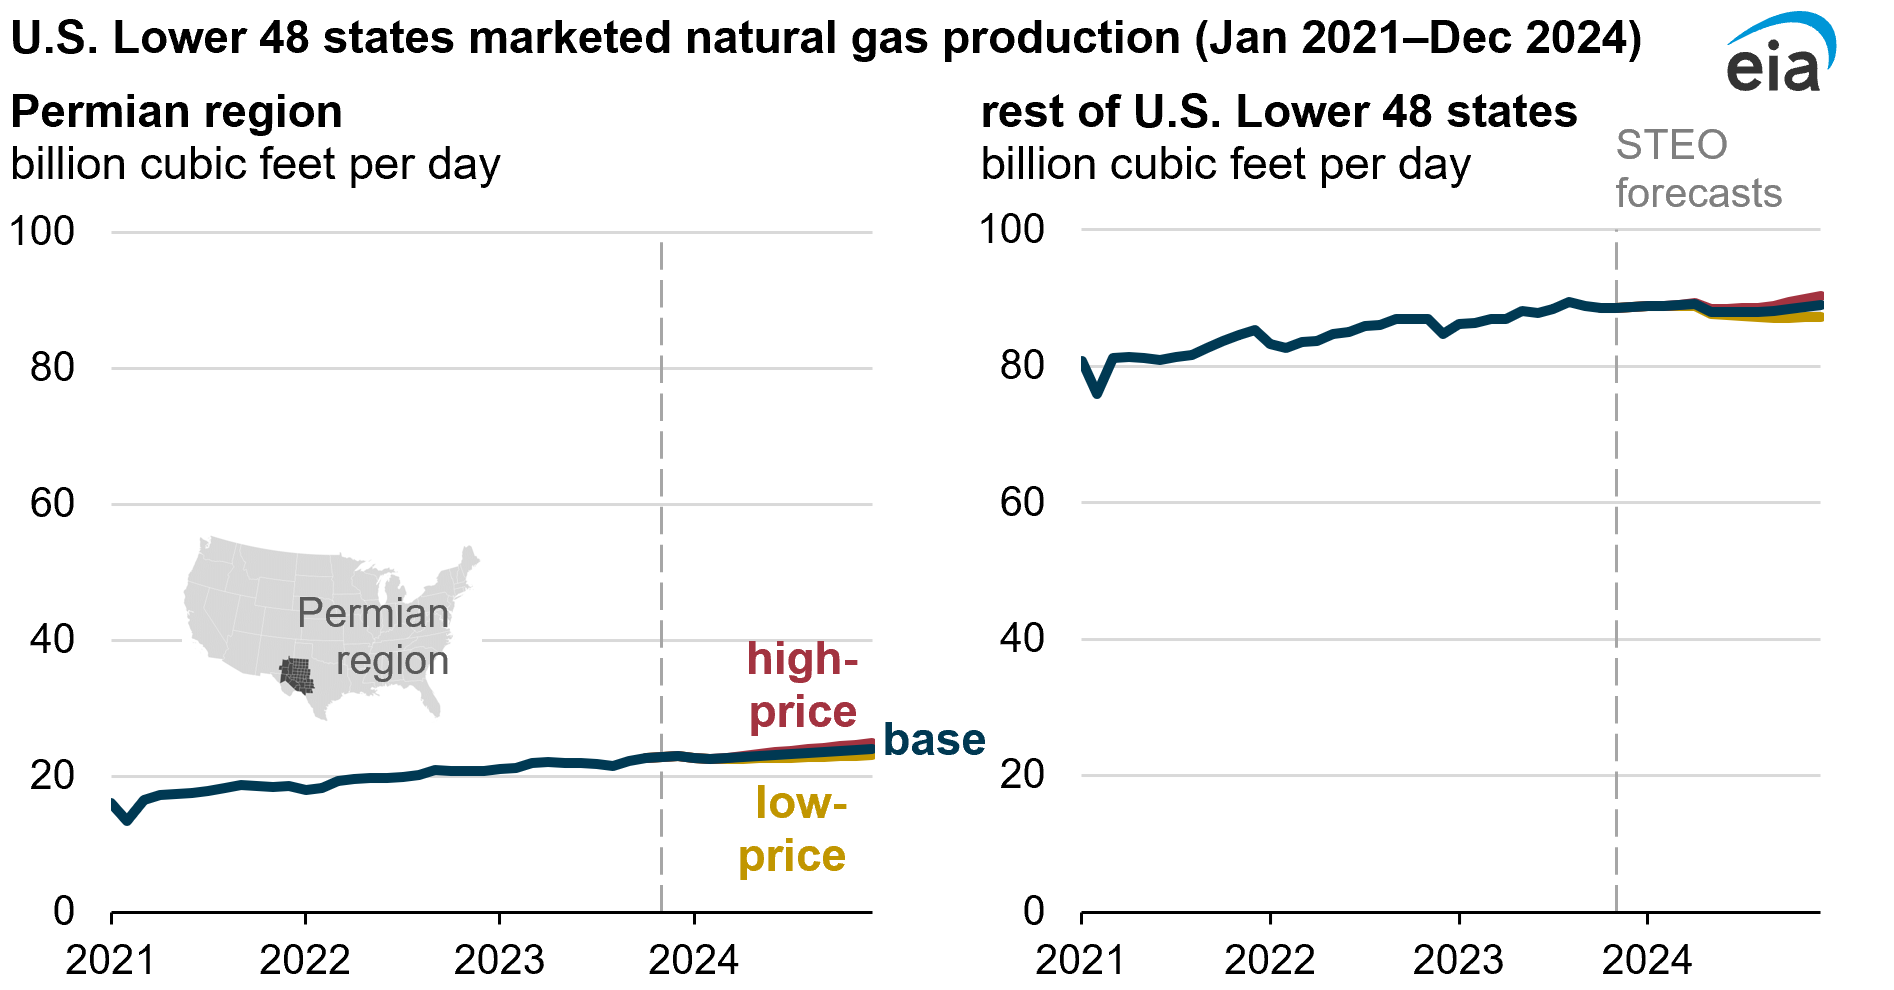
In all three cases, changes in production in the Permian region of western Texas and eastern New Mexico dominate changes for total U.S. crude oil and natural gas production. In previous years, some production in this region was limited by available infrastructure, but as developers have added takeaway capacity in the Permian region, we do not expect production to be constrained even in the high-price case.
Case design
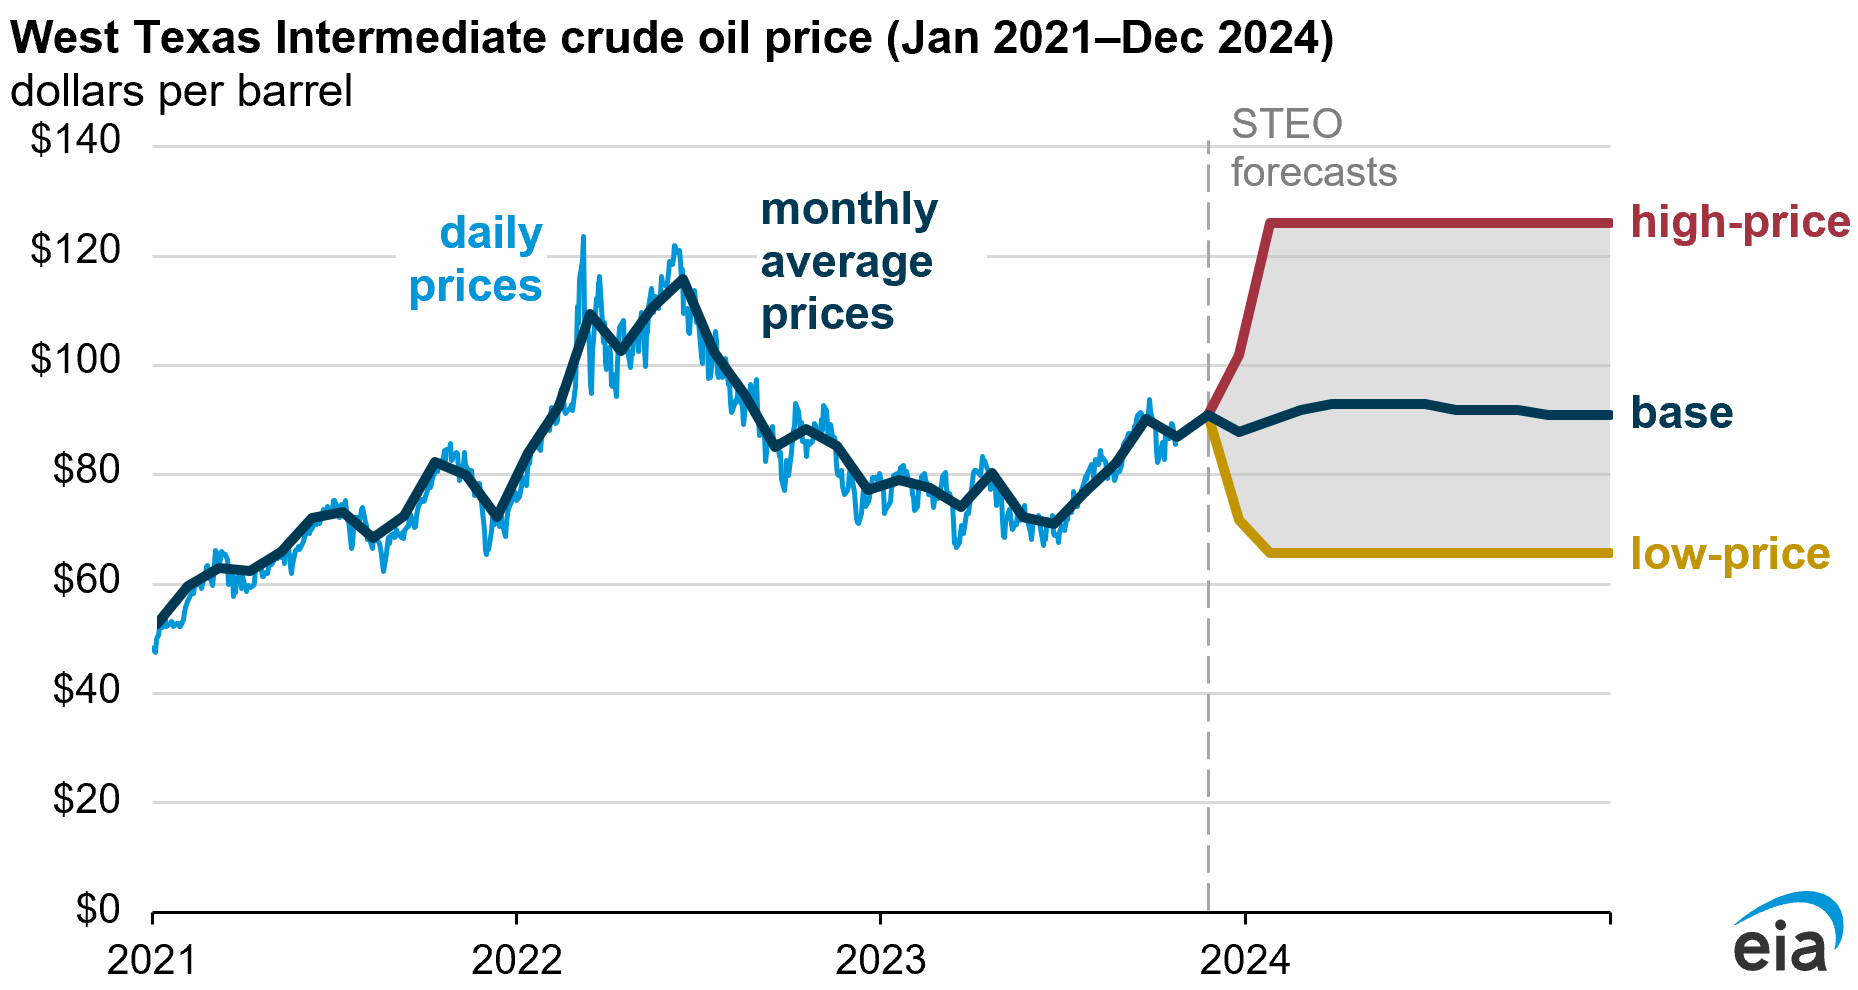
We created two cases that bound our base STEO forecast to analyze the effects of the WTI price on U.S. crude oil and natural gas production. In October 2023, WTI crude oil averaged $86/b. In our base case, we expect the WTI crude oil price to average $89/b in 2024, with relatively little price change throughout the year.
All three cases share a November 2023 average WTI price of $86/b that diverges after November. For the high-price case, the price reaches $125/b in January 2024, and in the low-price case, the WTI price falls to $65/b. In these high- and low-price cases, we hold the WTI prices for all of 2024.
Data values: Energy Prices (monthly) and Cushing, OK WTI Spot Price FOB (daily) Production
Cushing, Oklahoma, is a crude oil storage and infrastructure hub and delivery point for the NYMEX WTI crude oil futures contract. The crude oil price in Cushing serves as a benchmark price for U.S. producers. In the STEO, we determine the WTI price outside of our model and use the WTI price as an input to our U.S. crude oil production forecast.
The range of WTI price forecasts are near the daily closing prices in the past two years (since November 2021). WTI closed at a low of $66/b on December 1, 2021, and a high of $124/b on March 8, 2022.
Key assumptions
Crude oil prices only affect production in the Lower 48 states. Our forecast for U.S. crude oil production is divided into three large regions: Alaska, the Federal Offshore Gulf of Mexico (GOM), and the Lower 48 states, with the latter further subdivided into certain production regions. In our short-term forecasts for Alaska and GOM crude oil production, changes in crude oil prices do not affect production because of the long lead times from project conception to completion. Lower 48 crude oil production has shorter lead times and can respond more quickly to price changes.
No new pipeline capacity is added beyond those projects that have already been announced. Several pipeline capacity additions have been announced for 2024. We assume no new pipeline capacity beyond that comes online. Pipeline capacity additions are an important consideration especially when determining the upper bound of production in the high-price case. In the past, Permian crude production growth has been enabled by increased takeaway capacity in the region. With the current oil and gas pipeline buildouts planned in the next few years, we do not expect takeaway capacity constraints in the Permian region.
Wells and rigs have a delayed response to price. The number of both wells and operating rigs—which drill new wells—respond to price changes. Oil producers can complete already drilled but uncompleted wells (DUCs) and they can drill new wells. Production from existing wells increases about two months after prices increase. The number of rigs drilling new wells increases about four months after prices increase. The opposite happens when prices decrease. As rig activity changes, the well count also changes. We assume that the delay from rig count changes to well count changes is an average of two months. As wells come online, we assume that production changes occur instantaneously. We do not assume any delays required to connect a well to a local pipeline network. We periodically verify this assumption by reviewing historical data and conferring with industry experts.
Wells produce both oil and natural gas. We model both the oil and natural gas production from wells drilled in our forecast. Our model forecasts total oil and natural gas rig changes following an oil price change. We do not estimate rig counts for oil and gas separately.
Crude oil price changes can also affect natural gas production. Associated natural gas is the natural gas that is dissolved in crude oil under the pressure of a geologic formation and is then released when the pressure on the crude oil is relieved by bringing it to the surface. Most of the natural gas produced in the Permian region is associated natural gas from oil wells.
In 2022 (the last year in which we have full annual associated natural gas production data), the Permian region accounted for 8% of total U.S. natural gas production, but it accounted for 56% of U.S. associated natural gas production. Producers in the Permian region typically respond to changes in the crude oil price when planning their exploration and production activities, including when deciding whether to deploy drilling rigs or take rigs out of operation. For that reason, we assume associated natural gas production depends on the WTI crude oil price rather than spot natural gas prices.
Results
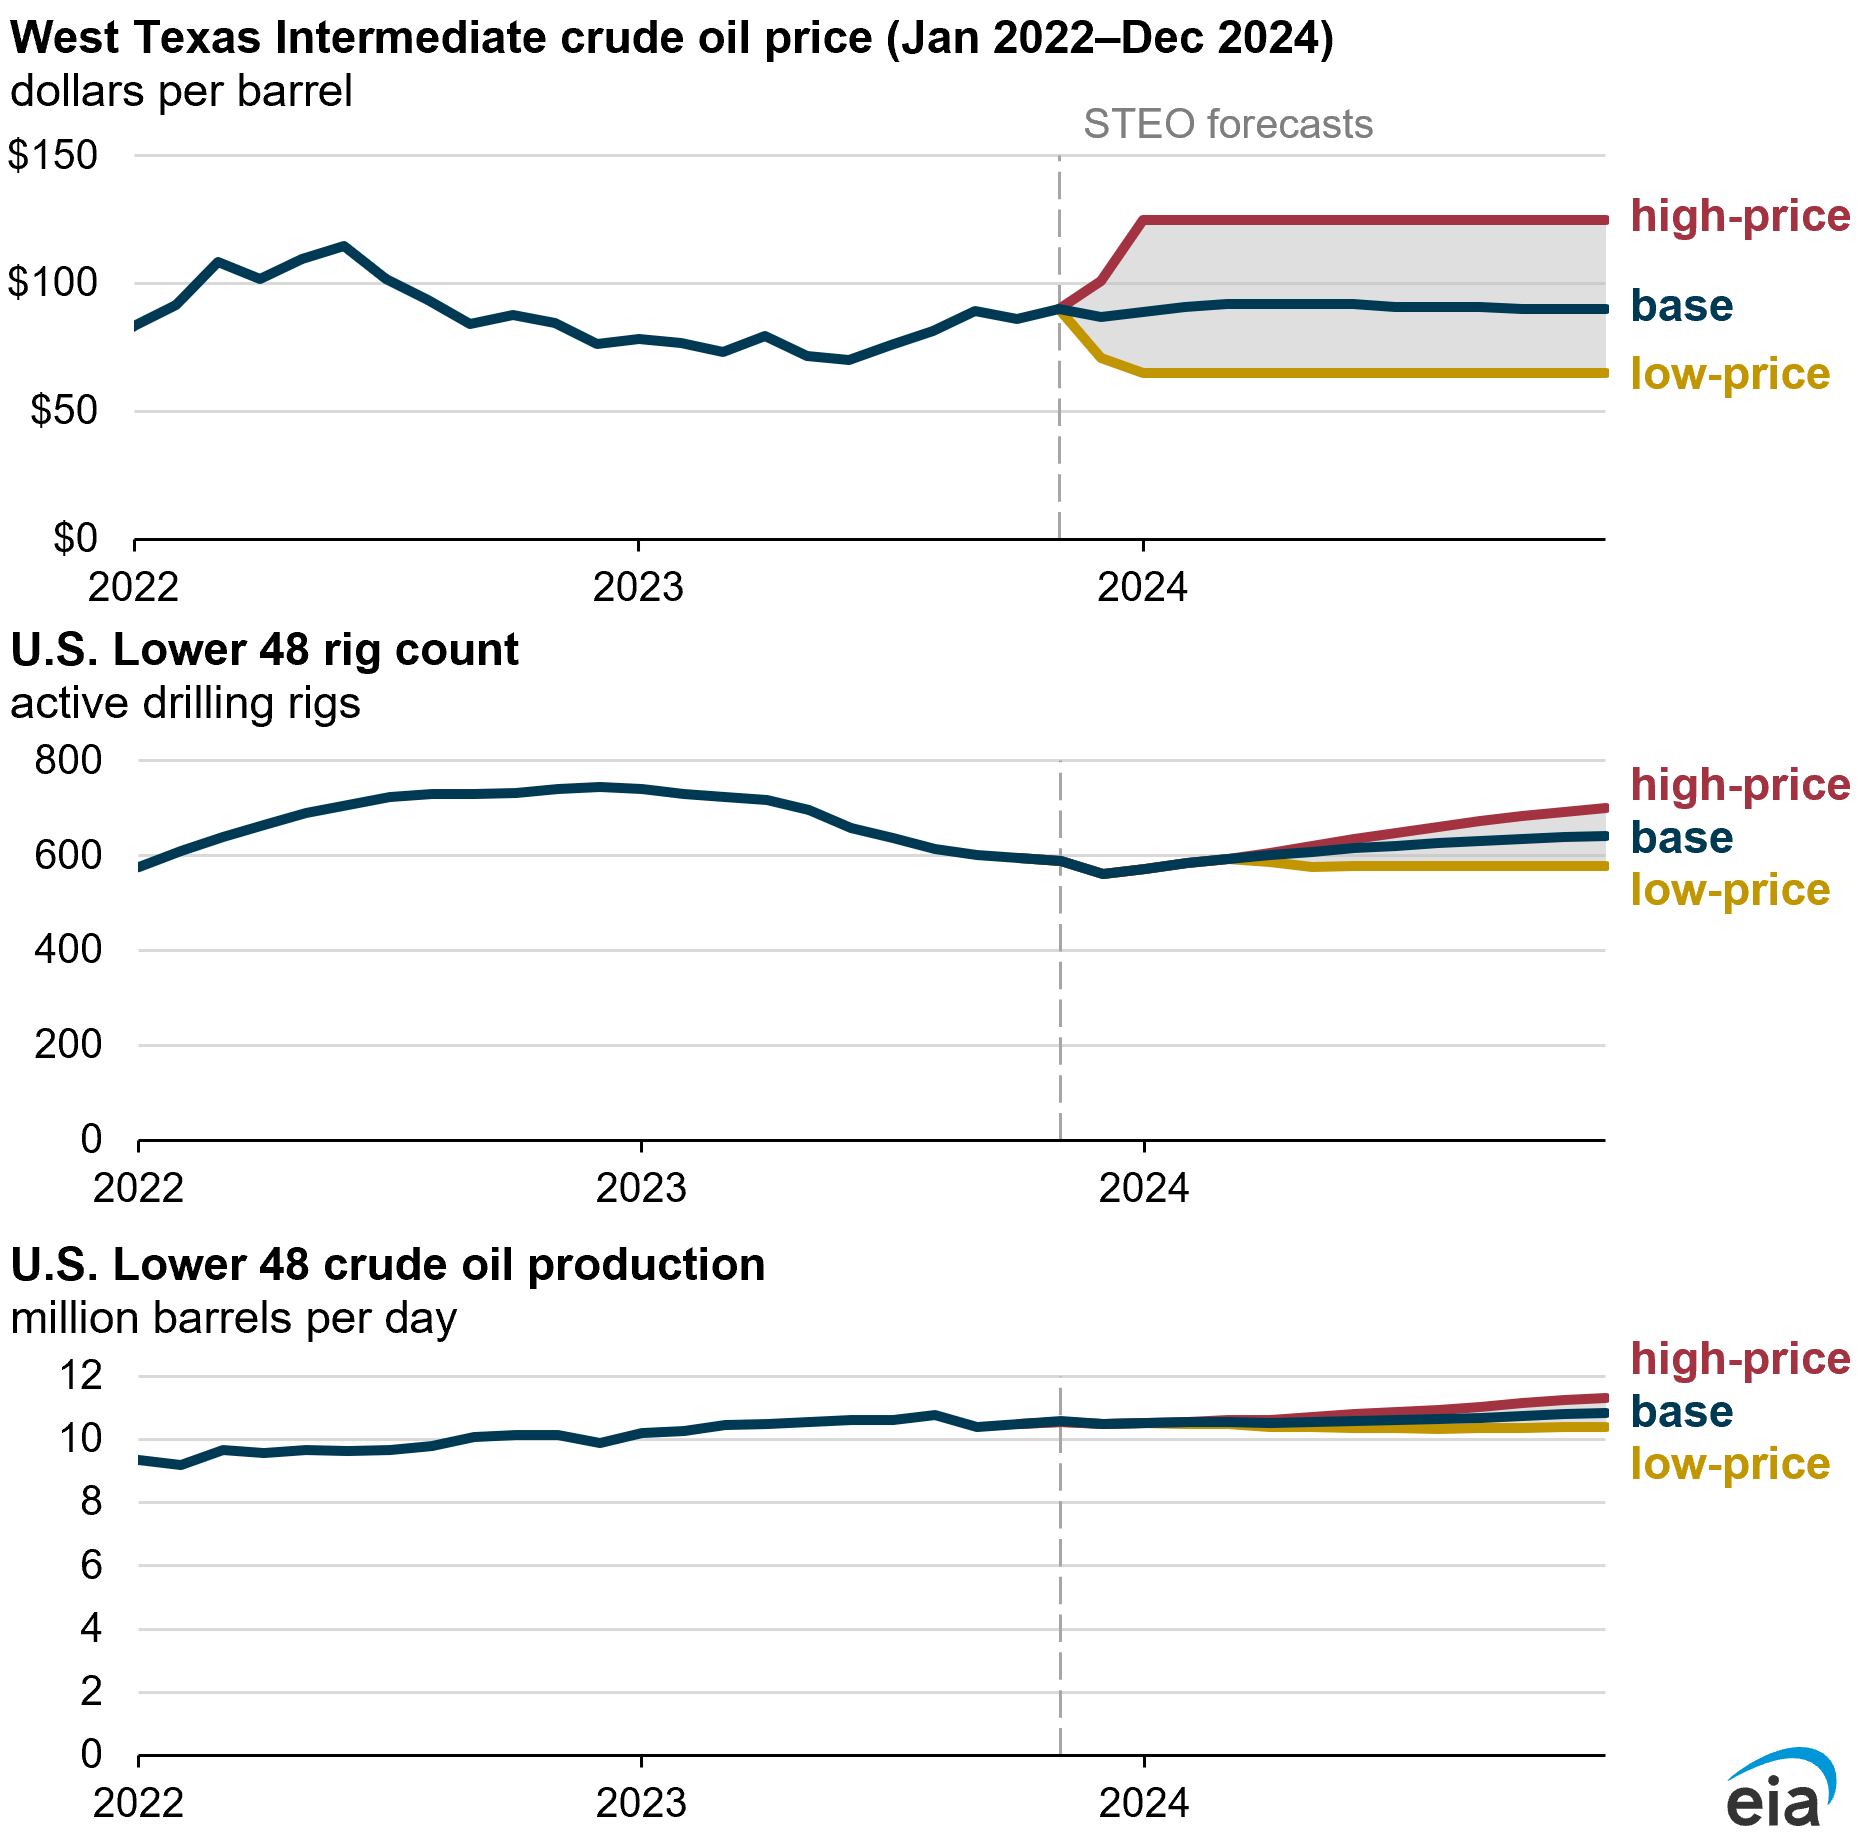
Rig count. Our latest rig count forecast extends from October 2023, when 594 rigs were active. In our high and low price cases, following the divergence in the WTI price that starts in December 2023, the rig counts begin to diverge four months later, by April 2024. By December 2024, the active rig count ranges from 580 rigs in the low-price case to 700 rigs in the high-price case.
Lower 48 crude oil production. Operators change rig levels about four months after price changes, but operators can also modify production without deploying or removing rigs. For example, as prices increase, producers can opt to complete more wells, generally within about two months. For this reason, the change in production is both sooner and more gradual than the change in rig counts alone would suggest.
In this analysis, as prices diverge after November 2023, our production forecasts diverge after January 2024. By December 2024, crude oil production in the Lower 48 states reaches 11.1 million b/d in the base case, 11.4 million b/d in the high-price case, and 10.7 million b/d in the low-price case.
Data values: Energy Prices and U.S. Petroleum and Other Liquids Supply, Consumption, and Inventories
Production is more responsive to price decreases than increases. Prices rise more in the high-price case (by $39/b, or 45%, from our November forecast price of $86/b) than they fall in the low-price case (by $21/b, or 24%), and the production response is not symmetric. Our forecast crude oil production in the Lower 48 states increases by 3.4% in the high-price case and decreases by 3.0% in the low-price case, relative to the base case, by December 2024.
Based on observations of drilling and production activity in recent years, producers have been less responsive to price increases than decreases. We attribute this asymmetric response to price changes to several factors:
- Supply chain difficulties in deploying rigs and crews
- Higher interest rates, which reduce the net present value of investment in future oil production
- Unwillingness to rely on debt or equity financing for capital projects (using instead cash flow from operations to finance new projects)
In contrast, as crude oil prices decline, oil companies can rapidly respond by cutting costs, including cutting drilling rigs and crews. The effect is compounded because of the high natural decline rate in tight oil formations, which requires more investment to minimize declines than conventional wells. As a result, the modeled effects in the low-price case result in proportionately higher production declines.
Takeaway capacity is sufficient in the high-price case. Infrastructure constraints can impose an upper limit on production because sufficient pipeline capacity must be available to transfer the production to demand centers. The Permian region is the most prolific crude oil and natural gas production region in the Lower 48 states and it is the only region potentially limited by available pipeline capacity in the short term.
However, with the current levels of pipeline buildouts planned in the next year, we don’t expect pipeline constraints in the Permian. Production in other regions such as the Bakken, Eagle Ford, Niobrara, and Anadarko have not returned to their pre-pandemic levels and therefore have sufficient takeaway capacity with existing infrastructure.
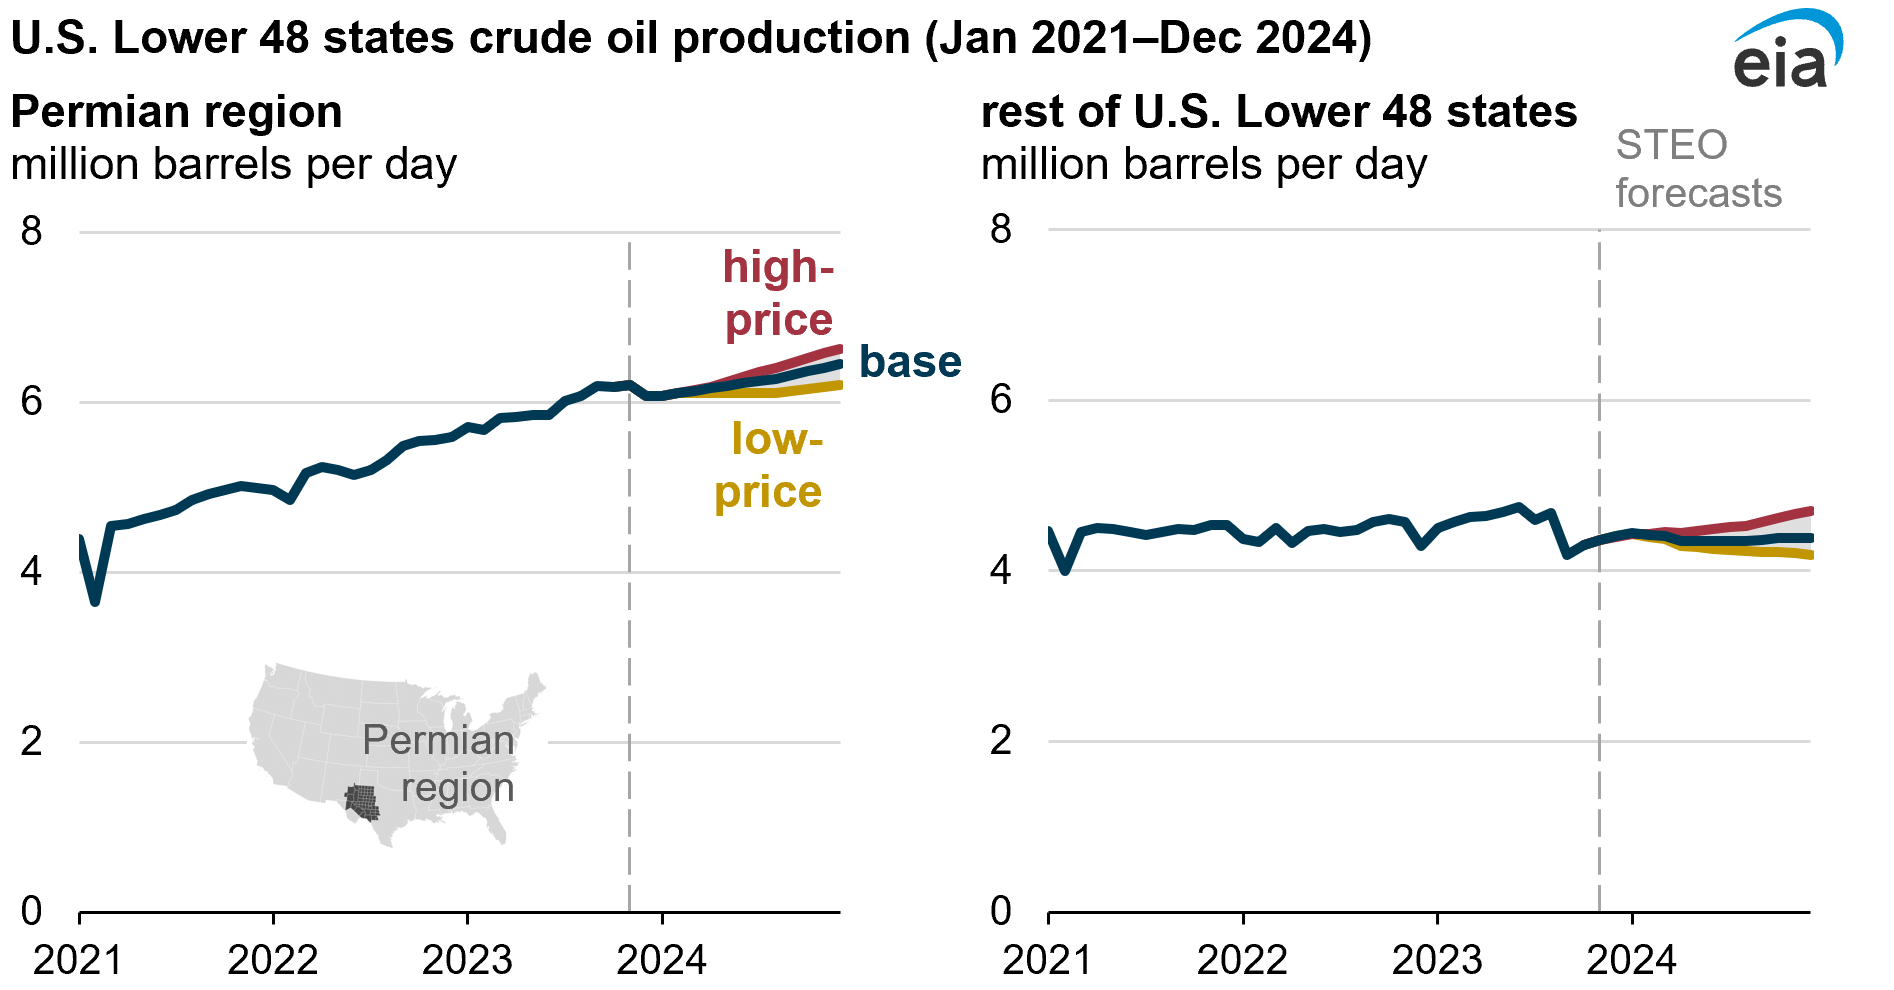
We forecast that Permian production will reach 6.5 million b/d in the base case, 6.6 million b/d in the high-price case, and 6.2 million b/d in the low-price case by December 2024. Similarly, marketed natural gas production in the Permian region ranges between 23 billion cubic feet per day (Bcf/d) and 25 Bcf/d by December 2024.
EIA monitors and updates changes in petroleum liquids and natural gas infrastructure projects and we update these databases twice per year. Based on our evaluation of existing and planned pipeline projects and third-party regional demand estimates, we expect the Permian region will have sufficient takeaway capacity for crude oil and natural gas production through 2024, even in the high-price case.