Analysis of Carbon Fee Runs Using the Annual Energy Outlook 2021
Executive Summary
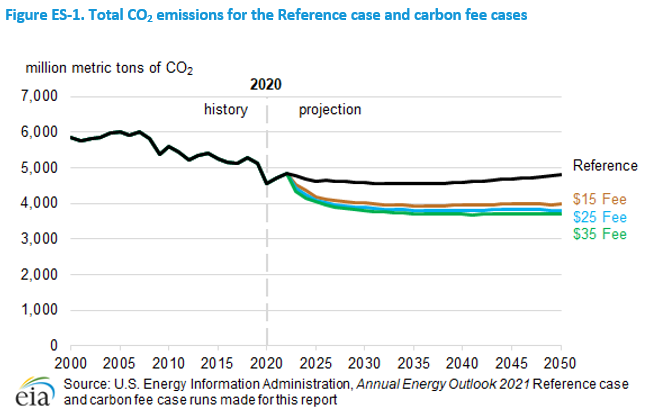
Our analysis indicates that the carbon fee levels presented in this report would initially reduce the levels of U.S. energy-related carbon dioxide (CO2) emissions. Emissions would decrease the most in the first 5–10 years but have significantly less effect beyond that period (Figure ES-1). The three carbon fee cases we examine assume economy-wide implementation of fees that start at $15.14, $25.23, and $35.33 per metric ton of CO2 in 2023 and grow by 5% each year thereafter up through 2050. These cases are labeled as the $15, $25, and $35 carbon fee cases for simplicity.
In the highest-priced $35 Fee case, we project 23% less U.S. energy-related CO2 emissions in 2050 than in the AEO2021 Reference case, which assumes no changes in current laws and regulations and current views on the rate of technology improvements. In the $35 Fee case, we project a reduction of 19% in U.S. energy-related CO2 emissions by 2050 compared with 2020. The Reference case projects an increase of more than 5% in CO2 emissions between 2020 and 2050.
figure data
The most immediate CO2 reductions come by replacing coal-fired generation in the electric power sector with natural gas or non-emitting renewables. These reductions occur for all modeled fee cases. Other pathways to emissions reductions, such as reducing CO2 from bulk chemical production and from significantly greater penetration of alternative-fueled vehicles, require higher fees than we explored.
Electricity
The majority of emissions reductions that occur in response to carbon fees come from the U.S. electric power sector, amounting to 82% of the difference in projected CO2 emissions in 2050 when comparing the $35 Fee case with the AEO2021 Reference case in 2050.
Fuel substitution is relatively inexpensive in the electric power sector in the short term as coal is displaced by natural gas. In the medium to long term, more renewables and energy storage capacity leads to further CO2 reductions in the carbon fee cases. The majority of the projected capacity additions come from solar photovoltaics.
In addition, not only is less nuclear power capacity retired in the carbon fee cases relative to the AEO2021 Reference case, but new capacity is added. More natural gas capacity is retired and less new capacity is added in the carbon fee cases compared with the Reference case, although natural gas-fired plants with carbon capture and storage (CCS) technology become cost competitive before 2050.
Carbon fees increase the contribution of renewable generation in these cases as renewables, such as wind and solar, become more cost competitive relative to fossil fuels. The carbon fee cases also increase the economic viability of energy storage facilities used to help manage the variation of intermittent renewable resources.
Transportation
The effects of carbon fees on transportation-related CO2 emissions are much more limited. In our modeling, a $35 carbon fee reduces U.S. energy-related CO2 emissions from transportation by 6% in 2050 relative to the Reference case.
In the $35 Fee case, CO2 emissions from light-duty vehicles decline 11% in the United States by 2050, 7 percentage points more than the 4% decline in the Reference case. By 2050, CO2 emissions from freight trucks decline by 2% in the $35 Fee case, when they had increased by 7% by 2050 in the Reference case. Air travel emissions are relatively unaffected in these cases.
Despite 9% annual growth in electricity sales to the transportation sector during the projection period in the $35 Fee case, petroleum remains the most consumed transportation fuel.
Industry
Natural gas is the predominant fossil fuel consumed by the U.S. industrial sector. Electricity purchases play a relatively smaller role in this sector. Although emissions decline in the carbon fee cases relative to the Reference case, emissions begin increasing after 2040 as gross output continues to rise with increasing economic growth.
The response to carbon fees varies by industry. For example, energy-intensive industries without readily substitutable alternative fuels, such as the bulk chemicals industry, show a relatively small reduction in CO2 emissions in response to carbon fees.
Modeling background
The carbon fee cases discussed in this paper assume economy-wide implementation of a $15.14, $25.23, and $35.33 carbon fee (2020 dollars per metric ton of CO2) starting in 2023. These fees increase by 5% in real terms per year. Emission fee revenues are distributed back to consumers through lump-sum payments, keeping the policy revenue neutral. We made these projections using the National Energy Modeling System (NEMS), which uses a market-based approach, subject to current regulations and standards. For each fuel and consuming sector, NEMS balances energy supply and demand, accounting for economic competition across the various energy fuels and sources. The projection period in NEMS currently extends to 2050.
The current NEMS is limited in its ability to run deep decarbonization scenarios. Although we regularly undertake significant NEMS model development, we have not been able to invest sufficiently to fully model deep decarbonization or net-zero emissions scenarios, which would require the model to better represent fuels and technologies such as:
- Biofuels
- Carbon capture, transport, and storage
- Advanced electrification
- Hydrogen deployment
We are working to assess our energy modeling capabilities and to develop a plan to modernize and integrate the modeling platforms and tools used to produce our flagship energy outlooks and forecasts.
Until we can make those changes, we are committed to doing the work we can to illuminate the potential effects of climate policy options.
Introduction
The Annual Energy Outlook 2020 (AEO2020) included an Issues in Focus article that incorporated carbon fee cases based on the AEO2020 Reference case that contained historical data through 2019 and therefore did not include the impact of the COVID-19 pandemic. We have updated these carbon fee cases based on the Annual Energy Outlook 2021 (AEO2021) Reference case. This Reference case includes the drop in energy consumption and related carbon dioxide (CO2) emissions starting in 2020 caused by the COVID-19 pandemic that was not included in fee cases run for AEO2020. The carbon fees in these cases begin in 2023, after the U.S. economy is projected to have generally returned to pre-pandemic levels.
Under the effort to reduce carbon emissions, how existing energy markets will change remains uncertain. How to represent low-carbon technologies within the context of energy models such as the National Energy Modeling System (NEMS) also remains uncertain. For example, in the electric power sector, market participants are seeing a growing incentive to use intermittent, non-dispatchable resources such as wind and solar. However, the integration of very high penetration levels of these resources is still a subject of research by electrical grid operators, as are improved approaches for representing this shift in our long-term energy models.
Overview
The AEO2021 Reference case assumes that existing laws and regulations remain as currently enacted throughout the projection period, including when the laws or policies are scheduled to end (or sunset). The Reference case also reflects current views on economic and demographic trends and technology improvements. However, we explored the impact of policies that reduce carbon emissions in three additional cases. Carbon fees are potential policy mechanisms that could be employed to change the relative prices of carbon-producing fuels. We modeled three levels of economy-wide carbon fees. These fees apply only to CO2 from energy combustion and do not include other gases, such as methane, or other sources of CO2, such as from natural gas processing.
Fee cases
The carbon fee cases assume economy-wide implementation of a $15.14, $25.23, and $35.33 fee (2020 dollars per metric ton of CO2) starting in 2023. We label these cases as the $15, $25, and $35 carbon fee cases for simplicity. These fees increase by 5% (in real dollars) per year and reach $56.52, $94.21, and $131.89 per metric ton of CO2, respectively, by 2050 (Table 1). Emission fee revenues are distributed back to consumers through lump-sum payments, keeping the policy revenue neutral. Incorporating CO2 fees increases the costs of certain forms of energy and reduces total consumer disposable income available for non-energy purchases; returning revenues to consumers helps offset some of the loss in disposable income but does not completely mitigate it.
Table 1. Economy-wide CO2 emissions fees and their effect on selected energy product prices in the AEO2021
(2020 dollars per metric ton of carbon dioxide, and dollars per physical unit of fuel)
| Carbon fee case |
Carbon fee in 2023 |
Carbon fee in 2050 |
| $15 Fee case (2020 dollars per metric ton of CO2) |
$15.14 |
$56.52 |
| Gasoline(dollars per gallon) |
$0.13 |
$0.48 |
| Diesel (dollars per gallon) |
$0.15 |
$0.57 |
| Natural gas (dollars per thousand cubic feet) |
$0.84 |
$3.12 |
| Coal (dollars per short ton) |
$27.60 |
$103.03 |
| $25 Fee case (2020 dollars per metric ton of CO2) |
$25.23 |
$94.21 |
| Gasoline (dollars per gallon) |
$0.22 |
$0.81 |
| Diesel (dollars per gallon) |
$0.25 |
$0.95 |
| Natural gas (dollars per thousand cubic feet) |
$1.39 |
$5.20 |
| Coal (dollars per short ton) |
$45.99 |
$171.74 |
| $35 Fee case (2020 dollars per metric ton of CO2) |
$35.33 |
$131.89 |
| Gasoline (dollars per gallon) |
$0.30 |
$1.13 |
| Diesel (dollars per gallon) |
$0.36 |
$1.33 |
| Natural gas (dollars per thousand cubic feet) |
$1.95 |
$7.28 |
| Coal (dollars per short ton) |
$64.40 |
$240.42 |
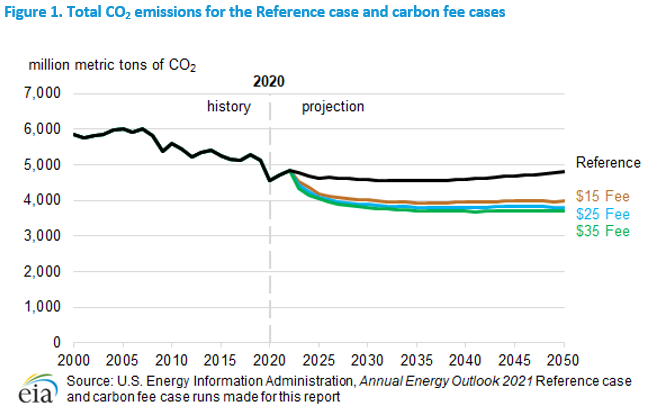
The three carbon fee cases project that total U.S. energy-related CO2 emissions will decline early in the projection period before leveling off in the late 2030s. The U.S. electric power sector is the most responsive sector to carbon fees, as coal loses market share to natural gas and renewables faster than we projected in the AEO2021 Reference case. The $35 Fee case projects that total U.S. energy-related CO2 emissions would be 23% lower in 2050 than in the AEO2021 Reference case and 19% lower in 2050 than in 2020. The electric power sector accounts for most of these emissions reductions at 82% of the 2050 decrease in emissions between the $35 Fee case and the AEO2021 Reference case.
The AEO2021 Reference case contains the 2020 COVID-19-related drop and later increase in energy demand and related CO2. The 2022 emissions level (the last year before the fee is implemented) is projected to be 4,845 million metric tons (MMmt), or about 6% above 2020 and about 6% below 2019 levels.
Total CO2 emissions
figure data
Table 2. Carbon fees, annual energy-related CO2 emissions, and changes in emissions from previous five years for the Reference case and carbon fee cases
| Cases |
2020 |
2025 |
2030 |
2035 |
2040 |
2045 |
2050 |
| Reference case |
| Fee in 2020$ per metric ton |
$0.00 |
$0.00 |
$0.00 |
$0.00 |
$0.00 |
$0.00 |
$0.00 |
| Fee in nominal dollars per metric ton |
$0.00 |
$0.00 |
$0.00 |
$0.00 |
$0.00 |
$0.00 |
$0.00 |
| Annual CO2 emissions (million metric tons) |
4,563 |
4,623 |
4,584 |
4,553 |
4,596 |
4,691 |
4,807 |
| Five-year change in CO2 emissions (million metric tons) |
|
60 |
-39 |
-31 |
43 |
95 |
116 |
| $15 Fee case |
| Fee in 2020$ per metric ton |
$0.00 |
$16.69 |
$21.30 |
$27.19 |
$34.70 |
$44.29 |
$56.52 |
| Fee in nominal dollars per metric ton |
$0.00 |
$18.04 |
$26.08 |
$37.50 |
$53.21 |
$76.02 |
$111.42 |
| Annual CO2 emissions (million metric tons) |
4,563 |
4,194 |
4,006 |
3,941 |
3,946 |
3,983 |
3,977 |
| Five-year change in CO2 emissions (million metric tons) |
|
-369 |
-188 |
-65 |
5 |
36 |
-6 |
| $25 Fee case |
| Fee in 2020$ per metric ton |
$0.00 |
$27.82 |
$35.51 |
$45.32 |
$57.83 |
$73.81 |
$94.21 |
| Fee in nominal dollars per metric ton |
$0.00 |
$30.16 |
$43.55 |
$62.70 |
$89.18 |
$127.57 |
$187.29 |
| Annual CO2 emissions (million metric tons) |
4,563 |
4,097 |
3,890 |
3,810 |
3,799 |
3,830 |
3,805 |
| Five-year change in CO2 emissions (million metric tons) |
|
-465 |
-207 |
-80 |
-11 |
30 |
-24 |
| $35 Fee case |
| Fee in 2020$ per metric ton |
$0.00 |
$38.95 |
$49.71 |
$63.44 |
$80.97 |
$103.34 |
$131.89 |
| Fee in nominal dollars per metric ton |
$0.00 |
$42.34 |
$61.07 |
$88.01 |
$125.48 |
$179.86 |
$264.39 |
| Annual CO2 emissions (million metric tons) |
4,563 |
4,042 |
3,808 |
3,716 |
3,693 |
3,702 |
3,695 |
| Five-year change in CO2 emissions (million metric tons) |
|
-522 |
-233 |
-92 |
-23 |
9 |
-7 |
Fossil Fuels
Carbon fees affect consumption of fossil fuels and non-carbon-emitting alternative fuels differently. The factors that influence the response in our projection to the carbon fees include:
- The carbon intensity of the fuel—measured in this report as kilograms (kg) of CO2 per million British thermal units (MMBtu)
- The efficiency and carbon intensity of the fuel’s production
- The demand response of the fuel to changes in the fuel’s price
- The availability of substitute energy sources
Table 3. Annual fossil fuel-related carbon fees, CO2 emissions, and changes in CO2 emissions from previous five years by carbon fee case
| Cases |
2020 |
2025 |
2030 |
2035 |
2040 |
2045 |
2050 |
| $15 Fee case |
| Fee in 2020$ per metric ton |
$0.00 |
$16.69 |
$21.30 |
$27.19 |
$34.70 |
$44.29 |
$56.52 |
| Fee in nominal dollars per metric ton |
$0.00 |
$18.04 |
$26.08 |
$37.50 |
$53.21 |
$76.02 |
$111.42 |
| Annual CO2 emissions (million metric tons) |
| Coal |
862 |
265 |
167 |
121 |
101 |
96 |
95 |
| Petroleum |
2,016 |
2,167 |
2,142 |
2,129 |
2,129 |
2,156 |
2,185 |
| Natural gas |
1,675 |
1,752 |
1,687 |
1,679 |
1,705 |
1,719 |
1,685 |
| Five-year change in CO2 emissions (million metric tons) |
| Coal |
|
-597 |
-98 |
-45 |
-20 |
-5 |
-1 |
| Petroleum |
|
151 |
-25 |
-13 |
0 |
28 |
29 |
| Natural gas |
|
77 |
-66 |
-7 |
26 |
14 |
-34 |
| $25 Fee case |
| Fee in 2020$ per metric ton |
$0.00 |
$27.82 |
$35.51 |
$45.32 |
$57.83 |
$73.81 |
$94.21 |
| Fee in nominal dollars per metric ton |
$0.00 |
$30.16 |
$43.55 |
$62.70 |
$89.18 |
$127.57 |
$187.29 |
| Annual CO2 emissions (million metric tons) |
| Coal |
861 |
194 |
125 |
101 |
89 |
93 |
93 |
| Petroleum |
2,016 |
2,156 |
2,134 |
2,120 |
2,116 |
2,137 |
2,157 |
| Natural gas |
1,675 |
1,737 |
1,620 |
1,578 |
1,583 |
1,588 |
1,544 |
| Five-year change in CO2 emissions (million metric tons) |
| Coal |
|
-668 |
-69 |
-24 |
-12 |
3 |
0 |
| Petroleum |
|
140 |
-22 |
-14 |
-4 |
21 |
20 |
| Natural gas |
|
62 |
-117 |
-42 |
5 |
5 |
-44 |
| $35 Fee case |
| Fee in 2020$ per metric ton |
$0.00 |
$38.95 |
$49.71 |
$63.44 |
$80.97 |
$103.34 |
$131.89 |
| Fee in nominal dollars per metric ton |
$0.00 |
$42.34 |
$61.07 |
$88.01 |
$125.48 |
$179.86 |
$264.39 |
| Annual CO2 emissions (million metric tons) |
| Coal |
863 |
169 |
115 |
96 |
88 |
92 |
91 |
| Petroleum |
2,016 |
2,148 |
2,127 |
2,109 |
2,097 |
2,115 |
2,135 |
| Natural gas |
1,675 |
1,714 |
1,556 |
1,500 |
1,496 |
1,485 |
1,457 |
| Five-year change in CO2 emissions (million metric tons) |
| Coal |
|
-693 |
-55 |
-18 |
-8 |
3 |
0 |
| Petroleum |
|
132 |
-21 |
-17 |
-12 |
17 |
20 |
| Natural gas |
|
39 |
-158 |
-57 |
-3 |
-12 |
-27 |
Coal
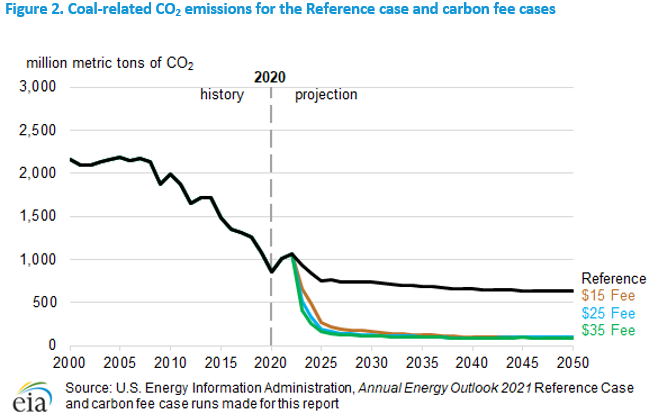
Coal in the United States is mainly used as an energy source in the electric power sector. It is also consumed to a lesser extent in the industrial sector. Coal is the most carbon-intensive of the major fossil fuels; it has a typical intensity of about 96 kg CO2/MMBtu of energy consumed. In the electric power sector, coal competes directly with natural gas (the least carbon-intensive fossil fuel with 53 kg CO2/MMBtu of carbon intensity), nuclear, and renewable generation. Because of coal’s high carbon intensity and the ready availability of substitutes in the electric power sector, projected coal consumption greatly decreases by 2025 in all carbon fee cases, leading to sizeable reductions in coal-related CO2 emissions (Table 3), as coal-fired generating capacity in the electric power sector is retired because of its increased operating cost. Coal retirements continue beyond 2025, although not as rapidly.
In the industrial sector, coal-related emissions decrease slightly after 2025—by 9 MMmt in the $35 Fee case. This small amount of decline is because substitutes are not as readily available in certain industrial processes, such as iron and steel production, leading to less sensitivity to a carbon fee.
In the AEO2021 Reference case, many coal-fired electricity generating plants continue to operate under current policies, and coal-related CO2 emissions in the United States in 2050 are more than seven times greater than in the carbon fee cases as shown in Figure 2.
figure data
Petroleum
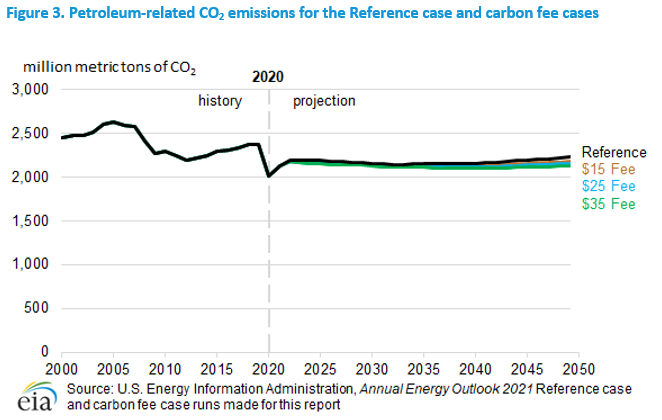
Petroleum is an energy source used in all sectors of the U.S. economy, but it is most significantly used in the transportation and industrial sectors. The carbon intensity of major petroleum products ranges from 71 kg CO2/MMBtu for motor gasoline to 72 kg CO2/MMBtu for jet fuel to 75 kg CO2/MMBtu for residual fuel oil. The difference in projected U.S. petroleum consumption between the AEO2021 Reference case and carbon fee cases is relatively small. Despite rapid annual growth in electricity sales to the transportation sector during the projection period in the $35 Fee case, petroleum remains the main transportation fuel at the carbon-fee level of more than $1 per gallon of motor gasoline by the end of the projection period (Table 1).
Demand for petroleum in certain industrial applications such as refining and bulk chemicals is also relatively price-insensitive. As a result, by 2050, the range of emissions between the Reference case and the $35 Fee case is 5% (106 million metric tons [MMmt]) (Figure 3).
figure data
Natural gas
Natural gas has multiple uses in the U.S. energy economy. The electric power sector consumed the most natural gas in 2020, followed by the industrial sector. However, over the course of the projection period, industrial consumption of natural gas (including lease and plant fuel and natural gas used to produce liquefied natural gas for export) exceeds consumption from the electric power sector. Natural gas is also an important fuel in the residential and commercial sectors primarily because of its use in space heating, water heating, and cooking. Because natural gas is the least carbon-intensive of the fossil fuels used to generate electricity, it plays a unique role in response to carbon fees.
In the early stages of the projection period, U.S. natural gas-related CO2 emissions exceed the Reference case in all of the carbon fee cases because natural gas-fired generation in the electric power sector, as with other lower-carbon intensive sources of generation, increases as coal-fired generation decreases. Because of the relatively low carbon fees in these early years of the projection period, natural gas-fired generation continues to be economically competitive, and its associated emissions continue to grow, more than offset by the decline in emissions from coal. However, as the carbon fee increases over time, natural gas-fired generation and its associated emissions decrease at a rate commensurate with the carbon fees across the three cases. After the mid-2030s, natural gas-related CO2 emissions will remain below the Reference case in all three carbon fee cases (Figure 4).
figure data
Energy sectors
The electric power sector transforms primary energy into electrical energy that is sold to consumers in the end-use sectors. In the end-use sectors discussed below, we attribute electricity-related CO2 emissions to each sector proportionally by electricity sales to that sector.
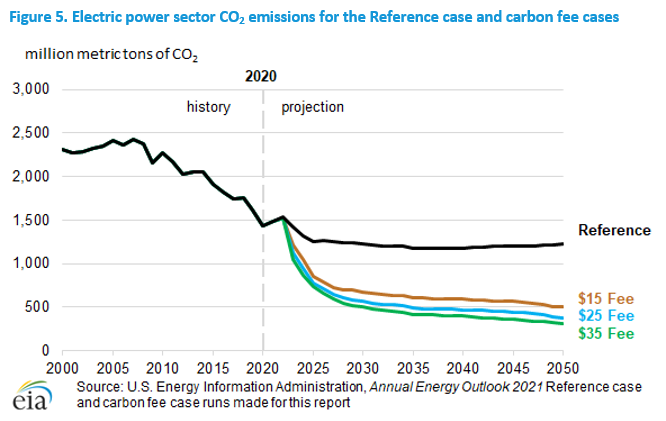
Electric power sector
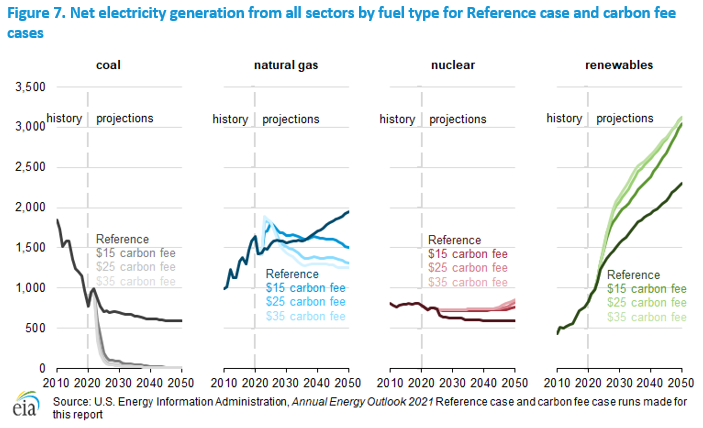
Short-term fuel substitution is relatively easy in the U.S. electric power sector as coal is displaced by natural gas. In the medium to long term, the carbon fee cases add more renewables and diurnal storage capacity, leading to further CO2 reductions (Figure 5). More than 280 gigawatts (GW) of renewable capacity and between 58 GW and 107 GW of diurnal storage capacity is added by 2050 compared with the Reference case (Figure 6). Some of renewable capacity additions come from the end-use sectors (primarily residential and commercial sector roof-top or other customer-sited solar installations), and most of the new capacity is solar photovoltaic.
In addition, not only is less nuclear power capacity retired in the carbon fee cases, but new capacity is added. In the AEO2021 Reference case, 29 GW of nuclear capacity are retired, and 2 GW of new capacity already under construction are added. In contrast, in the $15 Fee case, only 12 GW are retired, and 8 GW are added. In both the $25 Fee case and $35 Fee case, only 10 GW are retired, and 13 GW and 17 GW of new capacity is added, respectively.
Ultimately, more natural gas capacity is retired and less new capacity is added in the carbon fee cases compared with the Reference case. However, the carbon fees allow natural gas-fired plants with CCS technology to become cost competitive. Between 13 GW and 77 GW of natural gas with CCS generating capacity are added throughout the projection period in the carbon fee cases.
figure data
figure data
CO2 emissions from the U.S. electric power sector continue to decline as natural gas replaces more coal in the generation mix because of our continued expectation of low natural gas prices. In the AEO2021 Reference case, older and less efficient coal-fired generating capacity retires through 2025, but coal capacity begins leveling off as newer and more efficient units of the coal fleet remain for grid reliability, and emissions plateau thereafter. In contrast, in the carbon fee cases, more coal-fired generation retires throughout the projection period as carbon fees increase operating costs.
In addition, declining costs—along with state-level renewable portfolio standards and federal tax incentives—encourage renewable capacity growth, which further reduces coal generation (Figure 7). Wind and solar generation increase to compensate for the reduction in coal-fired generation. Wind generation increases 103% by 2050 from 2020 in the AEO2021 Reference case, compared with 220%, 231%, and 232% by 2050 in the $15 carbon fee case, $25 carbon fee case, and $35 carbon fee case, respectively. Similarly, solar photovoltaic generation increases 916% by 2050 in the Reference case, compared with over 1,300%, for all the carbon fee cases.
figure data
In the AEO2021 Reference case, renewable generation accounts for 43% of the U.S. electric generation mix in 2050. That share increases to 57% with a $15 carbon fee and to 59% with a $35 carbon fee. This increase in share is largely the result of significant projected capacity additions from wind and solar generators, as well as from energy storage facilities that help manage the diurnal variation of these resources. At higher levels of wind and solar penetration, we expect the cost of managing this intermittent generation to increase. However, how the system will operate and what additional investments or operating costs may be needed to ensure current levels of reliability remains uncertain.
Natural gas exhibits a relatively complex generation pattern in all three carbon fee cases. As coal-fired generation declines quickly after the imposition of a CO2 fee, natural gas generation grows to compensate because logistical considerations limit the growth rate of new renewable generation capacity. As a result, although total U.S. energy-related emissions decrease throughout the projection period, CO2 emissions from natural gas in the carbon fee cases actually exceed those in the AEO2021 Reference case through 2025. In the $35 Fee case, natural gas emission levels are lower than in the Reference case starting in 2026; in the $25 Fee case, they are lower starting in 2027. In the $15 Fee case, emissions from natural gas are not lower than in the Reference case until 2031 (Figure 4).
Residential sector
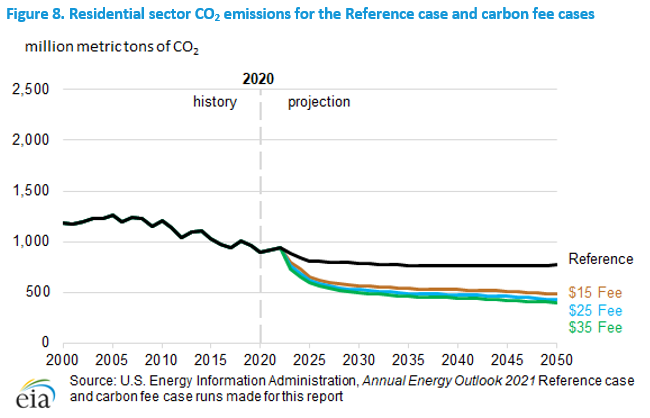
The U.S. residential sector consumed 5.0 quadrillion British thermal units (Btu) of electricity in 2020, or 44% of its total delivered energy consumption. Residential uses of electricity include heating and cooling as well as water heating and refrigeration. Because of the U.S. residential sector’s relatively large share of electric power, its response to carbon fees is proportionately large, as the decline in coal-related electricity generation and CO2 emissions lowers the carbon intensity of electricity. In the $35 carbon fee case, of the 499 MMmt decline in energy-related CO2 in the residential sector during the projection period, 91% is because of reduced electricity purchases from the electric power sector. By 2050, CO2 emissions in the $35 carbon fee case are 48% lower than the AEO2021 Reference case (Figure 8).
figure data
Commercial sector
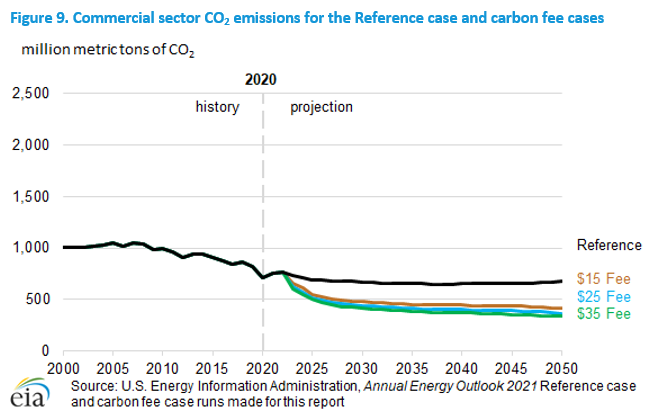
The U.S. commercial sector relies on electricity for much of its energy, especially for lighting and refrigeration. As a result, 99% of the 379 MMmt commercial sector decline in CO2 emissions by 2050 in the $35 Fee case is from the decline in electricity-related emissions. In addition, in the $35 Fee case, CO2 emissions are 50% lower than the AEO2021 Reference case in 2050 (Figure 9).
figure data
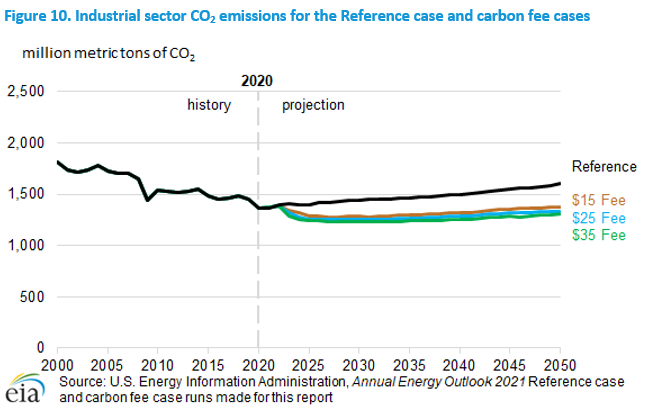
Industrial sector
The U.S. industrial sector is very heterogeneous and consumes a mix of fuels—many of them petroleum based. However, natural gas is the predominant fossil fuel consumed by the industrial sector. Electricity purchases play a relatively smaller role. Although emissions decline in the carbon fee cases relative to the Reference case (Figure 10), the difference is smaller than in the residential and commercial sectors, and emissions begin increasing after 2040 as gross output continues to rise with increasing GDP. This trend contributes to the slight emissions rise across the carbon fee cases in 2045.
The response to carbon fees varies by industry. For example, energy-intensive industries without readily substitutable alternative fuels, such as the bulk chemicals industry, show a relatively small reduction in CO2 emissions with carbon fees. In the $35 Fee case, emissions from the bulk chemicals sector increase by 10% between 2020 and 2050, compared with a 25% increase during the same period in the Reference case.
figure data
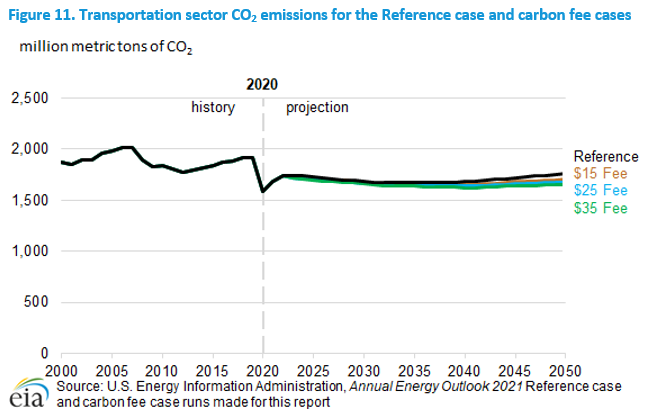
Transportation sector
Three modes of transportation account for 84% of the energy consumed in the U.S. transportation sector in the AEO2021 Reference case: light-duty vehicles (LDV) (14 quadrillion Btu in 2020), freight trucks (5 quadrillion Btu in 2020), and air travel (2 quadrillion Btu in 2020). As indicated in Figure 11, by 2050, the difference in CO2 emissions from the transportation sector between the Reference case and the $35 Fee case is 106 MMmt of CO2 (6%).
LDV CO2 emissions decline by 11% between 2020 and 2050 in the $35 Fee case, 7 percentage points more than in the AEO2021 Reference case (Table 4). CO2 emissions from freight trucks increase 7% by 2050 in the Reference case and decline by 2% in the $35 Fee case. Air travel emissions increase by about the same amount from 2020 to 2050 in the Reference and $35 Fee case, illustrating the insensitivity of air travel-related CO2 emissions to carbon emission fees at the levels considered in this report.
Emissions from all other transportation fuels combined increase 12% by 2050 in the AEO2021 Reference case and 6% in the $35 Fee case—another indication of the relative lack of demand response for transportation fuels to the price increases induced by the carbon fees in this analysis.
Even with 9% annual growth in electricity sales to the transportation sector during the projection period in the $35 Fee case, petroleum remains the main transportation fuel in 2050 at this level of carbon fee.
figure data
Table 4. Total percentage change in CO2 emissions by transportation type and case
(2020–2050)
| Types of transportation |
Reference case |
$15 Fee case |
$25 Fee case |
$35 Fee case |
| Light-duty vehicles |
-4% |
-8% |
-9% |
-11% |
| Freight trucks |
7% |
2% |
-1% |
-2% |
| Air travel |
120% |
120% |
120% |
121% |
| All other |
12% |
8% |
7% |
6% |
| Total |
11% |
7% |
5% |
4% |
Prices
Electricity
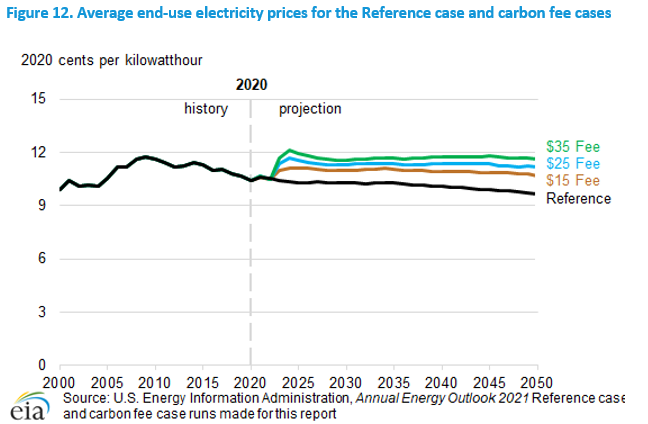
After the introduction of carbon fees in 2023, the all-sector average electricity price increases sharply, peaking in 2024 in most cases. By contrast, in the AEO2021 Reference case, the average electricity price declines over the projection period because of the relatively unchanged low natural gas prices. Average electricity prices with carbon fees remain higher than in the Reference case, even after declining from their peak in 2024 and with higher generation from low-cost renewable capacity. Between 2023 and 2050, average electricity prices are 8% higher in the $15 Fee case, 12% in the $25 Fee case, and 16% in the $35 Fee case compared with the Reference case (Figure 12 and Table 5).
figure data
Table 5. Average electricity prices to all sectors across selected years by Reference and carbon fee cases, 2020 cents per kilowatthour
| Cases |
2020 |
2025 |
2030 |
2035 |
2040 |
2045 |
2050 |
| Reference |
10.42 |
10.3 |
10.28 |
10.27 |
10.07 |
9.89 |
9.63 |
| $15 Fee |
10.42 |
11.12 |
10.98 |
11.04 |
10.93 |
10.88 |
10.68 |
| $25 Fee |
10.42 |
11.53 |
11.3 |
11.36 |
11.36 |
11.34 |
11.17 |
| $35 Fee |
10.41 |
11.96 |
11.58 |
11.66 |
11.76 |
11.78 |
11.62 |
Fossil fuels
The carbon fees have their greatest effect on coal prices, which are more than 7 times higher in the $35 Fee case in 2050 (Table 6) than in the AEO2021 Reference case. Prices are primarily affected by the carbon fee itself even as the demand for coal is lowered in the carbon fee cases, which puts downward pressure on coal prices. The carbon fees have their second-greatest effect on natural gas prices. Natural gas prices in the carbon fee cases are affected by a combination of the fee and the sustained demand for natural gas as coal consumption declines, especially in the early part of the projection period.
Table 7 indicates the effect of carbon fees on the operating costs of coal and natural gas generators. The carbon fees increase the fuel costs of all fossil fuel-fired generation. However, because natural gas-fired generation is both less carbon intensive and more energy efficient than coal-fired generation, natural gas becomes the more economical source of electricity generation. In the AEO2021 Reference case, the operating cost of coal-fired generators is lower than natural gas-fired combined-cycle generators after 2021. However, in the carbon fee cases, once the fee is imposed, the opposite occurs. The operating cost of natural gas-fired generators is less than that of coal-fired generators through the projection period. As soon as the carbon fee is imposed, the advantage in operating costs of natural gas-fired generators versus coal-fired generators contributes to the near-term switch from coal to natural gas-fired generation. Eventually, natural gas loses share to renewable generation. Higher generation costs contribute to an increase in electricity prices, as reflected in Table 5.
Table 6. National average prices for select years and fossil fuel products by Reference and carbon fee cases, 2020 dollars per million British thermal units
| Case and fuel |
2020 |
2025 |
2030 |
2035 |
2040 |
2045 |
2050 |
| Reference case |
| Motor gasoline |
$18.74 |
$20.88 |
$23.28 |
$24.55 |
$25.94 |
$26.44 |
$27.00 |
| Jet fuel |
$9.57 |
$14.32 |
$16.44 |
$17.70 |
$18.93 |
$19.89 |
$20.52 |
| Distillate |
$18.18 |
$21.21 |
$23.11 |
$23.95 |
$24.83 |
$25.44 |
$25.92 |
| Natural gas |
$4.53 |
$5.21 |
$5.70 |
$5.89 |
$5.85 |
$5.78 |
$5.90 |
| Coal |
$2.02 |
$1.97 |
$1.91 |
$1.89 |
$1.89 |
$1.89 |
$1.89 |
| $15 Fee case |
| Motor gasoline |
$18.74 |
$21.74 |
$24.01 |
$26.31 |
$28.07 |
$29.47 |
$30.83 |
| Jet fuel |
$9.57 |
$15.35 |
$17.80 |
$19.61 |
$21.58 |
$23.39 |
$24.89 |
| Distillate |
$18.18 |
$22.23 |
$24.24 |
$25.83 |
$27.40 |
$28.97 |
$30.36 |
| Natural gas |
$4.53 |
$6.14 |
$6.69 |
$7.26 |
$7.55 |
$7.98 |
$8.63 |
| Coal |
$2.02 |
$3.68 |
$4.17 |
$4.88 |
$5.80 |
$6.83 |
$8.04 |
| $25 Fee case |
| Motor gasoline |
$18.74 |
$22.52 |
$24.98 |
$27.60 |
$29.55 |
$31.64 |
$33.59 |
| Jet fuel |
$9.57 |
$16.15 |
$18.88 |
$20.98 |
$23.35 |
$25.64 |
$27.70 |
| Distillate |
$18.18 |
$23.01 |
$25.26 |
$27.15 |
$29.17 |
$31.31 |
$33.26 |
| Natural gas |
$4.53 |
$6.72 |
$7.41 |
$8.22 |
$8.81 |
$9.59 |
$10.62 |
| Coal |
$2.02 |
$4.86 |
$5.78 |
$6.83 |
$8.19 |
$9.72 |
$11.70 |
| $35 Fee case |
| Motor gasoline |
$18.74 |
$23.28 |
$25.93 |
$28.80 |
$31.21 |
$33.63 |
$36.15 |
| Jet fuel |
$9.57 |
$16.97 |
$20.00 |
$22.35 |
$24.99 |
$27.73 |
$30.43 |
| Distillate |
$18.18 |
$23.81 |
$26.32 |
$28.50 |
$30.85 |
$33.47 |
$36.11 |
| Natural gas |
$4.53 |
$7.31 |
$8.14 |
$9.16 |
$10.05 |
$11.11 |
$12.55 |
| Coal |
$2.02 |
$6.02 |
$7.26 |
$8.67 |
$10.43 |
$12.57 |
$15.33 |
Table 7. Effect of carbon fee on the fuel costs for coal- and natural gas-fired generators for select years across Reference and carbon fee cases, 2020 dollars per megawatthour
| Case and fuel |
2020 |
2021 |
2030 |
2040 |
2050 |
| Reference case |
| Natural gas |
$18.68 |
$26.72 |
$27.55 |
$28.79 |
$29.78 |
| Coal |
$19.64 |
$19.92 |
$18.32 |
$18.08 |
$17.88 |
| Difference |
($0.95) |
$6.80 |
$9.24 |
$10.71 |
$11.90 |
| $15 Fee case |
| Natural gas |
$18.68 |
$26.83 |
$36.05 |
$41.72 |
$49.27 |
| Coal |
$19.65 |
$19.94 |
$37.38 |
$49.90 |
$68.39 |
| Difference |
($0.97) |
$6.88 |
($1.33) |
($8.19) |
($19.11) |
| $25 Fee case |
| Natural gas |
$18.68 |
$26.75 |
$41.14 |
$50.40 |
$64.02 |
| Coal |
$19.63 |
$19.92 |
$51.71 |
$70.62 |
$103.54 |
| Difference |
($0.95) |
$6.84 |
($10.57) |
($20.21) |
($39.52) |
| $35 Fee case |
| Natural gas |
$18.74 |
$26.77 |
$46.62 |
$60.01 |
$79.04 |
| Coal |
$9.57 |
$19.97 |
$65.87 |
$92.08 |
$138.43 |
| Difference |
$18.18 |
$6.81 |
($19.25) |
($32.07) |
($59.39) |
Carbon Capture, Use, and Storage
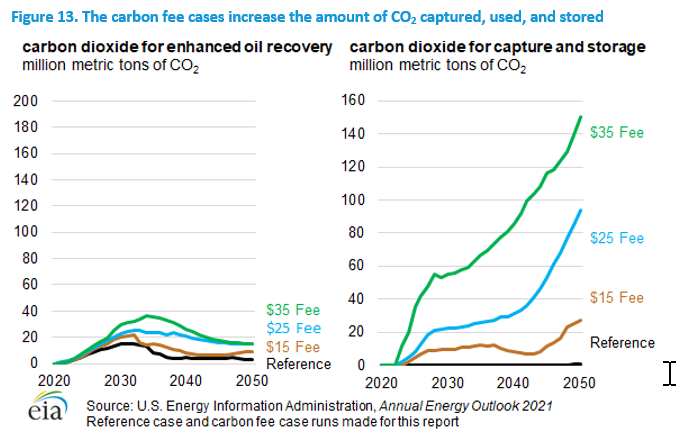
In the carbon fee cases, additional U.S. CO2 emissions are mitigated with carbon capture, use, and storage (CCUS), which removes CO2 after the electric power sector combusts fossil fuels (Figure 13). The CO2 is then transported through pipelines to be used or stored. In the AEO2021 Reference case, 0.4 MMmt of CO2 are captured in 2050. In the $15 Fee case, $25 Fee case, and $35 Fee case, 27 MMmt of CO2, 94 MMmt of CO2, and 151 MMmt of CO2 are captured annually by 2050, respectively.
figure data
In the AEO2021 Reference case, during the peak years in the early 2030s, about 12 MMmt of CO2 used for enhanced oil recovery (EOR) comes from anthropogenic sources (caused by human activity rather than derived from natural sources)—with slightly higher amounts from ethanol production than from natural gas processing. Very little CO2 for EOR comes from the electric power sector in the Reference case. Carbon fees cause this trend to change; 22 MMmt of CO2 comes from the electric power sector at the peak of total purchased anthropogenic CO2 in 2034 in the $35 Fee case, representing 75% of the total. From 2038 until the end of the projection period, electric power plants provide 100% of the anthropogenic CO2 purchased for EOR. In the Reference case, domestic oil production begins to plateau in the early 2030s, and demand for CO2 for EOR generally declines thereafter.
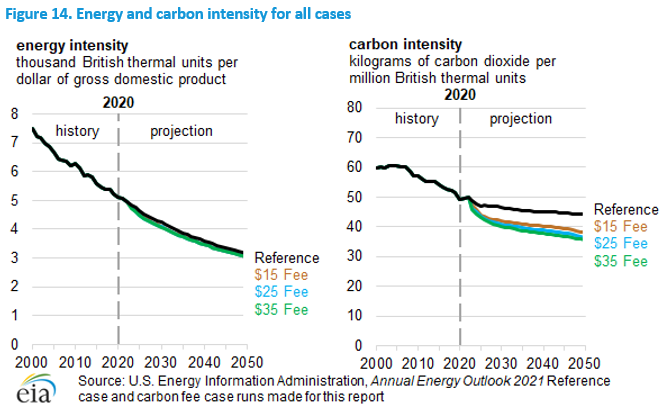
Energy and Carbon Intensity
Carbon fees affect both the energy intensity (Btu/GDP) and carbon intensity of energy consumed (Figure 14). The carbon intensity (in kg CO2/MMBtu) declines because the carbon fee encourages more carbon-intensive fuels to be replaced with less carbon-intensive ones where economically feasible. The energy intensity (thousand Btu per dollar of GDP) declines as energy prices rise with carbon fees, reducing demand for energy products and causing increases in energy efficiency. However, as evidenced by the Reference case, the declines in energy intensity are much more driven by a continuing shift toward less energy-intensive economic activity.
figure data