
Winter Fuels Outlook 2026–27
as published on October 6, 2026, unless otherwise noted
Forecast updates
- Latest forecast:
What is the Winter Fuels Outlook?
The Winter Fuels Outlook provides EIA's expectations for U.S. residential energy consumption, prices, and expenditures for the upcoming winter as well as analysis of market conditions for the four most common U.S. residential space heating fuels: natural gas, electricity, propane, and heating oil.
The average household expenditures discussed in this supplement are best interpreted as a broad guide to compare the upcoming winter with the previous winter. Differences in the housing populations complicate direct comparisons across fuels, and readers should not assume that switching to another fuel with lower energy expenditures–as presented in this report–would necessarily result in lower expenditures for their household.
We forecast average residential consumption, price, and household expenditures for the United States and, depending on the fuel, for up to four U.S. Census Bureau regions: the Northeast, Midwest, South, and West. Because these forecasts are sensitive to weather conditions, we provide two side cases that vary weather assumptions from those in our base case.
We will update these forecasts throughout the winter concurrently with our Short-Term Energy Outlook releases.
The data values and analysis below were published on October 6, 2026, and were based on price and weather forecasts from the October 2026 edition of the Short-Term Energy Outlook.
Forecast summary
Our expectations for energy expenditures this winter vary because of diverging trends in energy prices among fuels and regional variation in forecast temperatures. We expect households using natural gas and propane as the primary heating fuel—collectively about half of all U.S. households—will have lower energy expenditures this winter, primarily because of lower fuel costs. We expect higher energy expenditures for households where the primary heating fuel is electricity or heating oil because of higher prices for those fuels.
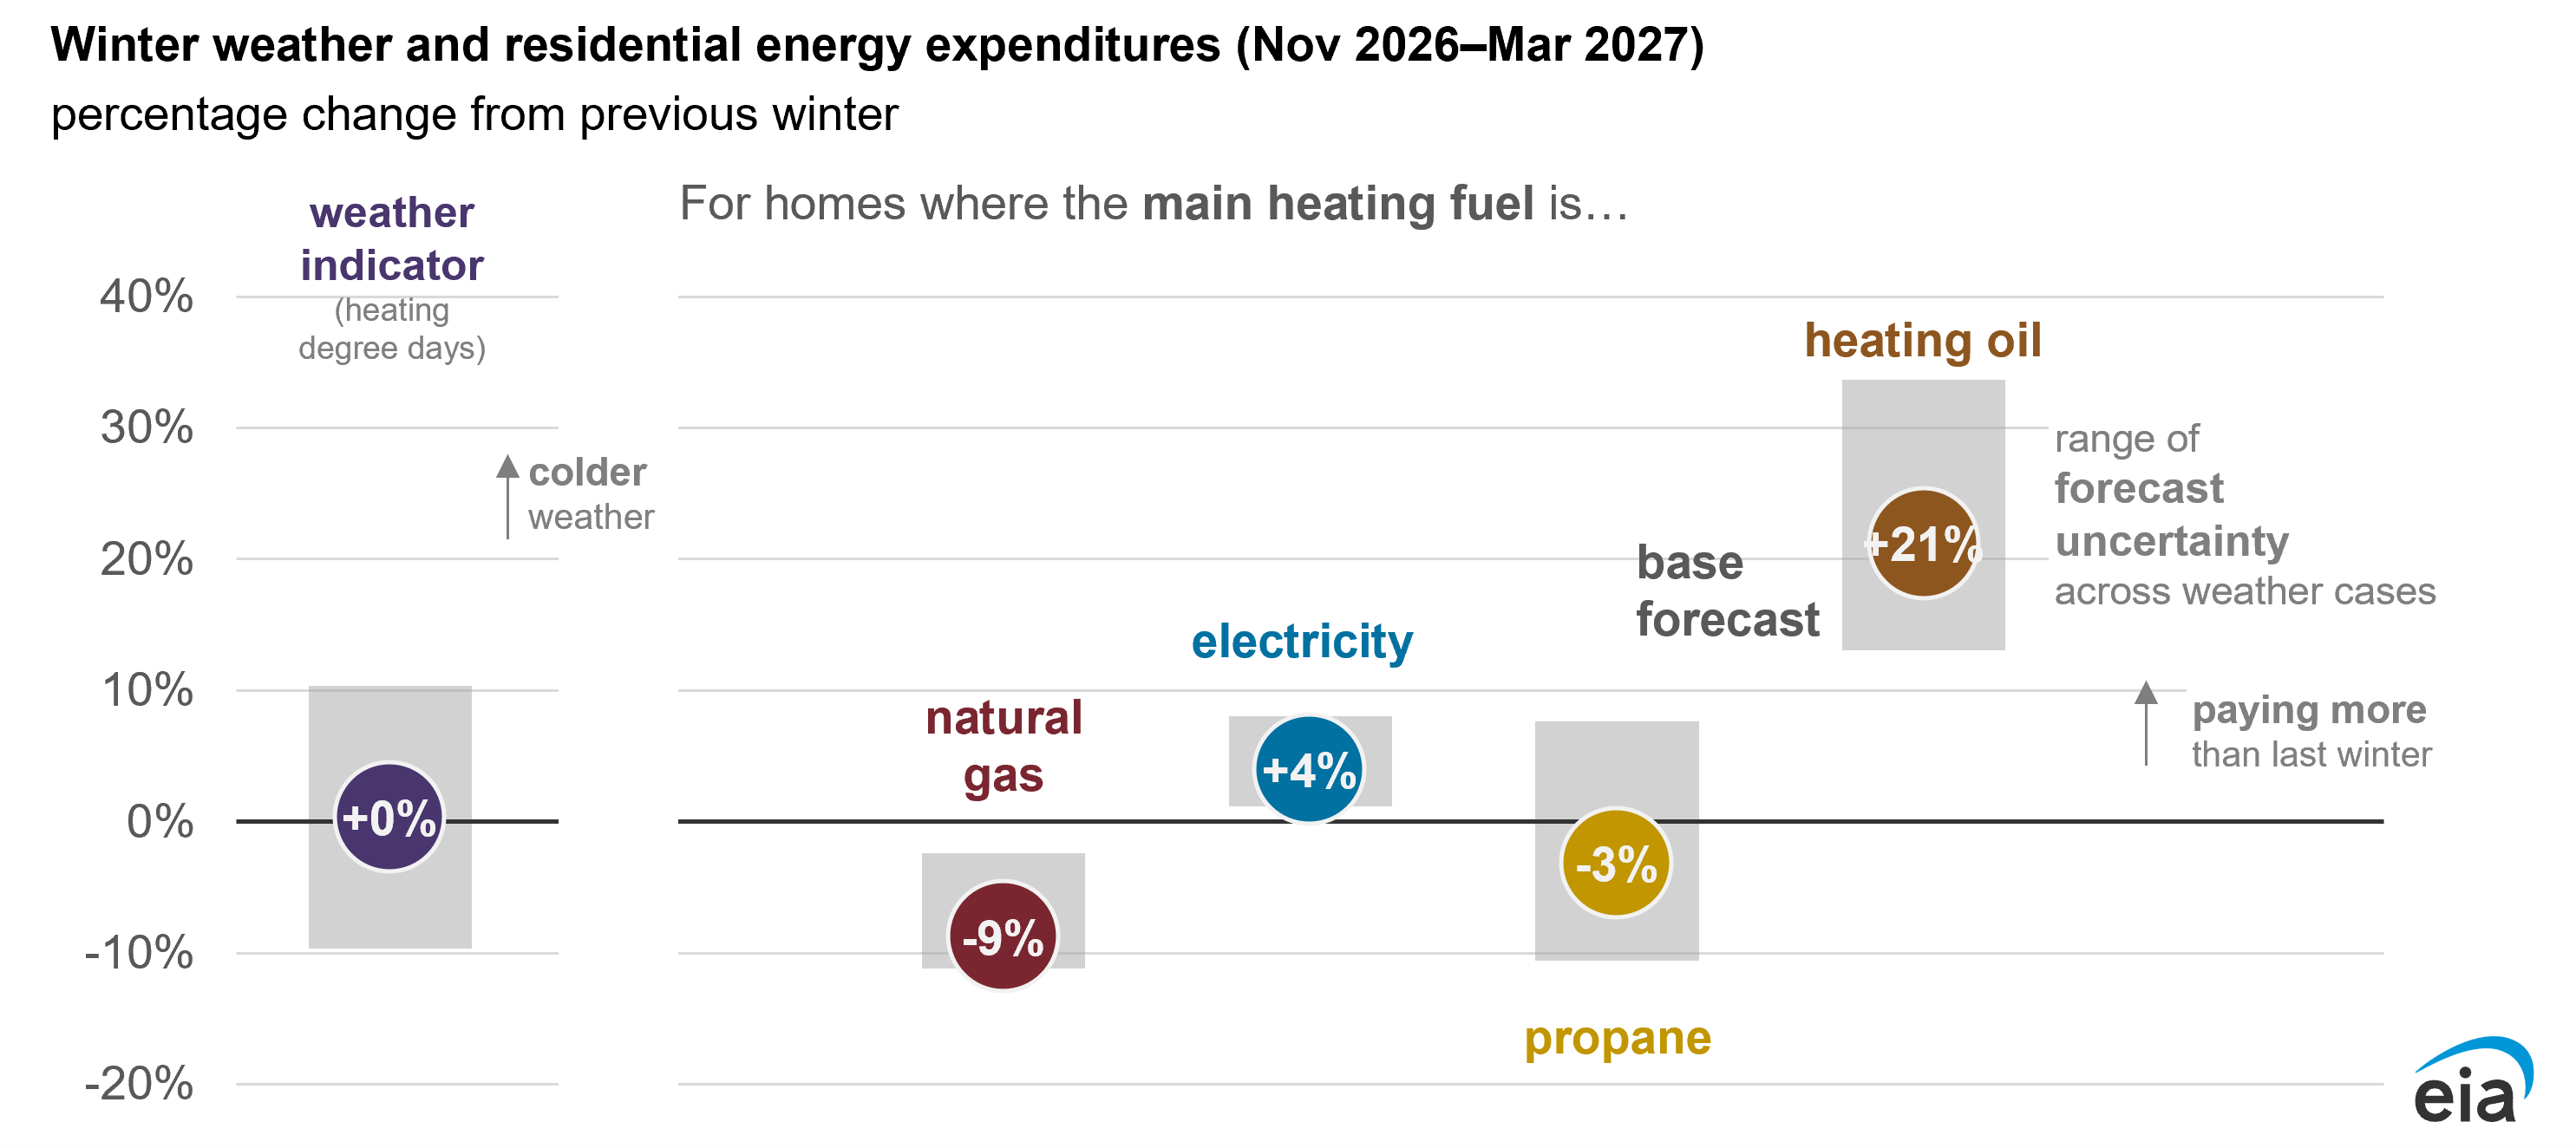
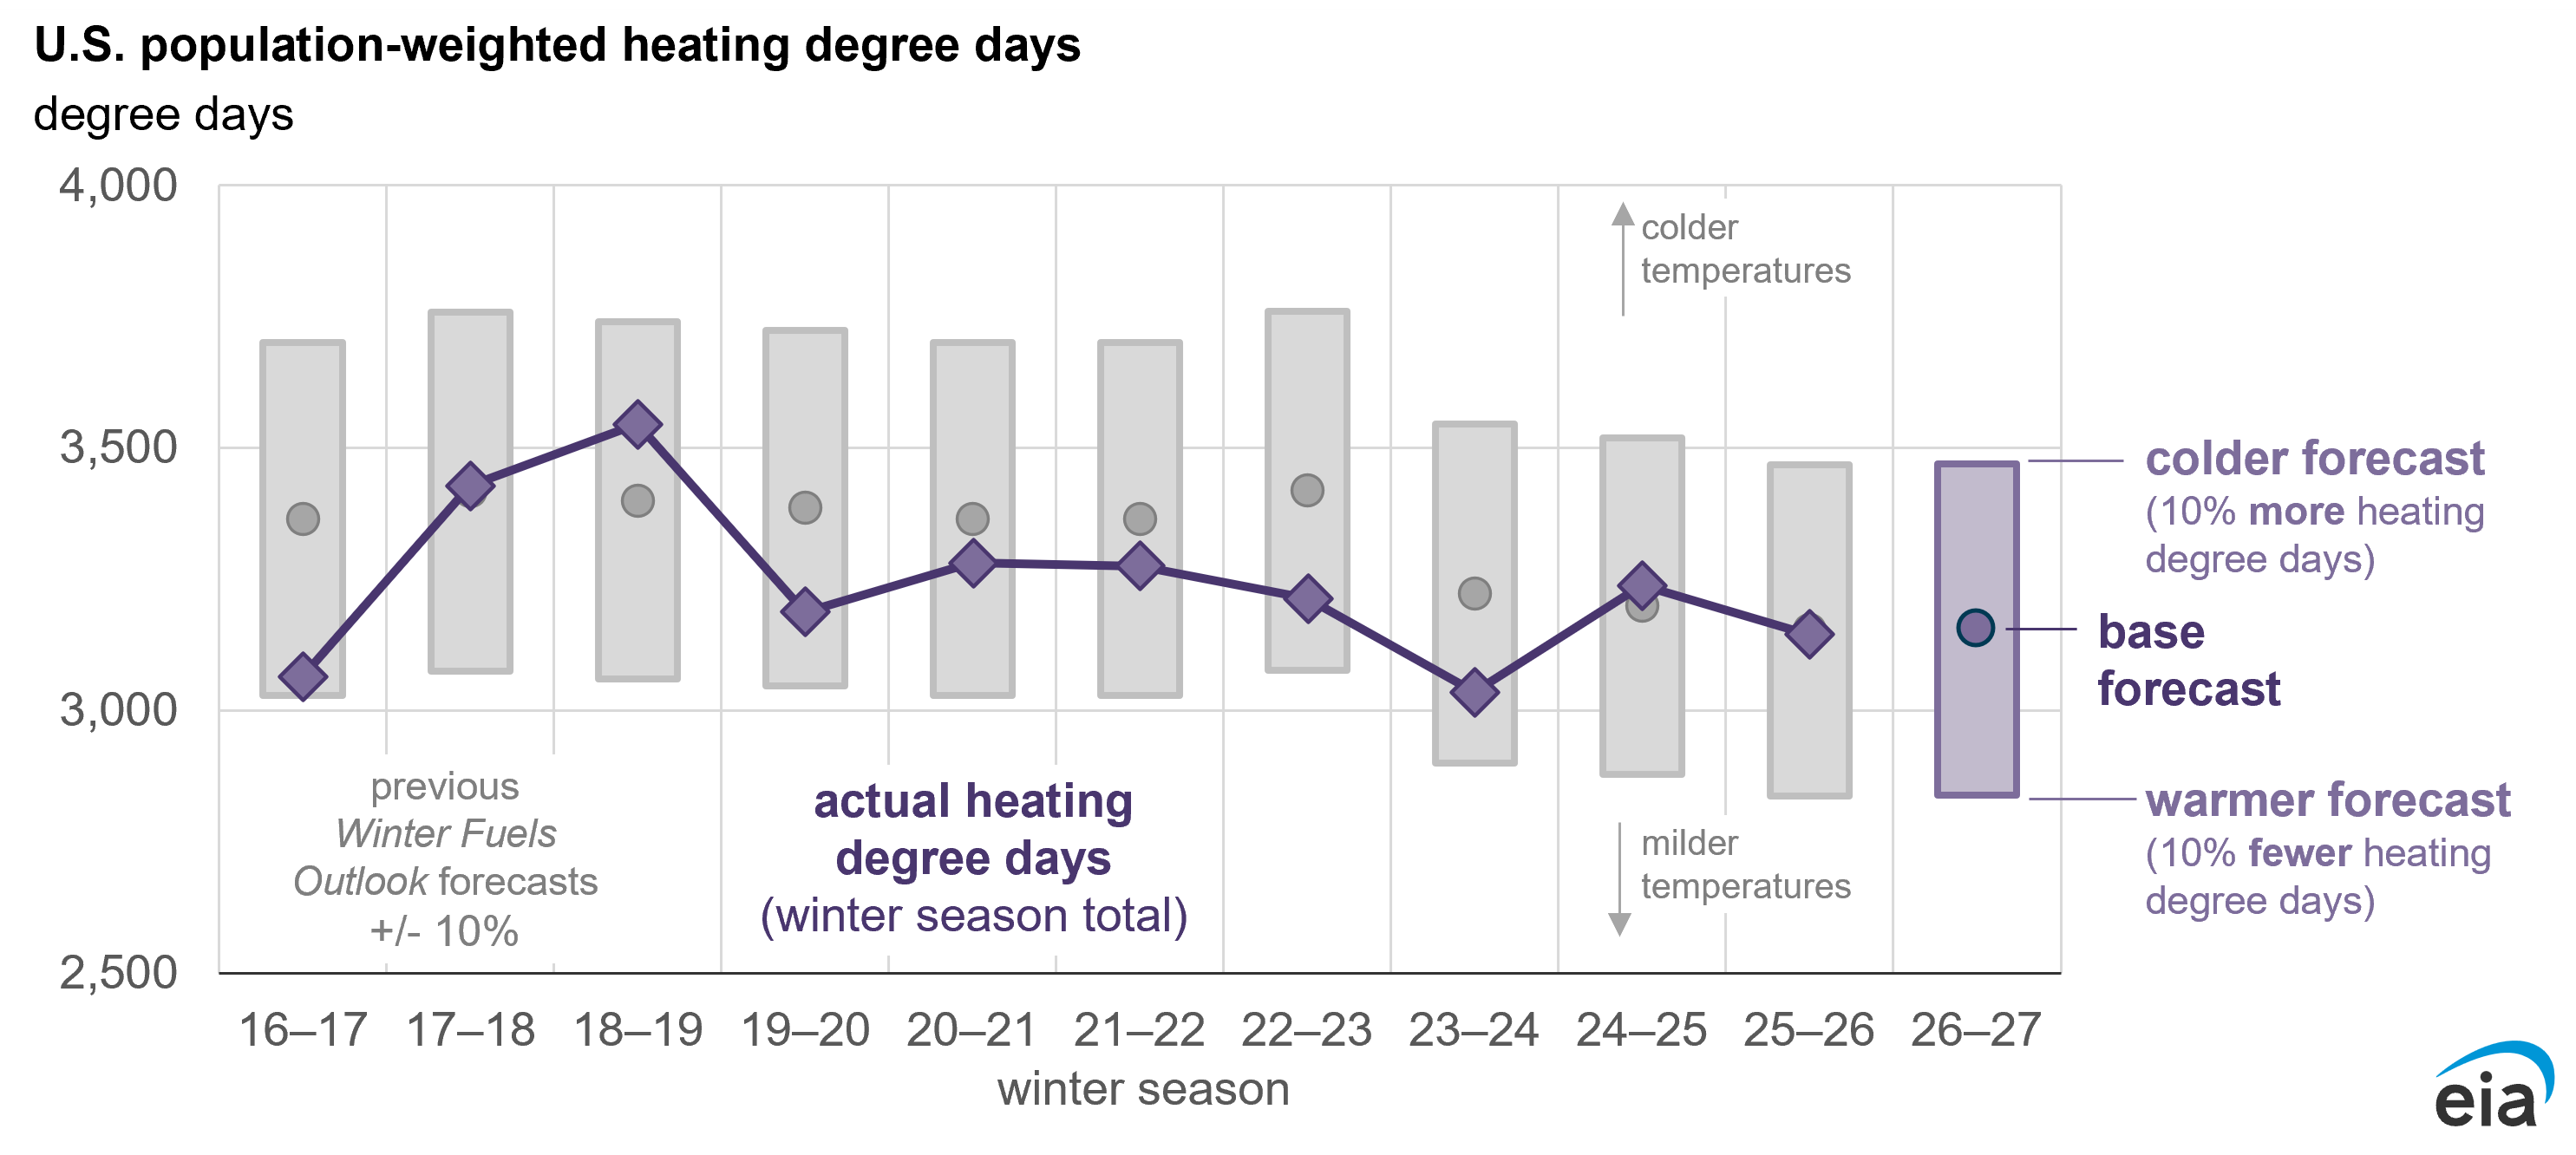
Although we expect national average temperatures to be similar to last winter, our forecast assumes warmer temperatures in the Northeast, following a relatively cold winter last year, and much colder temperatures in the West, following an unusually warm winter last year. We assume temperatures in the Midwest and South are similar to last year. The National Oceanic and Atmospheric Administration has identified a strong El Niño pattern this winter, which could lead to large temperature variations from our forecast.
Data values: U.S. Regional Weather Data
Natural gas is the most widely used space heating fuel in the United States. We expect lower natural gas prices and similar or warmer temperatures in the South, Midwest, and Northeast will push expenditures lower for homes that use natural gas as their main heating fuel in these regions. The exception is the West, where a colder winter than last year offsets the effect of lower prices and results in a slight increase in natural gas expenditures.
For the more than 40 of homes that heat mainly with electricity, we expect a 3% increase in residential electricity prices and slightly higher consumption will lead to a 4% increase in electricity bills. The largest forecast increase in electricity spending is in the West, where we expect a 9% increase in consumer outlays for electricity because of colder weather.
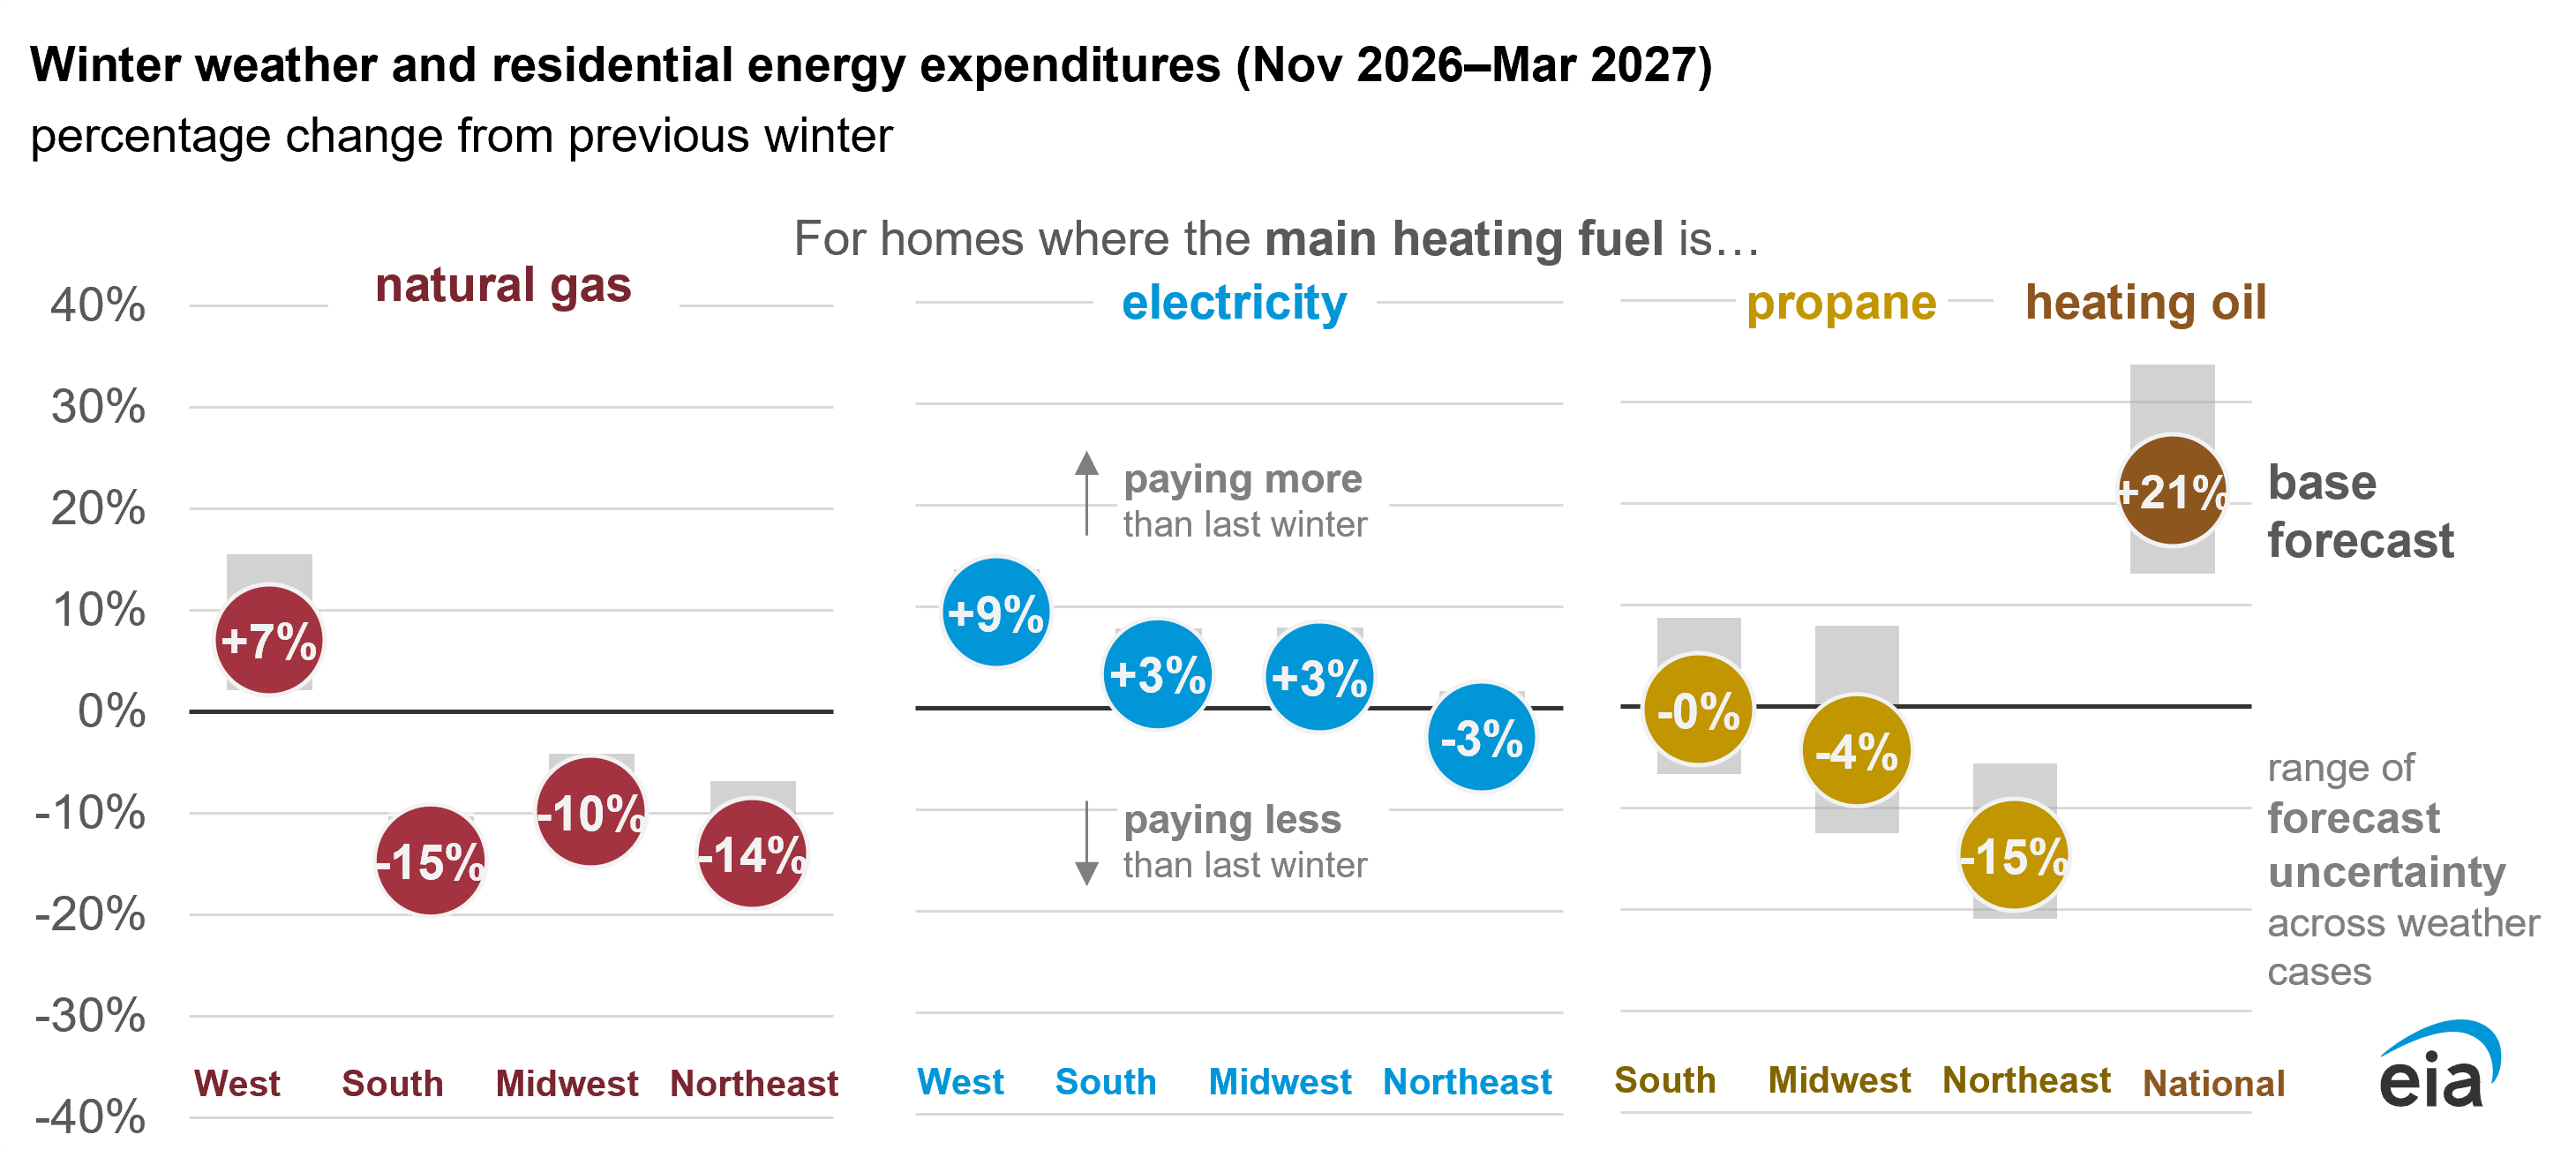
We expect propane prices will be lower this winter, leading to a 3% drop in expenditures for homes heating primarily with propane on average nationally. In the Northeast, we expect decreasing consumption and lower prices to drive expenditures down 15% this winter, compared with last winter.
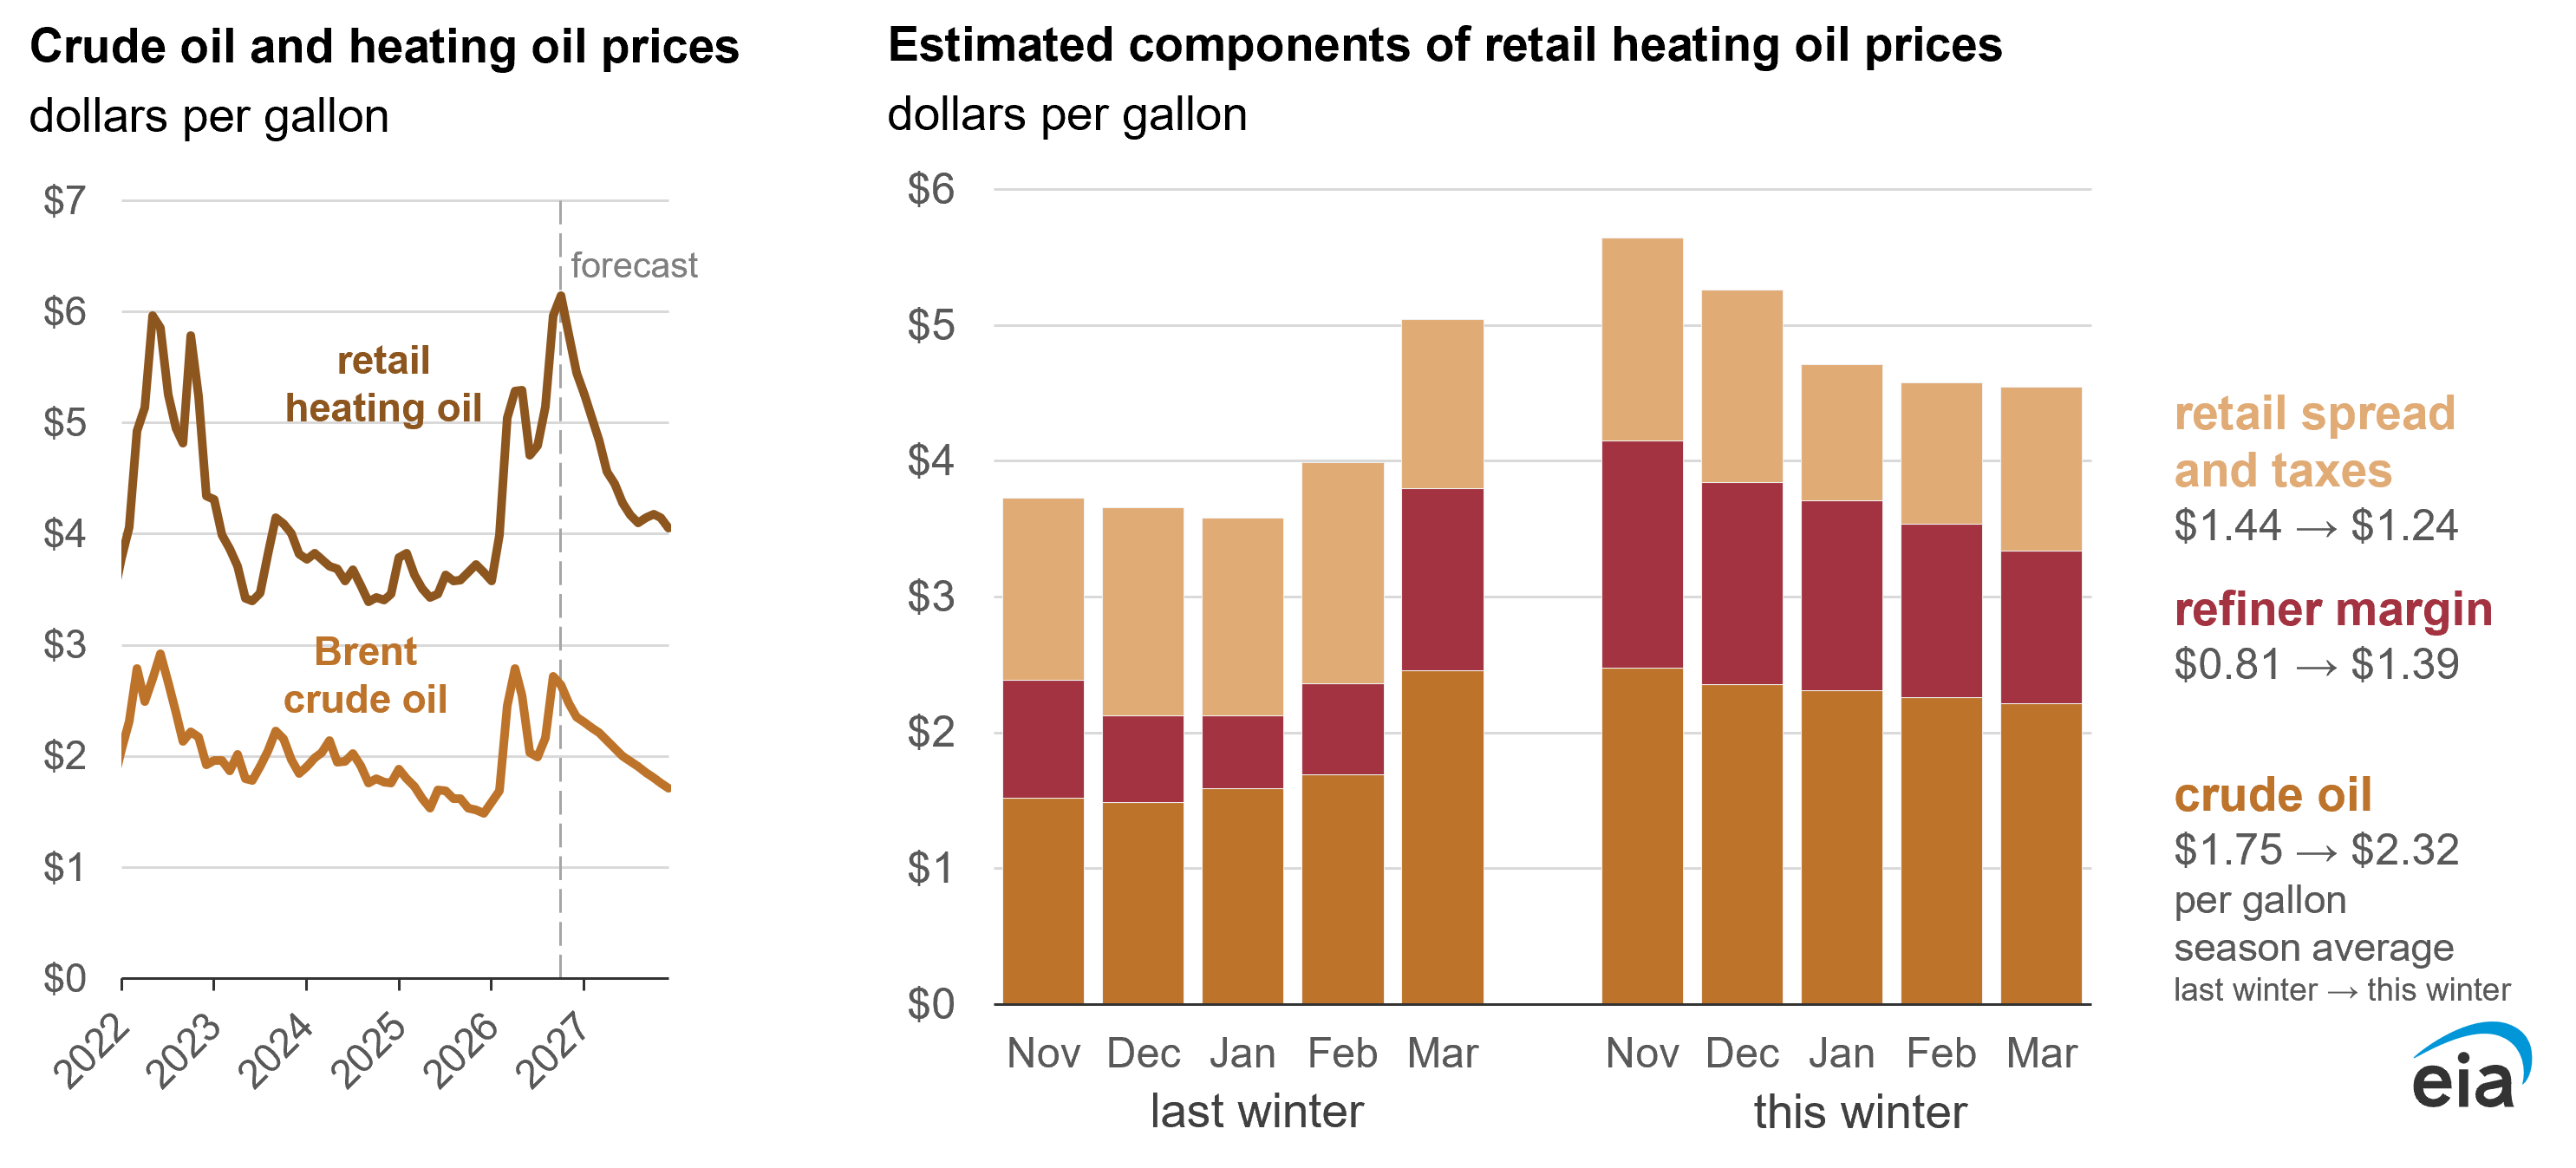
Homes that use heating oil as their main heating fuel—about 3% of households—could see the largest increase in spending this year. We expect a 21% increase in heating oil expenditures compared with last winter, driven by increasing global crude oil and distillate prices.
Data values: U.S. Petroleum and Other Liquids Supply, Consumption, and Inventories
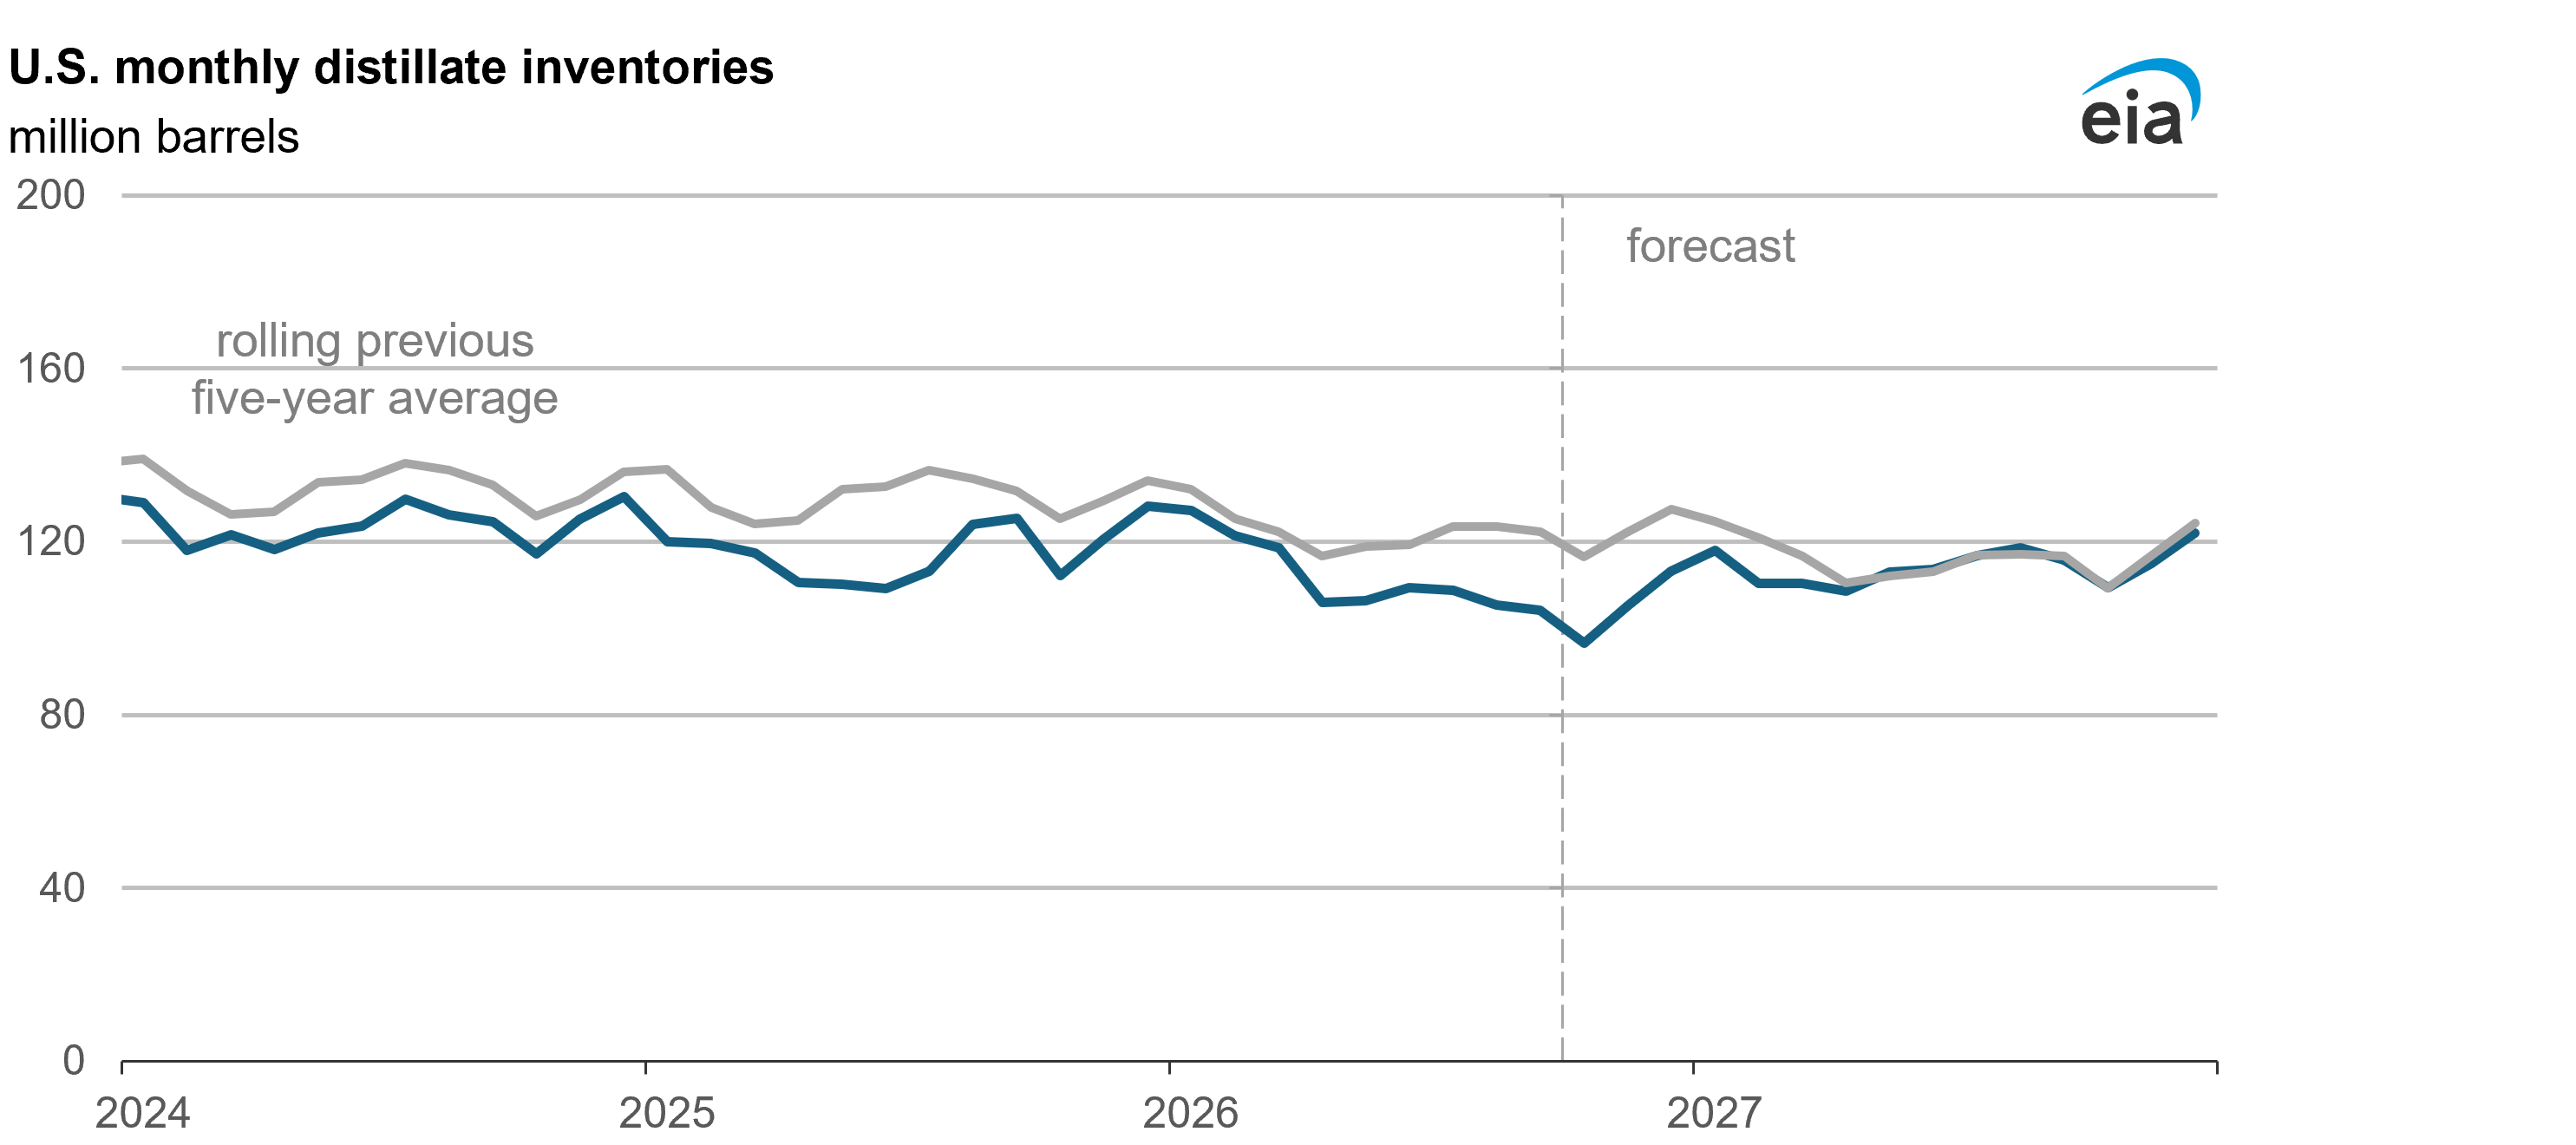
Global production of distillate fuel, which includes heating oil, has dropped because of reduced global refining activity. This has caused rising international prices, driving up both the cost to import distillate to the United States and increasing demand for distillate exports from the United States. With more costly imports and demand for exports, U.S. distillate fuel stocks are low heading into winter. Heating oil is most widely used in the Northeast, and warmer forecast temperatures than last year partly offset our forecast increase in prices.
Data values: U.S. Petroleum and Other Liquids Supply, Consumption, and Inventories
Weather assumptions
Weather can affect household heating expenses in two ways. First, cold weather raises the amount of energy required to keep a house at a specific temperature. Second, because cold weather raises aggregate demand and can disrupt supply, it can cause energy prices to rise. These price increases can be more severe if fuel inventories are relatively low. In the cases we consider, we adjust for both effects.
In the Winter Fuels Outlook, we use the previous 30-year trend to inform our expectations for weather. We measure winter weather effects using heating degree days (HDDs), which are an aggregate measure of how daily average temperatures deviate from a base temperature of 65°F.
For example, an average daily temperature of 50°F results in 15 HDDs (65 minus 50 equals 15). A 30-day month of those 50°F days would result in 450 HDDs for the month (15 times 30 equals 450). Heating degree days are population-weighted so that areas with larger populations are given more weight than less-populous areas when averaging within a geographic region.
Because weather is a significant source of uncertainty in these forecasts, the Winter Fuels Outlook includes two side cases where, measured in HDDs, all regions are either 10% colder or 10% warmer than the base forecast.
| Nov | Dec | Jan | Feb | Mar | Total | % change |
|
|---|---|---|---|---|---|---|---|
| Northeast | 633 | 917 | 1,071 | 914 | 795 | 4,331 | -12% |
| Midwest | 726 | 1,062 | 1,210 | 997 | 806 | 4,802 | -2% |
| South | 295 | 477 | 542 | 410 | 297 | 2,021 | +1% |
| West | 462 | 663 | 644 | 538 | 474 | 2,781 | +25% |
| United States | 479 | 714 | 791 | 644 | 526 | 3,155 | 0% |
Note: Percentage change value is relative to previous winter.
Household characteristics
The estimates discussed here are broad measures for comparing recent winters. Energy consumption and expenditures depend on the size and energy efficiency of individual homes, their heating equipment and operating conditions, and weather. A key determinant of expenditures is the primary heating fuel, each of which has a unique geographic distribution across the United States.

According to the U.S. Census Bureau's American Community Survey, natural gas was the main space heating fuel in 46% of U.S. homes in 2024. Electricity is also widely used for heating, especially in the South.
Propane and heating oil are the primary space heating fuels in a much smaller share of homes nationally but are used widely in regions that tend to have some of the coldest winters. Heating with propane is more common in the upper Midwest and Northeast. Heating oil is used for residential heating mostly in the Northeast.
| 2021 | 2022 | 2023 | 2024 | 2025 | 2026 | % change |
|
|---|---|---|---|---|---|---|---|
| Northeast | 11,875 | 11,849 | 12,072 | 12,297 | 12,365 | 12,393 | 0% |
| Midwest | 17,833 | 17,786 | 18,039 | 18,154 | 18,094 | 18,077 | 0% |
| South | 14,291 | 14,394 | 14,804 | 14,992 | 14,957 | 15,024 | 0% |
| West | 15,115 | 15,281 | 15,588 | 15,618 | 15,528 | 15,468 | 0% |
| United States | 59,114 | 59,310 | 60,503 | 61,060 | 60,944 | 60,962 | 0% |
| 2021 | 2022 | 2023 | 2024 | 2025 | 2026 | % change |
|
|---|---|---|---|---|---|---|---|
| Northeast | 3,914 | 4,108 | 4,270 | 4,313 | 4,412 | 4,538 | +3% |
| Midwest | 6,410 | 6,549 | 6,641 | 6,833 | 7,086 | 7,245 | +2% |
| South | 32,515 | 33,053 | 33,485 | 34,017 | 34,563 | 34,888 | +1% |
| West | 10,485 | 10,549 | 10,689 | 10,868 | 11,055 | 11,208 | +1% |
| United States | 53,325 | 54,258 | 55,085 | 56,031 | 57,116 | 57,880 | +1% |
| 2021 | 2022 | 2023 | 2024 | 2025 | 2026 | % change |
|
|---|---|---|---|---|---|---|---|
| Northeast | 1,217 | 1,250 | 1,214 | 1,209 | 1,262 | 1,295 | +3% |
| Midwest | 2,225 | 2,266 | 2,196 | 2,162 | 2,193 | 2,191 | 0% |
| South | 1,895 | 1,949 | 1,879 | 1,871 | 1,919 | 1,901 | -1% |
| West | 1,059 | 1,083 | 999 | 960 | 982 | 974 | -1% |
| United States | 6,397 | 6,548 | 6,288 | 6,203 | 6,356 | 6,361 | 0% |
| 2021 | 2022 | 2023 | 2024 | 2025 | 2026 | % change |
|
|---|---|---|---|---|---|---|---|
| Northeast | 4,136 | 4,009 | 3,842 | 3,689 | 3,551 | 3,388 | -5% |
| Midwest | 229 | 216 | 205 | 195 | 185 | 174 | -6% |
| South | 491 | 462 | 436 | 438 | 434 | 411 | -5% |
| West | 193 | 191 | 185 | 175 | 167 | 161 | -4% |
| United States | 5,049 | 4,878 | 4,669 | 4,496 | 4,337 | 4,134 | -5% |
| 2021 | 2022 | 2023 | 2024 | 2025 | 2026 | % change |
|
|---|---|---|---|---|---|---|---|
| Northeast | 378 | 391 | 393 | 378 | 364 | 345 | -5% |
| Midwest | 414 | 418 | 404 | 400 | 402 | 387 | -4% |
| South | 377 | 375 | 365 | 362 | 356 | 341 | -4% |
| West | 576 | 568 | 555 | 564 | 563 | 549 | -3% |
| United States | 1,745 | 1,752 | 1,716 | 1,703 | 1,685 | 1,622 | -4% |
| 2021 | 2022 | 2023 | 2024 | 2025 | 2026 | % change |
|
|---|---|---|---|---|---|---|---|
| Northeast | 553 | 551 | 518 | 552 | 613 | 639 | +4% |
| Midwest | 382 | 382 | 351 | 371 | 406 | 415 | +2% |
| South | 697 | 766 | 771 | 768 | 826 | 901 | +9% |
| West | 1,125 | 1,139 | 1,148 | 1,254 | 1,364 | 1,438 | +5% |
| United States | 2,758 | 2,838 | 2,788 | 2,945 | 3,209 | 3,392 | +6% |
Note: Percentage change value is relative to previous winter.
Energy expenditures
The consumption and expenditure forecasts in the Winter Fuels Outlook apply to a home's main space heating fuel. For most households, the main space heating fuel is also used for other purposes. Households primarily heating with natural gas equipment, for example, may also use natural gas for water heating, cooking, or clothes drying.
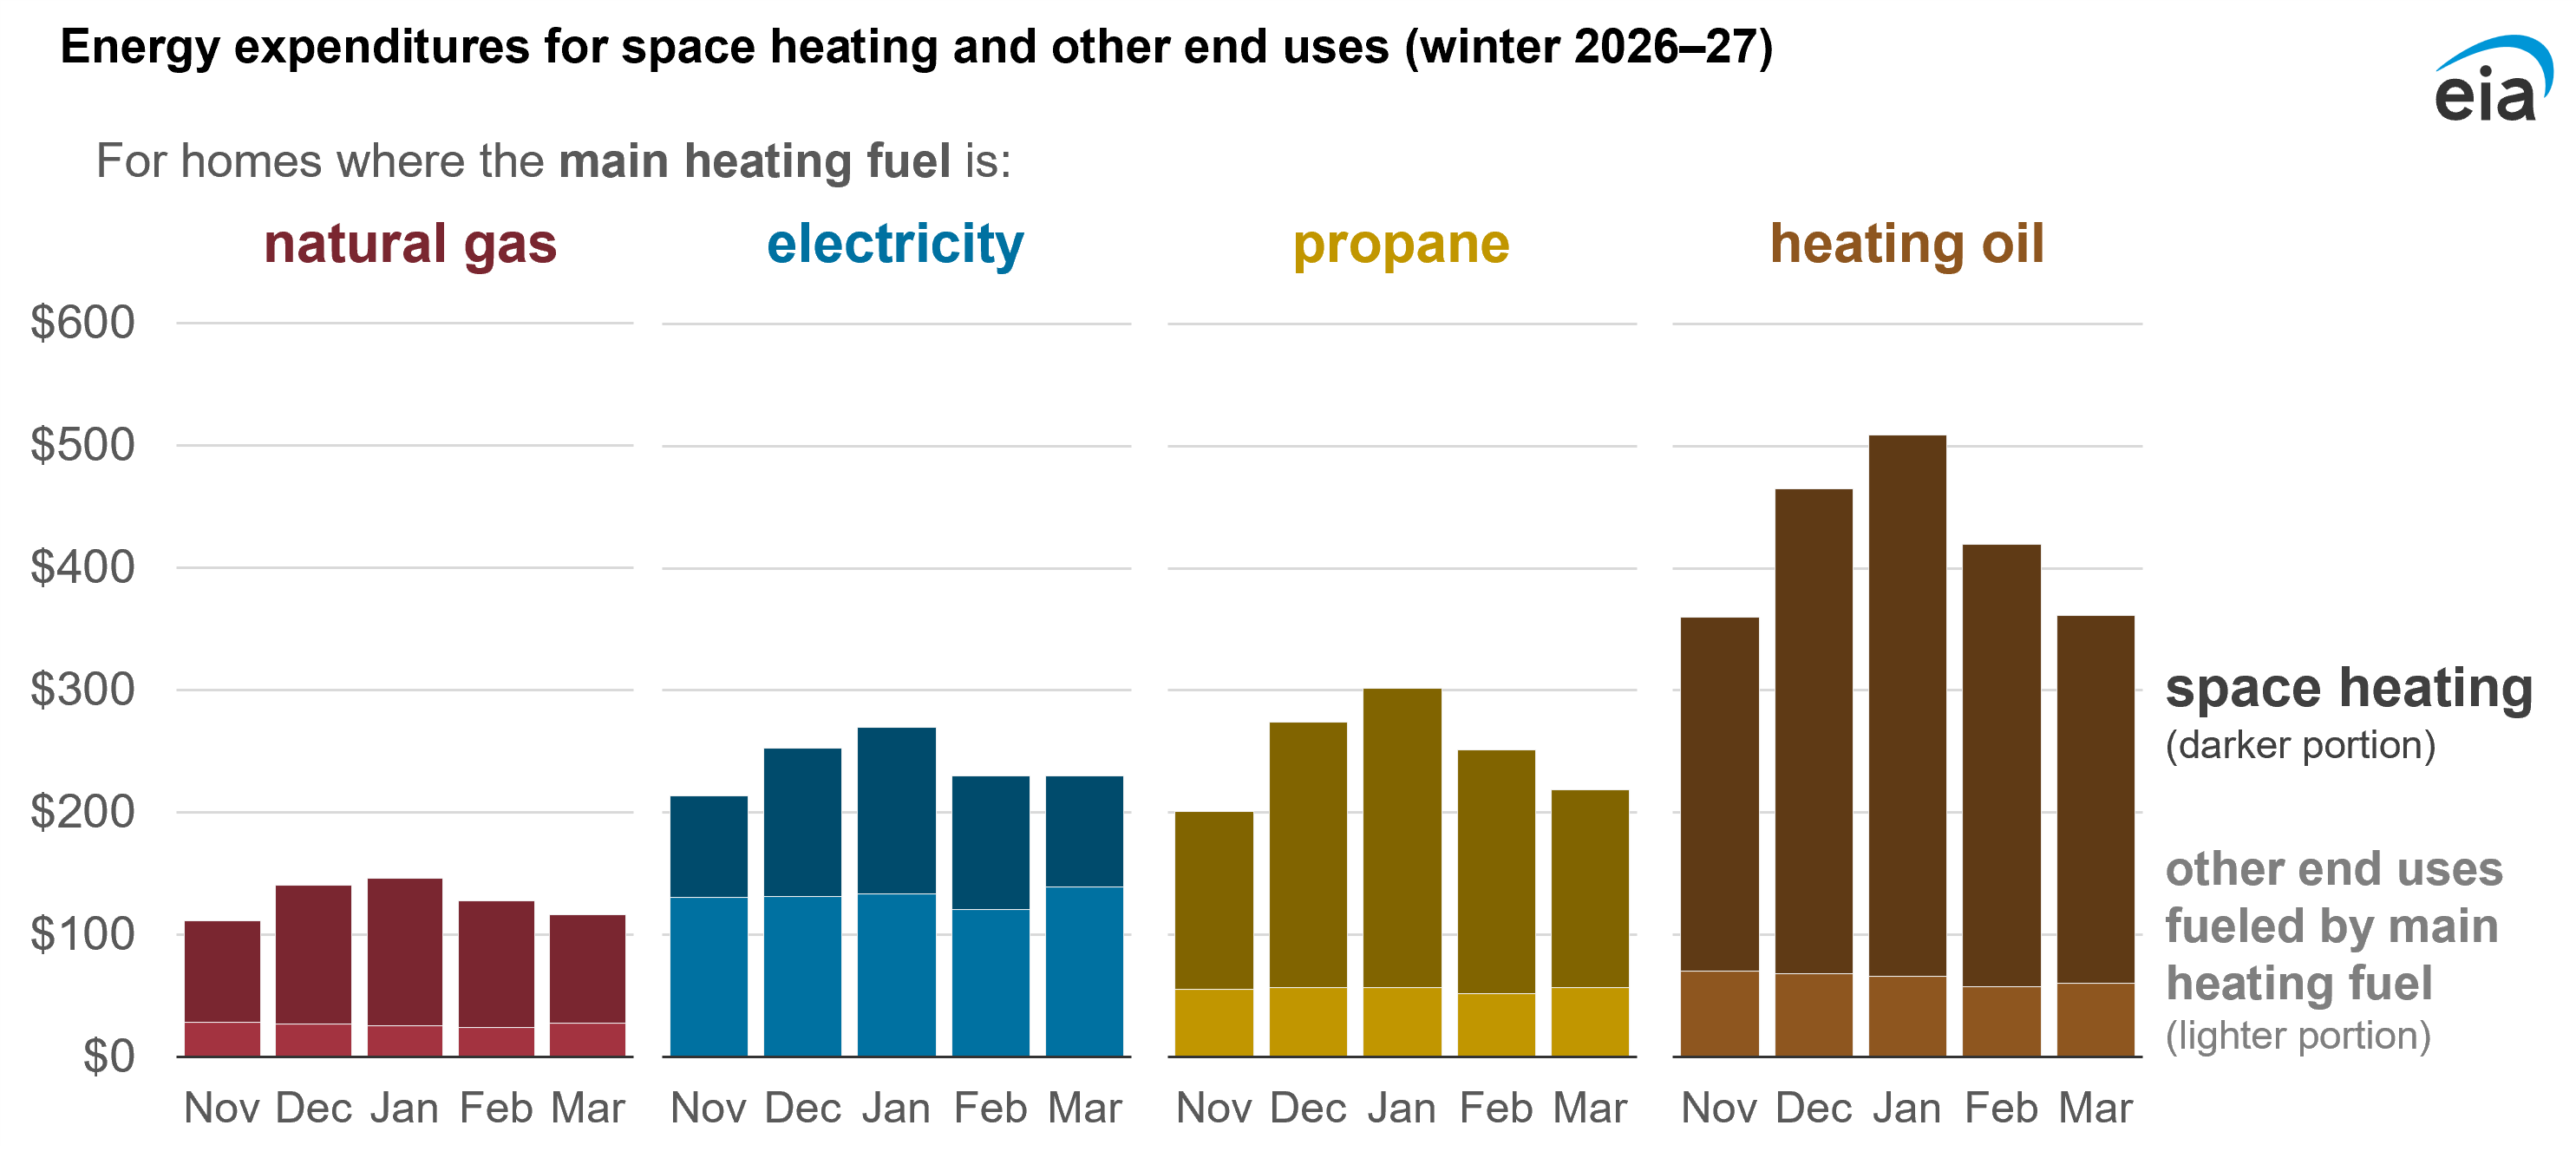
The consumption and expenditure forecasts in this report are further categorized into space heating and other purposes. In households heating with natural gas, propane, and heating oil, space heating accounts for most of the winter-season energy consumption and expenditures across the country. In homes heating with electricity, however, space heating represents a smaller portion of total consumption, especially in regions with relatively mild winters such as the South.
| Expenditures (dollars) | % change | ||||||
|---|---|---|---|---|---|---|---|
| Nov | Dec | Jan | Feb | Mar | Total | ||
| Northeast | 148 | 185 | 206 | 176 | 165 | 879 | -14% |
| Midwest | 104 | 130 | 141 | 128 | 110 | 613 | -10% |
| South | 95 | 116 | 117 | 96 | 88 | 511 | -15% |
| West | 103 | 137 | 131 | 113 | 105 | 590 | +7% |
| U.S. average | 111 | 140 | 146 | 128 | 116 | 640 | -9% |
| Price (dollars per thousand cubic feet) | % change | ||||||
| Nov | Dec | Jan | Feb | Mar | Total | ||
| Northeast | 17.35 | 16.10 | 15.74 | 15.61 | 16.16 | 16.12 | -5% |
| Midwest | 11.18 | 10.05 | 9.74 | 10.59 | 10.71 | 10.38 | -8% |
| South | 16.43 | 13.94 | 12.74 | 13.42 | 15.18 | 14.13 | -16% |
| West | 15.04 | 15.26 | 14.97 | 15.16 | 15.04 | 15.10 | -8% |
| U.S. average | 14.44 | 13.32 | 12.71 | 13.33 | 13.81 | 13.44 | -9% |
| Consumption (million cubic feet) | % change | ||||||
| Nov | Dec | Jan | Feb | Mar | Total | ||
| Northeast | 9 | 11 | 13 | 11 | 10 | 55 | -10% |
| Midwest | 9 | 13 | 14 | 12 | 10 | 59 | -2% |
| South | 6 | 8 | 9 | 7 | 6 | 36 | +2% |
| West | 7 | 9 | 9 | 7 | 7 | 39 | +17% |
| U.S. average | 8 | 11 | 11 | 10 | 8 | 48 | 0% |
| Expenditures (dollars) | % change | ||||||
|---|---|---|---|---|---|---|---|
| Nov | Dec | Jan | Feb | Mar | Total | ||
| Northeast | 277 | 336 | 371 | 332 | 322 | 1,637 | -3% |
| Midwest | 246 | 289 | 311 | 269 | 265 | 1,380 | +3% |
| South | 192 | 229 | 250 | 206 | 202 | 1,079 | +3% |
| West | 212 | 248 | 245 | 218 | 228 | 1,151 | +9% |
| U.S. average | 213 | 253 | 270 | 230 | 230 | 1,196 | +4% |
| Price (cents per kilowatthour) | % change | ||||||
| Nov | Dec | Jan | Feb | Mar | Total | ||
| Northeast | 25.72 | 25.74 | 26.18 | 26.78 | 26.49 | 26.19 | +4% |
| Midwest | 17.44 | 16.48 | 16.43 | 16.64 | 17.59 | 16.87 | +4% |
| South | 15.95 | 15.30 | 15.74 | 15.57 | 16.32 | 15.75 | +4% |
| West | 20.34 | 20.12 | 20.13 | 20.56 | 21.29 | 20.47 | +1% |
| U.S. average | 18.34 | 17.79 | 18.08 | 18.11 | 18.92 | 18.23 | +3% |
| Consumption (kilowatthours) | % change | ||||||
| Nov | Dec | Jan | Feb | Mar | Total | ||
| Northeast | 1,077 | 1,304 | 1,416 | 1,240 | 1,215 | 6,252 | -6% |
| Midwest | 1,410 | 1,754 | 1,893 | 1,616 | 1,505 | 8,178 | -1% |
| South | 1,207 | 1,494 | 1,589 | 1,322 | 1,238 | 6,849 | 0% |
| West | 1,042 | 1,231 | 1,216 | 1,061 | 1,073 | 5,624 | +9% |
| U.S. average | 1,163 | 1,420 | 1,494 | 1,270 | 1,216 | 6,562 | +1% |
| Expenditures (dollars) | % change | ||||||
|---|---|---|---|---|---|---|---|
| Nov | Dec | Jan | Feb | Mar | Total | ||
| Northeast | 263 | 353 | 401 | 349 | 322 | 1,687 | -15% |
| Midwest | 209 | 286 | 319 | 266 | 225 | 1,305 | -4% |
| South | 189 | 265 | 291 | 230 | 190 | 1,164 | 0% |
| U.S. average | 201 | 274 | 302 | 251 | 218 | 1,246 | -3% |
| Price (dollars per gallon) | % change | ||||||
| Nov | Dec | Jan | Feb | Mar | Total | ||
| Northeast | 3.23 | 3.26 | 3.28 | 3.30 | 3.31 | 3.28 | -6% |
| Midwest | 2.04 | 2.04 | 2.04 | 2.04 | 2.02 | 2.04 | -3% |
| South | 3.20 | 3.19 | 3.19 | 3.18 | 3.17 | 3.19 | -1% |
| U.S. average | 2.51 | 2.52 | 2.52 | 2.53 | 2.52 | 2.52 | -2% |
| Consumption (gallons) | % change | ||||||
| Nov | Dec | Jan | Feb | Mar | Total | ||
| Northeast | 81 | 108 | 122 | 106 | 97 | 515 | -10% |
| Midwest | 102 | 140 | 156 | 130 | 111 | 641 | -1% |
| South | 59 | 83 | 91 | 72 | 60 | 365 | 0% |
| U.S. average | 80 | 109 | 119 | 99 | 87 | 494 | -1% |
| Expenditures (dollars) | % change | ||||||
|---|---|---|---|---|---|---|---|
| Nov | Dec | Jan | Feb | Mar | Total | ||
| U.S. average | 360 | 465 | 509 | 420 | 361 | 2,115 | +21% |
| Price (dollars per gallon) | % change | ||||||
| Nov | Dec | Jan | Feb | Mar | Total | ||
| U.S. average | 5.79 | 5.46 | 5.26 | 5.06 | 4.84 | 5.26 | +34% |
| Consumption (gallons) | % change | ||||||
| Nov | Dec | Jan | Feb | Mar | Total | ||
| U.S. average | 62 | 85 | 97 | 83 | 75 | 402 | -9% |
Note: Percentage change value is relative to previous winter. Propane expenditures are a household-weighted average of the Northeast, Midwest, and South regions.
Effects of wholesale prices on retail prices
Wholesale market conditions affect fuels differently. For natural gas, changes in retail prices lag changes in wholesale prices largely due to the nature of utility regulation. Over longer periods, changes in natural gas wholesale and retail prices are closely correlated. Some state utility commissions set the rates utilities can charge for natural gas deliveries a year or more in advance of billing to reflect the cost of wholesale natural gas that utilities purchased over many months.
The timing and frequency of rate changes can vary by utility. In times of high price volatility, some utilities may adjust retail rates several times in a year. In addition, residential natural gas prices include charges to cover utility operating costs and the cost to transport and distribute natural gas, which are not directly linked to wholesale commodity natural gas prices.
The prices residential consumers pay for electricity lag changes in wholesale spot prices in a way that is similar to natural gas. Electricity prices charged to ultimate customers reflect the costs of supplying the electricity and delivering it to households. Increases in costs may pass through to customers more quickly in areas of the country with markets where consumers have a choice of electricity providers.
Wholesale price changes for heating oil and propane are passed to consumers quickly because rates in those markets are not regulated as they are for natural gas and electricity. We generally estimate that changes in wholesale fuel prices become fully reflected in retail prices over a period of four to six weeks.
Many heating oil and propane users buy supplies ahead of the winter and refill as needed. When forecasting expenditures, our calculations do not account for fuel that consumers purchase ahead of its use or fuel that was contracted at prices set before the start of the winter. We assume households pay the prevailing retail price for heating oil and propane at the time they use it.
Energy consumption methodology
The consumption values presented in this report are for all end uses associated with a home's main heating fuel. These consumption values are generally a subset of a household's total energy consumption except in homes that are all-electric homes.
We estimate household consumption and expenditures for space heating and other end uses based on information from our Residential Energy Consumption Survey (RECS). To develop our forecasts, we make several assumptions to convert annual RECS consumption data to monthly values, and we use monthly retail price forecasts available in our Short-Term Energy Outlook (STEO).

Data values: Table CE4.16: Annual household end-use expenditures by fuel in the U.S.—averages
Space heating: We used historical RECS information about the space heating consumption and weather for each fuel-region combination to estimate space heating consumption based on temperature. We assume heating consumption varies in proportion to heating degree days, so these consumption-per-degree-day values are allocated to the upcoming winter according to the number of forecasted heating degree days in each month.
Secondary heating: Although this report focuses on a home's main heating fuel, households may use multiple forms of heating equipment and even multiple heating fuels within a home. Many households use secondary equipment such as fireplaces and portable heaters. In situations where the fuel for secondary heating equipment is the same fuel used for main space heating, our estimates include both main and secondary heating. When the secondary fuel is different from the main fuel, our estimates only include consumption and expenditures for the main heating fuel.
Non-heating portion: The remaining portion of consumption—the part not associated with space heating—reflects all other consumption associated with a household's main space heating fuel in the winter months. For example, a household using natural gas as its main space heating fuel may also use natural gas for water heating, cooking, and clothes drying. For all fuels except electricity, these estimates are based on annual values converted to per-day rates and allocated to the winter heating season according to the number of days in each month.
For electricity, we subtracted air conditioning from the annual total—essentially assuming that all air conditioning occurs in April through October—and allocated the remaining consumption using the same approach described for non-electric fuels.
Effects of inflation
The prices and expenditures presented in this report are in nominal (not inflation-adjusted) terms. We assume inflation will average about 2% this winter based on forecasts for the Consumer Price Index from the S&P Global macroeconomic model we use in STEO. Given that rate of inflation, increases in prices and expenditures would need to be about 2% higher than the values reported to indicate increases beyond general inflation.
Comparisons across fuels
Readers should not assume that switching to another fuel with lower energy expenditures—as presented in this report—would necessarily result in lower expenditures for their household. Many factors complicate direct comparisons of the housing populations and their energy consumption and expenditures as presented in this report.
Even within the geographic regions presented in this report, the various heating fuels have different geographic distributions and therefore different exposure to weather conditions. For example, in the South, households heating with electricity experience milder winter weather on average than those heating with natural gas.
Energy consumption and expenditures also depend on household characteristics and energy efficiency—the insulation and air tightness of the home as well as the type of heating equipment and its operating efficiency. For example, an electric resistance heater used in a small, well-insulated home could consume less energy than an air source heat pump in a larger, drafty home.
Links to EIA's winter-related resources
EIA maintains several data series and products that can inform energy markets throughout winter.
For natural gas, we publish daily spot and futures prices and monthly residential natural gas prices by state. Our Weekly Natural Gas Storage Report captures changes in natural gas inventories.
For propane and heating oil, our Heating Oil and Propane Update page provides wholesale and retail prices for several states. These prices are published weekly from October through March. Our Weekly Petroleum Status Report provides weekly inventory, production, and demand data series that are visualized on the Heating Oil and Propane Update page.
Specifically for propane, we provide a monthly briefing on propane inventory levels that offers more granular detail than the information in our Weekly Petroleum Status Report. This information will be updated monthly starting in November.
For electricity, our Hourly Electric Grid Monitor provides hourly information on electric demand and net electricity demand by source throughout the Lower 48 states. Our Electric Power Monthly compiles information on state-level retail electricity prices and demand.
We also publish a daily New England Dashboard that displays electricity, natural gas, and petroleum market metrics for the New England region.
Questions about the Winter Fuels Outlook can be sent to winterfuels@eia.gov.