Release Date: September 12, 2023
STEO Between the Lines: Small-scale solar accounts for about one-third of U.S. solar power capacity
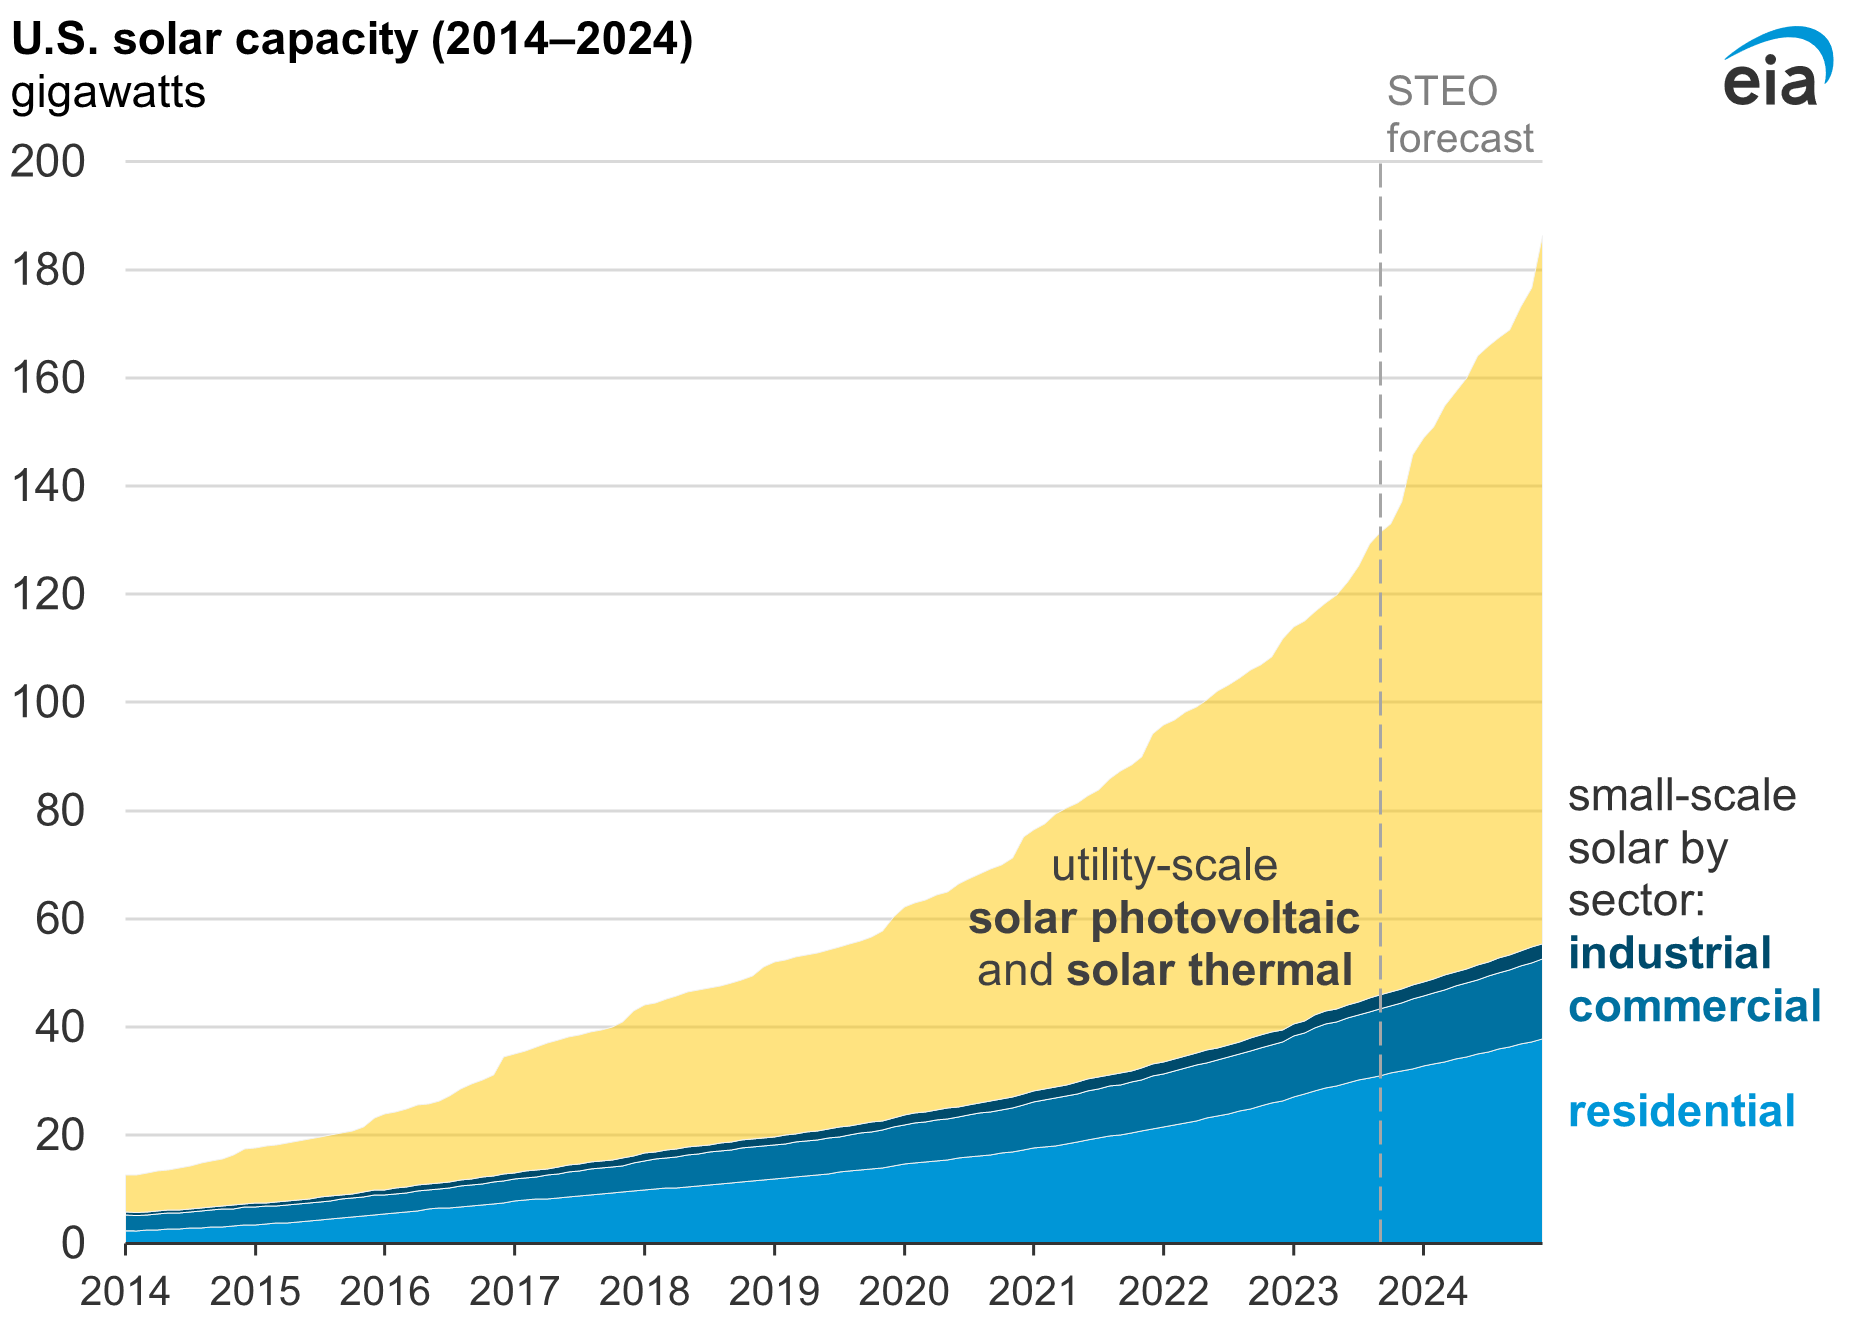
More than one-third of U.S. solar power capacity is small-scale solar—a share that has been declining in recent years because utility-scale solar has been growing faster. We expect both small-scale and utility-scale solar to continue growing through 2024. In some states, small-scale solar capacity is growing faster than the U.S. average in response to local incentives for rooftop solar installations.
Data values: U.S. regional electricity generating capacity, small-scale solar
We define small-scale solar systems as those with generating capacity of less than one megawatt (MW). Residential small-scale solar systems are typically installed on rooftops; commercial and industrial systems may be installed on rooftops or on the ground.
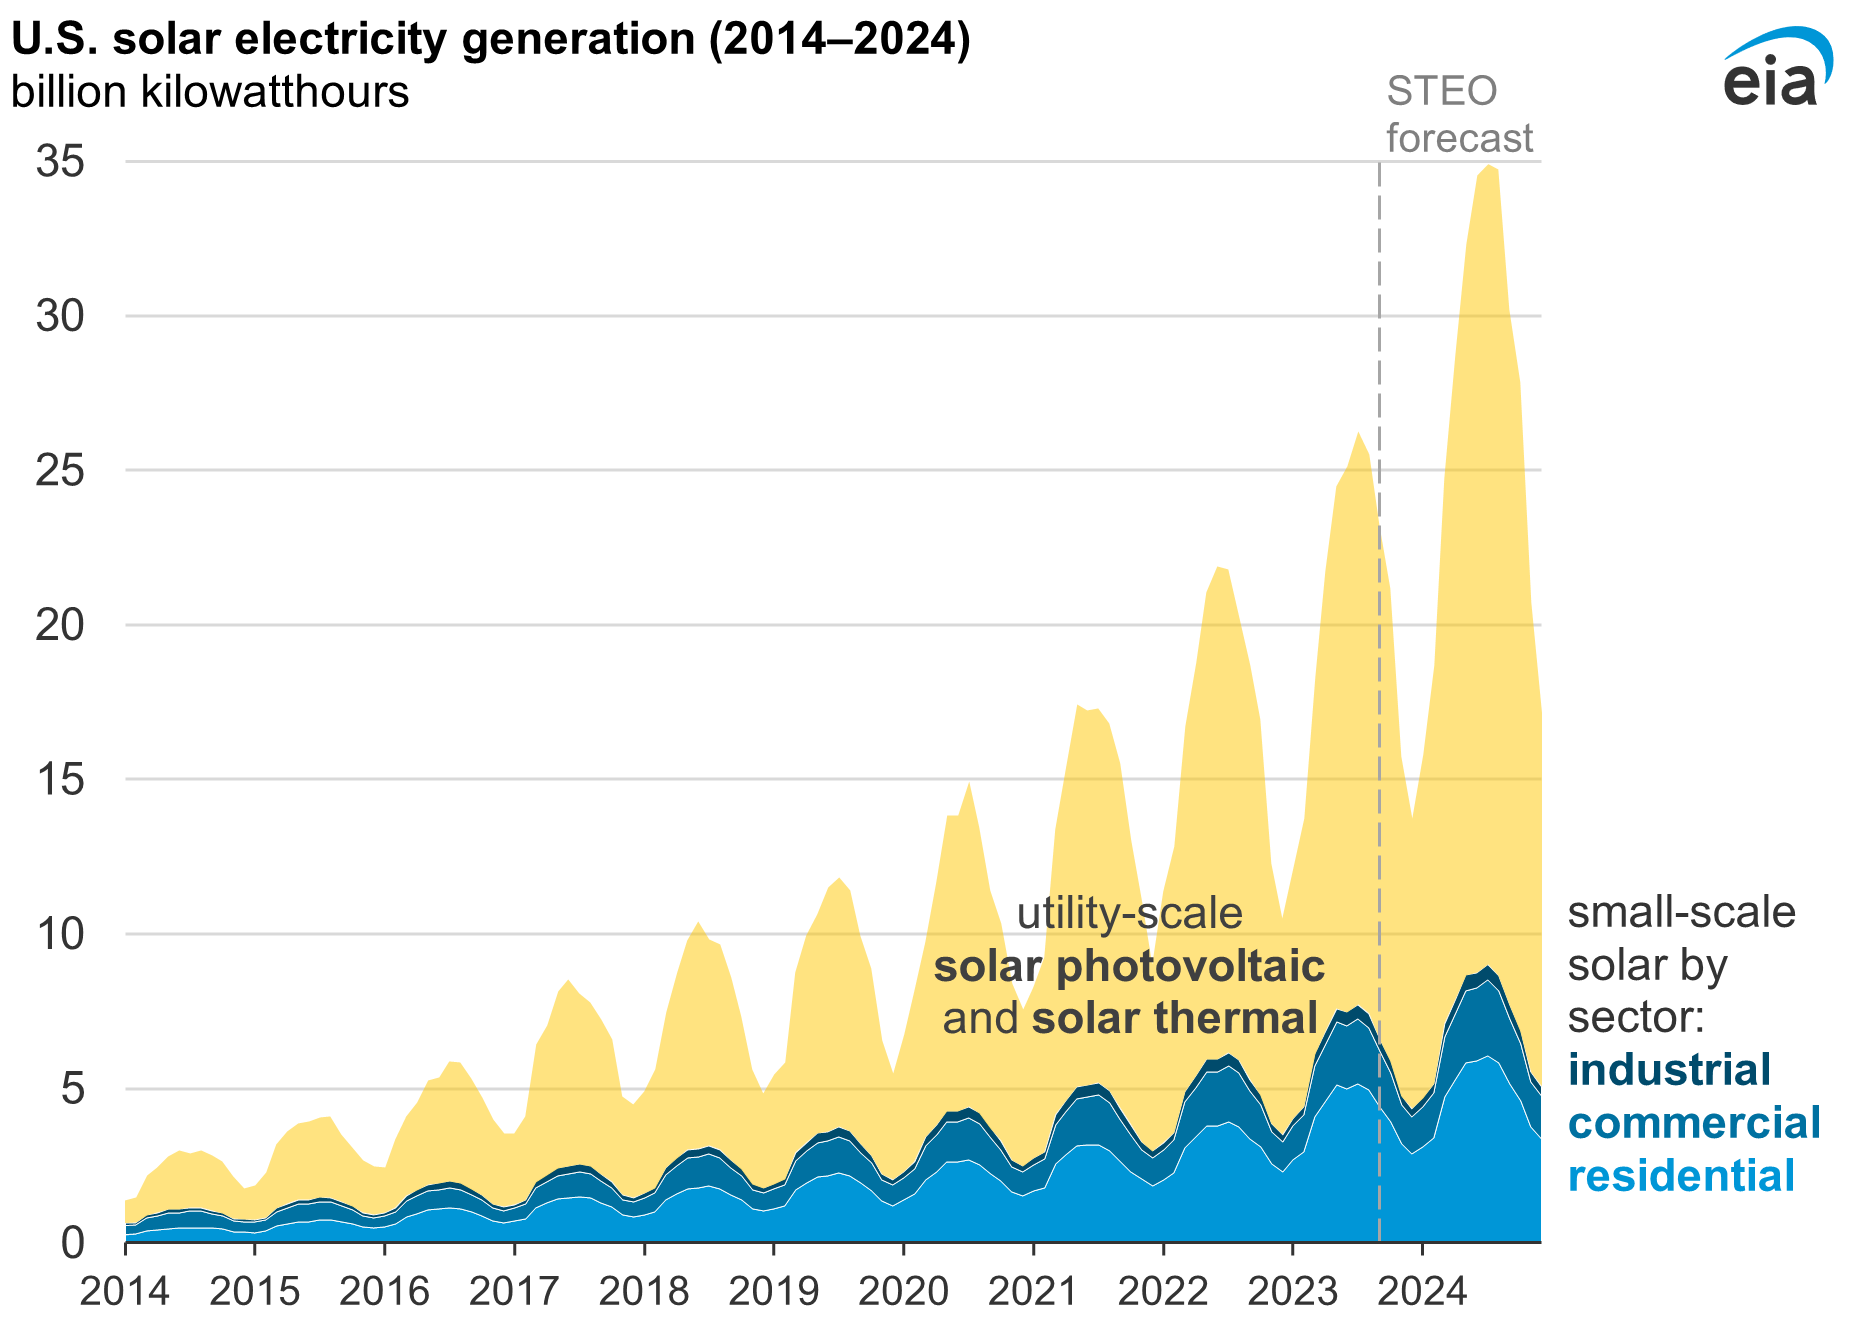
The residential sector currently accounts for 67% of small-scale solar capacity among end-use sectors, followed by the commercial sector at 27% and the industrial sector at 6%. We expect small-scale solar capacity across all three sectors will grow from 44 gigawatts (GW) in June 2023 to 55 GW by the end of 2024. We expect small-scale solar systems to generate 83 billion kilowatthours of electricity in 2024.
By comparison, we expect utility-scale solar capacity to grow from 78 GW in June 2023 to 131 GW by the end of 2024. When it comes to power capacity additions, those from small-scale solar are only surpassed by those from utility-scale solar and battery storage.
Data values: U.S. electricity generation, small-scale solar
Our revised forecasting method considers differences in several states
We recently revised our method for short-term forecasts for small-scale solar capacity to account for different growth rates and policies in key states. Several states and utilities offer incentives or other programs to encourage end users to adopt small-scale solar.
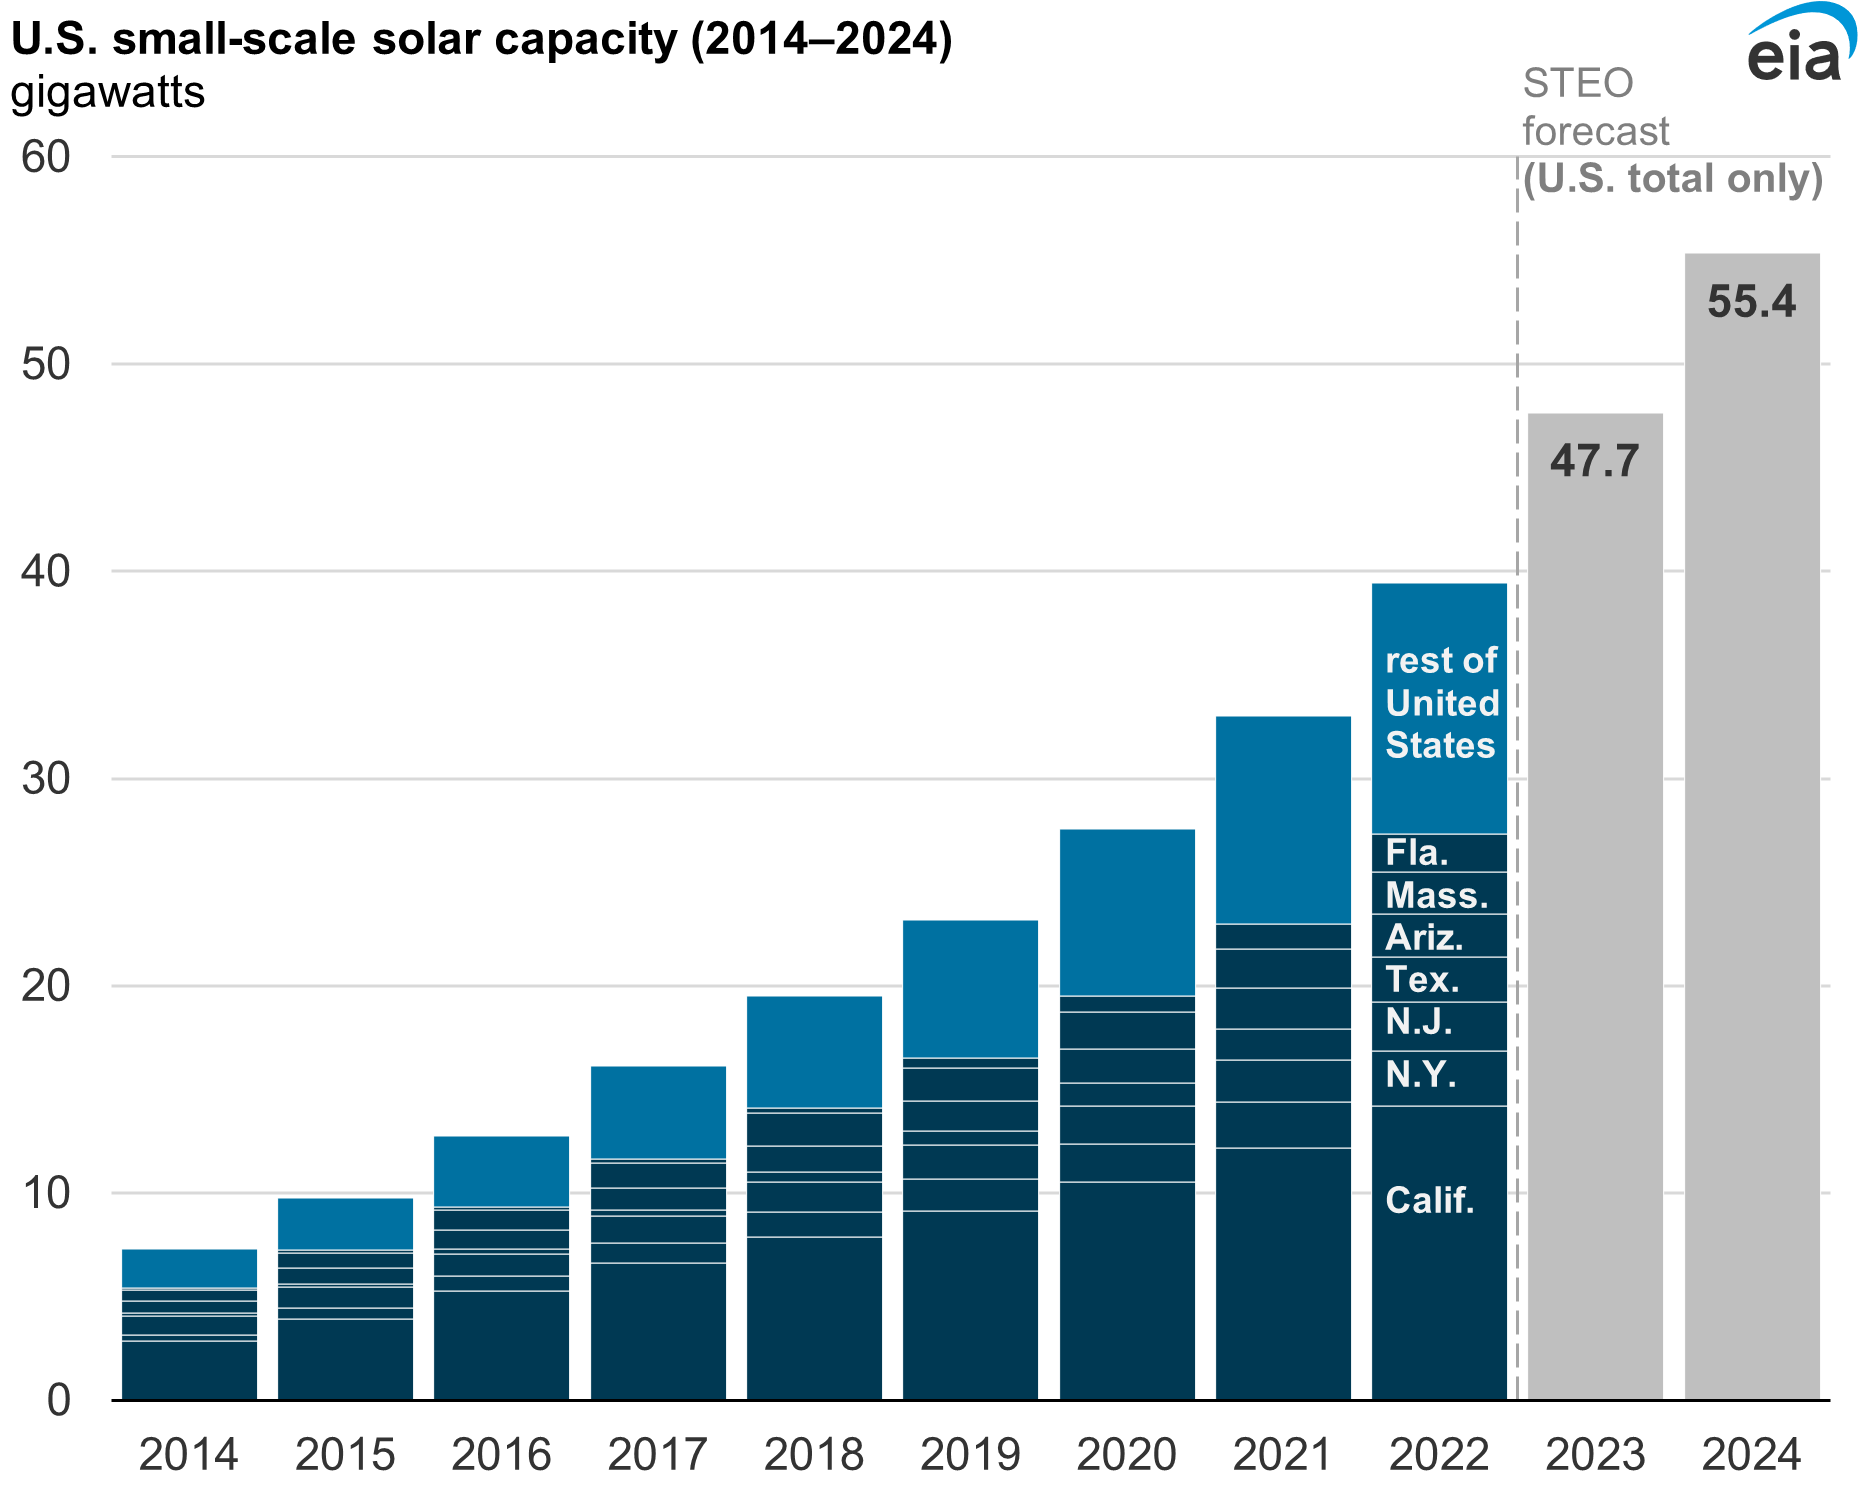
More than one-third of current U.S. small-scale solar capacity is installed in California. Although the state canceled the California Solar Incentive program in 2016, which ended the capital investments subsidies for installing solar panels, customers are still eligible to receive an investment tax credit (ITC) and to participate in the Net Energy Metering Program. The state net-metering program allows residential solar owners to interconnect with the electric grid and be compensated if they produce surplus electricity for the grid.
Other states with the most small-scale solar photovoltaic (PV) capacity are New York, New Jersey, Texas, Arizona, Massachusetts, and Florida. Each of these states had at least 2 GW of small-scale solar capacity at the end of 2022.
During 2022, Florida added 670 MW of small-scale solar and Texas added 634 MW, the largest annual additions after California’s 2,041 MW. In California, net-metering policies, and state incentives such as clean energy standards drive the increases. In Florida and Texas, abundant solar resources drive the residential installations. Rebates from electric utilities or from state governments to install residential solar panels, among other local financial or tax incentives, also encourage solar adoption in various states.
Data values: U.S. regional electricity generating capacity, small scale solar
The percentage tax credit for the ITC recently increased , and its timeline was extended to 2034 for solar panels installations. Solar PV systems installed in 2020 and 2021 are eligible to receive a 26% tax credit, but systems installed in 2022 through 2032 are eligible for a 30% ITC. This percentage will decline again for systems installed in 2033 and 2034.
We forecast small-scale solar PV capacity using historical monthly data of small-scale capacity reported in our Monthly Electric Power Industry Report. To account for some of the exogenous factors that affect the dynamics of solar panels installations, our residential small-scale solar forecast incorporates the monthly forecast household counts and household income in certain states. Our commercial and industrial forecasts use the forecast state population.
Currently, we only forecast aggregate U.S. small-scale solar electric capacity and generation and small-scale solar is not integrated with the Short-Term Energy Outlook electricity model.