Release Date: March 7, 2023
STEO Between the Lines: EIA expands publication of short-term forecasts for U.S. power plants' generating capacity
Data values: U.S. generating capacity
With this month’s Short-Term Energy Outlook (STEO), we are now including all types of U.S. electric generating capacity in our forecast. In addition to the capacity series for renewable energy technologies that we have published since 2017, we have added our forecasts for generating capacity for natural gas, coal, petroleum, nuclear, and selected electricity storage technologies.
Over the period considered in the STEO, trends in electricity generation tend to follow changes in generating capacity. As developers add generating capacity from renewable sources to the grid we expect more renewable electricity generation given regulatory incentives and renewables’ low operating cost relative to other sources. The declining capacities of U.S. coal power plants and, to a lesser extent, nuclear power plants also reduced the amount of electricity generated from those sources.
Generating capacity measures the maximum power a unit can produce at a certain instant and is usually measured in megawatts (MW) or gigawatts (GW). The amount of electricity generation, measured in kilowatthours, represents output energy and reflects the degree to which this capacity is used over a given period of time.
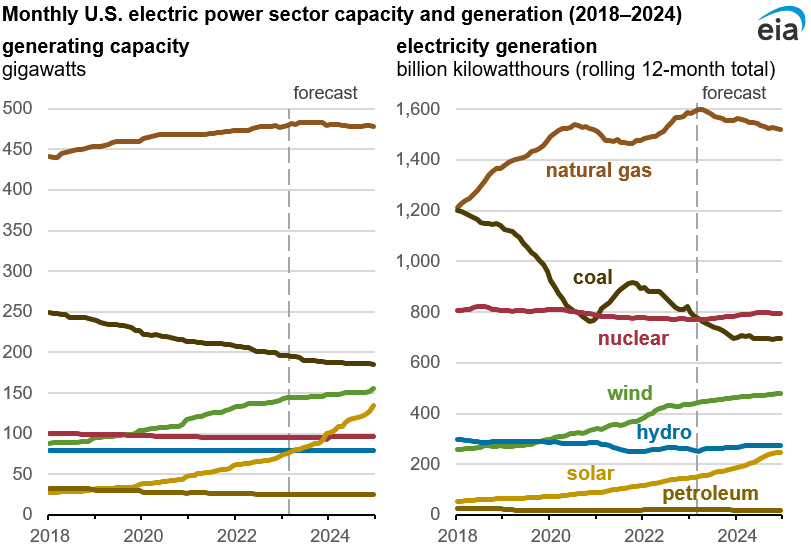
Data values: U.S. generating capacity, U.S. electricity generation
The figure above illustrates the relationship between installed capacity (left panel) and electricity generation (right panel). Because wind, solar, and nuclear have the lowest operating costs, their electricity generation over time mirrors their trend in installed capacity: slightly declining for nuclear, and increasing for wind and solar. By contrast, natural gas and coal have higher operating costs, and so their generation can vary over time depending on demand levels and the relative operating cost of other technologies.
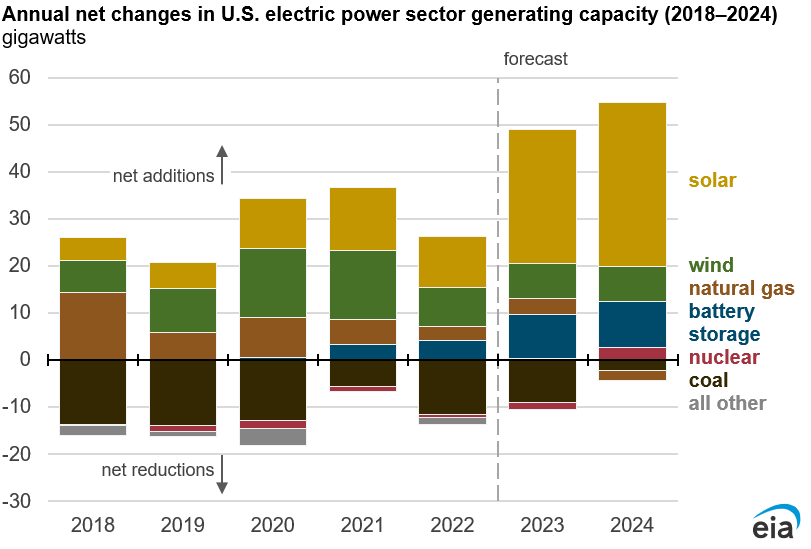
More capacity from renewables and batteries
Solar, wind, and battery technologies account for most of the added capacity in 2023 and 2024. At the end of 2022, we estimate the electric power sector operated 72 GW of solar capacity; we forecast that capacity to increase by 29 GW (40%) in 2023 and by 35 GW (35%) in 2024.
Wind power capacity also increases in the forecast but at a slower pace of 7 GW each year. Battery storage projects, which are often built with solar projects, are also expanding rapidly from their 9 GW of capacity at the end of 2022. We forecast battery capacity will rise by 9 GW (104%) in 2023 and by 10 GW (54%) in 2024.
Capacity changes for fossil and nuclear technologies
In contrast to the growth in renewables, generating capacity from coal continues to decline. We expect that 9 GW of capacity at coal-fired power plants (which collectively measured 197 GW at the end of 2022) will retire in 2023 and 2 GW will retire in 2024. This represents a 6% decline in coal capacity over the two year period.
Although some new natural gas power plants will come online over the forecast, we expect a small net reduction (less than 1%) in U.S. natural gas capacity in 2024 as several relatively large natural gas-fired power plants retire.
Nuclear capacity declined last year by about 1% with the retirement of the 0.8 GW reactor at the Palisades nuclear power plant in Michigan. One of the reactors at the Diablo Canyon nuclear plant in California (1.1 GW) is scheduled to retire in November 2024, but we expect overall nuclear capacity to increase with the addition of two reactors at the Vogtle power plant (Units 3 and 4, totaling 2.2 GW) by the end of 2024.
Historical data source and comparison to other EIA series
The primary source for our capacity forecasts is EIA's Preliminary Monthly Electric Generator Inventory. This generator inventory dataset is based on our annual and monthly surveys of utility-scale power plants. In this survey, power plant operators and developers also report plans to bring online or retire power plants.
STEO historical data and forecasts for generating capacity are not necessarily identical to the information in the Preliminary Monthly Electric Generator Inventory and data in other EIA publications for a few reasons. First, the inventory of power plants is constantly changing as survey respondents provide updates on generator construction and retirement schedules, and compiling this information at different points in time may result in slightly different values.
Second, the STEO forecasts may incorporate publicly available information that is not yet reflected in survey responses. For example, Southern Company reported on its survey for December 2022 that it planned to bring Unit 3 at the Vogtle nuclear plant in Georgia online in March 2023. However, in their annual report to the Securities and Exchange Commission, Southern Company stated that Vogtle Unit 3 may not be online until May or June. For this STEO, we are assuming Unit 3 will come online in June.
Finally, we may increase expected solar photovoltaic capacity in the second year of the STEO forecast based on analyst judgment. Solar projects tend to have relatively short lead times, and the information we have about projects beyond 12 months is more limited than the projects coming online sooner.