Forecast overview
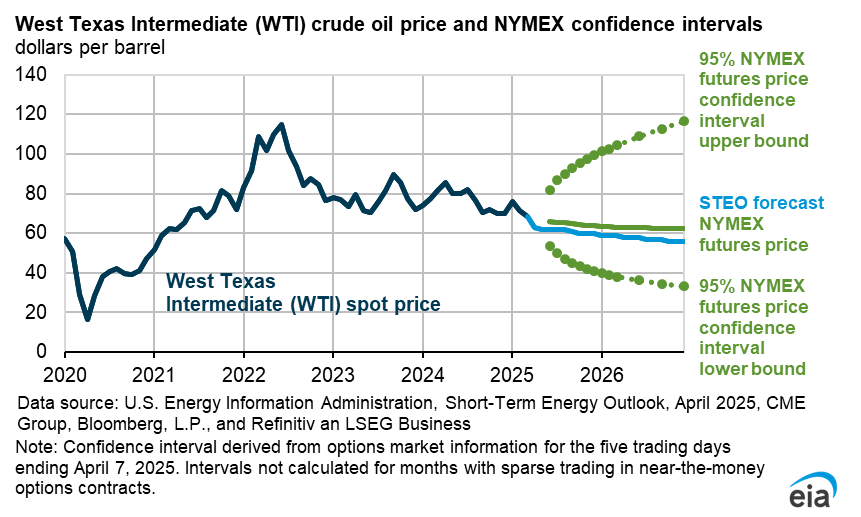
- Recent oil price movements. We completed modeling and analysis for this report on April 7. More recent policy changes are not incorporated. Recent developments in trade policy and oil production led to a significant drop in oil prices during the first week of April. On April 2, President Donald J. Trump signed an Executive Order announcing 10% tariffs on imports from all countries, with higher tariffs initially imposed on some countries. On April 4, China responded by imposing 34% tariffs on imports from the United States. Amidst the tariff announcements, OPEC+ members announced on April 3 that some countries will start production increases in May that were originally set for July. Following these announcements, the Brent crude oil spot price fell by 14% from April 2 to $66 per barrel (b) on April 7. We expect that prices for crude oil and other commodities will continue to experience significant volatility as market participants assess the effects of trade policies.
- Trade policy assumptions. The U.S. macroeconomic outlook we use in the Short-Term Energy Outlook (STEO) is based on S&P Global’s macroeconomic model. The most recent model was released in mid-March and does not completely reflect the tariffs announced on April 2, however, the assumptions included are partly in line with the announcement by the President on April 2. S&P Global’s forecast assumes an increasing universal tariff that will reach 10% by the end of 2025 and a higher rate on U.S. imports from China. We use Oxford Economics for our global GDP forecast, which was also completed in mid-March, prior to the most recent tariff announcements.
- Global oil demand. We assess that there could be less oil demand growth, and we have reduced our outlook for global oil demand accordingly. We now expect that global oil consumption will increase by 0.9 million barrels per day (b/d) in 2025 and 1.0 million b/d in 2026, 0.4 million b/d and 0.1 million b/d less than what we forecast in last month’s STEO, respectively. However, because the recent updates to trade policy widen the range of possible GDP growth outcomes, this forecast is subject to significant uncertainty.
- Global oil prices. We expect global oil inventories will increase starting in the middle of 2025 as OPEC+ members unwind production cuts, production grows in non-OPEC countries, and oil demand growth slows. As a result, we forecast the Brent crude oil price will average $68/b in 2025 and fall to an average of $61/b in 2026. Those prices are $6/b and $7/b lower, respectively, than in last month’s STEO and reflect more uncertainty around global oil demand growth as well the potential for additional supply from OPEC+ in the coming months. However, factors including existing sanctions on Russia, Iran, and Venezuela create additional uncertainty for crude oil prices.
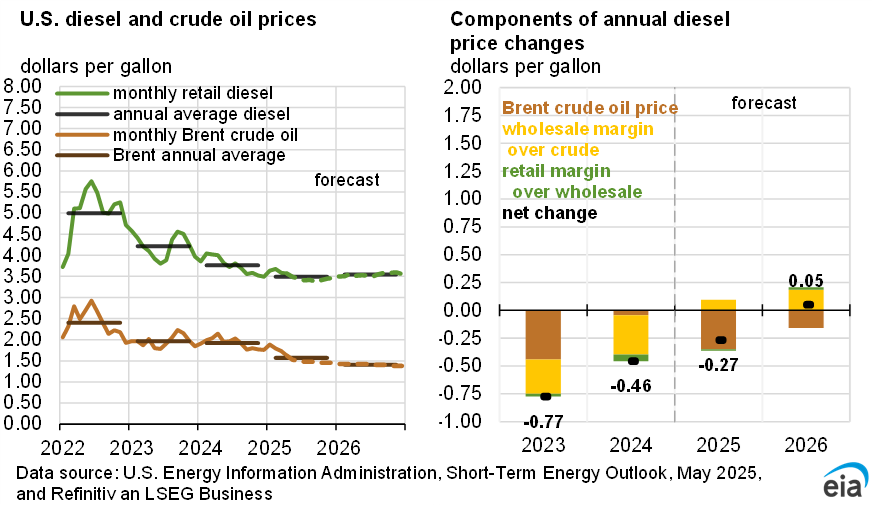
- Gasoline prices. The U.S. retail price for regular grade gasoline averages about $3.10 per gallon (gal) in our forecast for this summer (April–September), about 20 cents/gal less than our forecast in the March STEO. The lower gasoline price forecast mostly reflects our expectation of lower crude oil prices. If realized, our forecast gasoline price would be the lowest inflation-adjusted summer average price since 2020.
- U.S. propane markets. Among energy products, we expect that China’s retaliatory tariffs on U.S. goods will have the largest effect on propane. China is major importer of U.S. propane, and we expect that tariffs will limit China’s demand for U.S. propane exports. Some propane previously exported to China will likely find new destinations. However, we expect that reduced propane export demand will cause propane inventories on the U.S. Gulf Coast to rise and put downward pressure on the Mont Belvieu propane spot price.
- Natural gas demand. U.S. natural gas demand, which we calculate as domestic consumption plus exports, grows by 4% to 116 billion cubic feet per day (Bcf/d) in 2025 in our forecast. The growth is led by a 18% increase in exports and a 9% increase in residential and commercial consumption for space heating. The increase in natural gas exports is driven primarily by an increase in liquefied natural gas (LNG) exports as two new LNG export facilities ramp up operations. Plaquemines LNG Phase 1, which started operations late last year, has been ramping up exports more quickly than we initially forecast. As a result, we now expect U.S. LNG exports of just over 15 Bcf/d in 2025, or about 1 Bcf/d (7%) more than we had forecast last month. Although China is currently not importing U.S. LNG, we assess that ample global demand for LNG and flexible destination clauses in U.S. LNG contracts mean U.S. LNG exports will be largely unaffected by recent trade policy developments.
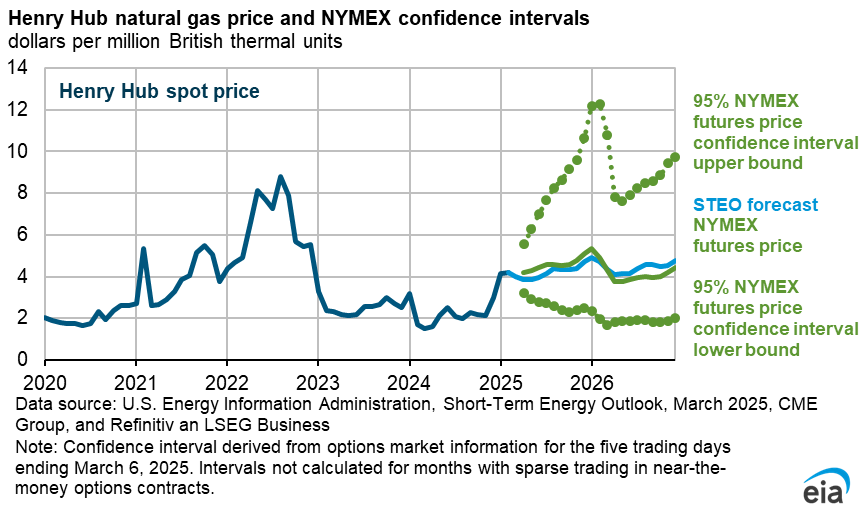
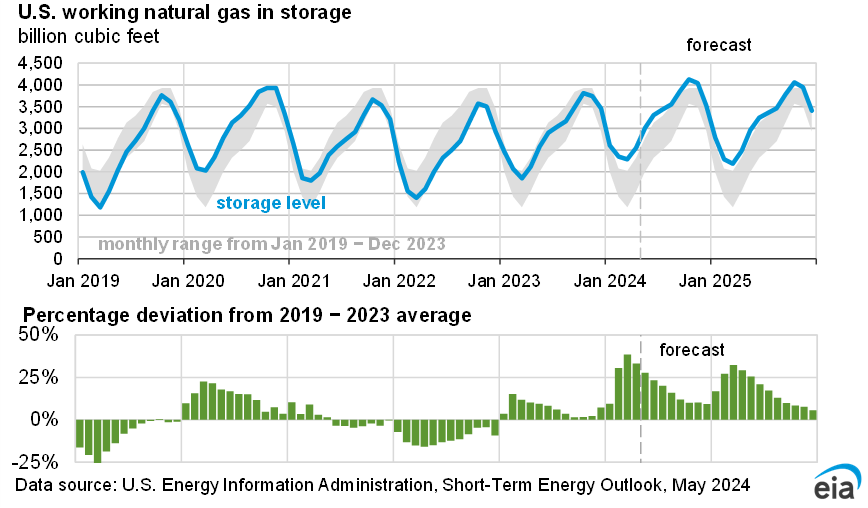
- Natural gas inventories and prices. Relatively warm weather in March across much of the United States limited the consumption of natural gas for space heating, leading to less natural gas being withdrawn from storage than we had forecast in the March STEO. Despite a net injection into storage during March, U.S working natural gas inventories ended the withdrawal season (November–March) 4% below the five-year average as cold weather in January and February resulted in more natural gas than average being withdrawn from storage. Consequently, we expect higher natural gas prices this year, with the Henry Hub price averaging around $4.30 per million British thermal units (MMBtu) in 2025, up about $2.10/MMBtu from 2024. We expect the annual average price to increase another 30 cents/MMBtu in 2026 to around $4.60/MMBtu.
- Electricity generation. Renewables continue to supply most of the growth in U.S. electricity generation. We expect electricity generation from hydropower to increase by 7% in 2025 compared with 2024 as water supply levels return to normal, following a drought in the Pacific Northwest in the spring of 2024 which led to lower-than-normal levels of hydro generation.
| Notable Forecast Changes | 2025 | 2026 |
|---|---|---|
Note: Values in this table are rounded and may not match values in other tables in this report. Percentages are calculated from unrounded values. |
||
| Brent crude oil spot price (dollars per barrel) | $68 | $61 |
| Previous forecast | $74 | $68 |
| Percentage change | -8.6% | -10.2% |
| Global oil demand growth (million barrels per day) | 0.9 | 1.0 |
| Previous forecast | 1.3 | 1.2 |
| Change | -0.4 | -0.1 |
| Mont Belvieu propane spot price (dollars per gallon) | $0.80 | $0.50 |
| Previous forecast | $0.90 | $0.90 |
| Percentage change | -18.0% | -40.7% |
| U.S. propane inventories (million barrels) | 89 | 96 |
| Previous forecast | 78 | 81 |
| Percentage change | 13.6% | 18.6% |
| U.S. LNG gross exports (billion cubic feet per day) | 15 | 16 |
| Previous forecast | 14 | 16 |
| Percentage change | 7.0% | 0.0% |
| U.S. secondary coal inventories (million short tons) | 110 | 100 |
| Previous forecast | 100 | 80 |
| Percentage change | 6.1% | 24.1% |
You can find more information in the detailed table of forecast changes.