Drought conditions reduce hydropower generation, particularly in the Pacific Northwest

In our latest Short-Term Energy Outlook (STEO), we forecast that electricity generation from U.S. hydropower plants in 2024 will be 13% less than the 10-year average, the least amount of electricity generated from hydropower since 2001. Extreme and exceptional drought conditions have been affecting different parts of the United States, especially the Pacific Northwest, which is home to most U.S. hydropower capacity.
As of the end of September, 72.6% of the continental United States was experiencing dryer-than-normal to exceptional drought conditions, according to the U.S. Drought Monitor. By the end of October, this value increased to 87.2%. Multiple regions are affected by drought conditions, but the effects on hydropower generation are more obvious in the Pacific Northwest. For example, a recent study conducted by the University of Alabama found that hydropower generation in Washington state is one of the most susceptible to droughts in the country, ranking right below California based on data from 2003 to 2020.
Drought impacts this year
The Pacific Northwest’s Columbia River is the fourth-largest river in the United States by volume. Its watershed, the Columbia River Basin, covers large parts of four states: Washington, Oregon, Idaho, and Montana. The basin is home to some of the largest hydropower dams in the country, such as the Grand Coulee with a net summer capacity of 6.7 gigawatts (GW) and Chief Joseph with 2.4 GW of capacity.
As early as April of this year, the Washington State Department of Ecology declared most counties in the state under drought. The department takes this step when water supply in the state is less than 75% of normal. In Oregon, two counties declared a drought emergency this summer, first in June in Jefferson County and then in September in Lake County.
The Dalles Dam located between Oregon and Washington, with a total net summer capacity of 1.8 GW, is considered a good indicator of water supply conditions in the upper Columbia River. At the end of September, water supply at The Dalles Dam was at 74% of the 30-year normal for the summer months (April through September), according to the Northwestern River Forecast Center. Hydropower generation peaks in the summer months in response to seasonal peak demand.
According to the U.S. Department of Agriculture’s Basin Outlook Reports, reservoir storage at the end of September was 48% of capacity in Oregon, 67% of capacity in Washington, 76% in Montana, and 60% in Idaho.

On a monthly basis in 2023, across Washington, Oregon, Idaho, and Montana, hydropower generation has been close to or below the lower end of the 10-year range, except for a brief spike in May due to a heatwave. In Washington and Oregon, hydropower generation in 2024 was mostly higher than in 2023, especially during the summer months. In Idaho and Montana, hydropower generation in 2024 was below 2023 levels from April through August.
Drought effects in the Northwest according to STEO
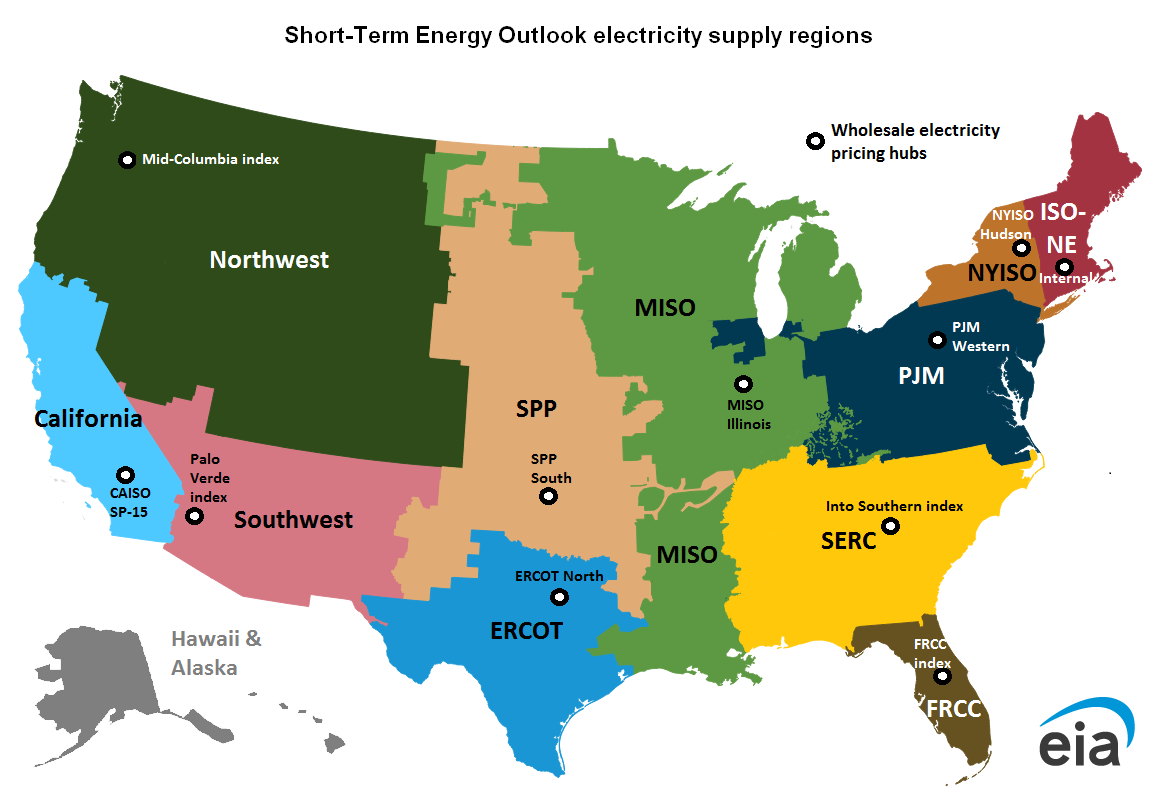
In the STEO, we forecast electricity generation for electricity market regions instead of state geographical boundaries. We expect hydropower generation in the Northwest electricity region, which includes the Columbia River Basin and parts of other Rocky Mountain states, to total 101.8 billion kilowatthours (kWh) in 2024, a 23% decrease from the 10-year average of 132.8 billion kWh and a 1% decrease from 2023.

Principal contributor: Lindsay Aramayo
Tags: hydroelectric, electricity, generation, Northwest, weather, map