IEO2021 Issues in Focus: Energy Implications of Potential Iron- and Steel-Sector Decarbonization Pathways
Executive Summary
The steel industry is carbon-intensive, accounting for approximately 7% of global carbon dioxide (CO2) emissions in 2020. Steel is typically produced through a process that uses blast furnaces to produce pig iron and basic oxygen furnaces to produce steel (BF-BOF). Although the BF-BOF pathway is currently prevalent, another common approach to making steel, which uses recycled materials and employs electric arc furnaces (EAF), is much less carbon- and energy-intensive.
Steel is already the most recycled material in the world, and efforts to further reduce carbon intensity in the steel industry will require even more recycling. Recycling does have limitations, such as scrap availability and purity concerns for steel made from repeatedly recycled steel, that force producers to look for other options to produce high purity crude steel using low carbon-intensive processes.
To explore the viability of these goals, in this analysis, we focused on increasing EAF production with renewable power and supplementing scrap steel feedstock with direct reduced iron (DRI) made from electrolytic hydrogen powered by renewable sources. We quantified varying CO2 emissions reduction potentials in the steel industry for four regions by:
- Increasing the share of DRI used in the EAF feed (to reasonably compensate for the growing replacement of iron ore-based BF-BOF virgin steel with scrap-based EAF recycled steel)
- Increasing the renewable hydrogen employed in DRI production
- Increasing the renewable power used for EAFs
Examining these cases on a regional basis illustrates the variability in the additional renewable power needed for the steel industry, depending on the regional generation mix. For example, we discovered that a decrease in carbon intensity of 22% from our International Energy Outlook 2021 (IEO2021) Reference case requires 25% more renewable power generation by 2050 in South Korea, but a decrease in carbon intensity of over 30% in OECD Europe1 requires only a 9% increase in renewable power generation.
Although we did not go into details regarding hydrogen (H2) production, transportation, storage, or distribution, these cases illustrate the regional effects of partial decarbonization of the steel industry relative to our Reference case results. Compared with the Reference case, the carbon intensity of crude steel production decreased by 14% in China by 2050, by 24% in Japan, by 22% in South Korea, and by 31% in OECD Europe. These reductions require investments in both the steel production process itself as well as in renewable power generation.
Introduction
Crude steel—steel in its first solid state after melting, which is suitable for further processing and transformation—can be manufactured in two ways (Figure 1). Both processes generally follow two steps: 1) ironmaking—reducing iron ore (iron oxide) into iron with a reducing agent, and 2) steelmaking—converting iron into steel in a furnace. More specifically, the two processes use either: 1) coal, blast furnaces (BF), pig iron (a pure iron product), and basic oxygen furnaces (BOFs) or 2) synthesis gas (syngas)—a mixture of hydrogen (H2) and carbon monoxide (CO), shaft furnaces or rotary kilns, direct reduced iron (DRI), and electric arc furnaces (EAFs). About two-thirds of all crude steel is currently produced through the BF-BOF process, which uses BFs to produce iron, and then BOFs to convert that iron into crude steel—a large proportion of which is high-quality virgin (non-recycled) crude steel. The remaining one-third of all crude steel is produced in EAFs. Although EAFs use scrap steel to produce most of today’s recycled steel, they can also employ DRI to produce virgin steel.
Figure 1.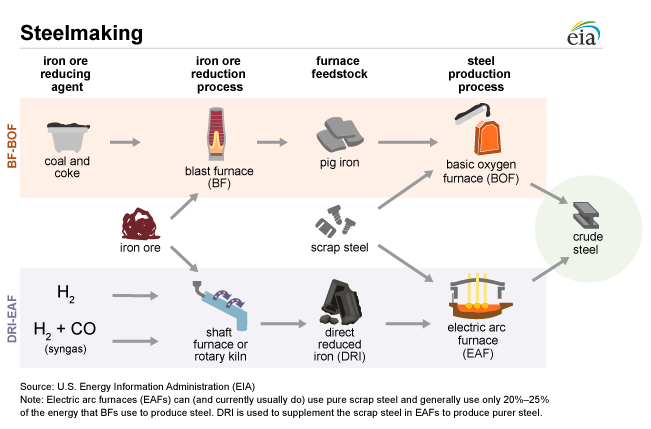
The iron and steel industry is energy- and carbon-intensive
The iron and steel manufacturing industry is one of the most energy- and carbon-intensive industries in the world, accounting for approximately 7% of total global carbon dioxide (CO2) emissions in 2020. Most of the CO2 emissions from iron and steel manufacturing result from the reduction of iron ore in BFs, which use coke (a concentrated form of coal) to chemically reduce iron ore through an energy- and carbon-intensive process.
Potential to decarbonize the iron and steel industry
Even though steel manufacturing is energy- and carbon-intensive, steel is a vital component of construction and supports any transition to carbon-free electricity generation and use of energy:
- Utility-scale solar farms use steel for panel mounts.
- Nuclear, hydroelectric, and wind power generation all use steel in their construction.
- Electrical power transmission and distribution infrastructure needed for electrification use steel for construction.
The DRI-EAF process is less carbon intensive than the traditional BF-BOF process, and further reductions to carbon intensity are possible by using renewable energy to power electric furnaces, such as EAFs. Using H2 as the sole reductant in the DRI process has been demonstrated at a small scale, and using renewable energy to produce electrolytic H2 (H2 produced by a process of using electricity to decompose water into oxygen and hydrogen gas) will be critical in any effort to decarbonize iron and steel production.
In this analysis, we explore what happens to energy consumption and CO2 emission levels in potential deep decarbonization cases of the iron and steel industry, assuming:
- Greater use of EAFs (and less use of BFs-BOFs) to produce crude steel
- More DRI to compensate for the lower steel production from the BF-BOF process
- Increasing employment of electrolytic H2 in DRI production (to lower the carbon emissions associated with using syngas in the current DRI process)
By increasing the DRI percentage in the EAF feed and simultaneously increasing the renewable H2 employed in DRI production, the renewable power used for EAFs reduces emissions and energy intensity in the steel industry. However, this shift to DRI-EAF does not necessarily induce lower CO2 emissions from steel production because most DRI production is currently coal- or natural gas-based in a shaft furnace or rotary kiln, which contributes to CO2 emissions and, to some degree, offsets the benefit of moving away from the coal-intensive BF-BOF production. As renewable-based electrolytic H2 production reaches cost parity with natural gas-based H2 production, however, the former will likely become more predominant in DRI production as it becomes an affordable way to lower emissions in the steelmaking industry. Put together, the analysis in this paper shows that implementing more EAF production lowers emissions in the steel industry, but the rate at which emissions are lowered depends on:
- The assumed increase in EAF production
- When renewable-based H2 reaches cost parity with fossil fuel-based H2
- The evolving power generation profile of the region
This analysis examines these changes in the steel industry at the process level (virgin versus recycled steel production). We do not examine specific production and operational technologies because, although important, changes in these technologies would not fundamentally change the carbon intensity of the steel industry.
This sensitivity analysis focuses on only one aspect of the steel industry—the production of the crude steel itself. We assume the downstream production of refined steel and alloys does not change, nor does the demand for steel products. By narrowing this study’s analytic focus, we can directly attribute changes in fuel consumption and power generation to the changes in the crude steel production process. Finally, although this analysis narrowly focuses on the crude steel production process, the results affect the broader energy economy, demonstrating that an industrial policy targeting just a single part of a single industrial subsector can have broad economic ramifications on energy markets.
Market and Industry Description
Although making finished steel from iron ore has many steps, this analysis focuses on the two primary production processes: the coal-based carbon-intensive BF-BOF production process and the less carbon-intensive EAF production process, which most often produces recycled steel from scrap steel. Both the BF-BOF and EAF production processes generally involve two main parts: ironmaking and steelmaking.
Ironmaking
After mining and pelletizing iron ore, the first step in the steelmaking process involves removing impurities from the ore. By taking advantage of chemical relationships to strip away oxygen atoms, this step leaves behind relatively pure iron that can be used to make crude steel. There are two primary processes to make iron:
- BFs use coal to heat the iron ore while limestone and coke contain the chemical elements that will reduce the iron ore to pure iron.
- The DRI process typically uses natural gas or coal to heat the iron ore and syngas to reduce the iron ore to pure iron.
Steelmaking
Two processes can change purified iron into crude steel. These processes have different historical uses and potentially different energy and carbon intensities.
Basic oxygen furnaces
Most blast furnaces are located within a large integrated steel mill where the iron ore is smelted into iron, and the hot metal is fed directly into the BOF. The BOF:
- Uses oxygen to reduce the carbon content
- Adds a small amount of scrap metal and alloying elements (for example, chromium)
- Creates virgin crude steel
Virgin steel, primarily produced by BOF, is an important material for many end uses because of its specific properties that construction, aerospace, and many other industries require. Although some scrap can be used to make steel for these uses, purity requirements can limit the amount of scrap steel that can be used.
Electric furnaces
EAFs or induction furnaces (IFs) both use electricity to create crude steel, and both are referred to as electric furnaces. Most scrap steel and DRI goes into either an EAF or IF. Electric furnaces traditionally produce recycled steel products, and although most EAFs and IFs currently operating serve that purpose, not all do. Today, relatively smaller steel production facilities—referred to as mini-mills—can produce steel with either DRI, high-quality scrap, or low-quality scrap mixed with DRI as the main metallic input. Steel with DRI as the primary input results in virgin steel of a similar quality produced in the BF-BOF process. Electric furnaces can make crude steel that ranges from 100% recycled to virgin steel, depending on the intended end use.
Moving more aggressively toward scrap-based production will not only require a reliable and economic supply of scrap steel, but it will also require a supplemental source of pure iron to compensate for the declining amounts of pig iron, a result of the decreasing share of BF-BOF production. DRI can fill the pure iron requirement. However, to accomplish both expanded EAF production and maintain a sufficient supply of iron from iron ore—while significantly lowering carbon intensity—two things must happen:
- The reducing agent for DRI must increasingly come from renewable-sourced H2.
- The electricity to power the EAFs must increasingly come from renewable sources.
These decisions at various stages of the steel production process have energy and emissions implications.
Hydrogen
Although H2 is better known for its capabilities as an energy carrier, in the iron and steel manufacturing sector, H2 can be used as a replacement for syngas as a reducing agent in pure iron production. In addition, blast furnaces could replace some pulverized coal (sometimes used as a reducing agent instead of, or alongside, coke) with H2, and H2 could provide a source of carbon-free, high-quality heat for the steel industry and, more broadly, various other industrial heat applications.
Using H2 in the iron and steel manufacturing sector does not necessarily lead directly to the sector’s decarbonization. In 2018, fossil fuel-based production of H2 accounted for approximately 99% of total global production—76% from natural gas and 23% from coal. The remaining 1% was produced through electrolytic processes.2 H2 produced through the steam reformation of natural gas has a large carbon footprint compared with renewable-fueled water electrolysis. Today, steam reformation of natural gas is the primary technology to produce H2, and nearly all electrolytic H2 is produced as a byproduct of the chlor-alkali process (the electrolysis of sodium chloride) in the chlorine industry. In the years ahead, electrolytic H2 powered by renewable energy will be essential to decarbonizing the steel industry.
Challenges and uncertainties
Several important technological, economic, emissions-related, and infrastructure challenges not directly addressed in this analysis must be overcome to significantly lower the steel industry’s carbon intensity by using hydrogen, including:
- Engineering challenges associated with quickly developing H2-based DRI at commercial scale
- Economic challenges associated with scaling up renewable energy-powered electrolytic H2 production to reach cost parity with fossil fuel-based H2
- Economic challenges associated with replacing current BF-BOF capital stock, which are expensive and typically have 50-year life cycles
- Challenges associated with decarbonizing upstream processes (mining and beneficiation of iron ore) and downstream processes (rolling, shaping, and extruding finished steel products) beyond incremental efficiency and operational improvements
- Multiple emerging technologies and pathways for creating H2 from renewable resources, for example, biomass gasification
- The competition between fossil-fuel methane reforming with carbon capture and sequestration and electrolytic (or other renewable) H2 production methods
- The potential economic benefits of H2 storage arising from the intermittent nature of renewable power generation and its use in electrolytic H2 production
Case Descriptions
We examine four regions (China, Japan, South Korea, and OECD Europe) in this paper. This analysis examines two modeled cases—the Early Adoption case (EAC) and the Delayed Adoption case (DAC)—where the production of iron and steel shifts sharply toward DRI-EAF. We construct our cases primarily around three considerations:
- When renewable-powered H2 reaches cost parity with fossil fuel-based H2
- The share of DRI produced with renewable-powered electrolytic H2
- The share of electric furnaces powered by renewable electricity
These cases examine two possible pathways toward producing high-quality, low carbon-footprint steel:
- The use of H2, particularly electrolytic H2 once cost-parity is reached, to reduce iron ore in the DRI process
- Powering EAFs with renewable energy, which, for this analysis, includes solar, wind, biomass, waste, and geothermal electricity-generating technologies
Assumptions
- For both cases, we assume that the share of steelmaking using electric furnaces rises—and the share of BOF-produced steel, as a result, falls—by approximately 30% from 2010 to 2050 in all analysis regions except China (Figure 2). The Reference case included assumptions that China’s industrial economy will continue to mature—thus increasing the supply of scrap steel. In both of these cases, we assumed that EAF shares rise by almost 40%. The starting and ending shares of steel produced by electric furnaces varies by region.
- By 2050, we assume in both cases that 40% of metallic input to electric furnaces is DRI (that is, the scrap-to-DRI ratio is 60:40) in order to both supplement the steel scrap supply and to compensate for less BF-BOF production of virgin steel. This shift allowed the increased use of EAFs to maintain about the same virgin-to-recycled steel composition, because DRI can produce virgin steel.
- In the EAC, we assume that renewable H2 reaches cost parity with fossil fuel H2 by 2030. The share of DRI produced with electrolytic H2 and powered by renewable energy reaches close to half—48%—by 2050. The share of electric furnaces powered by renewable energy reaches the same share by 2050.
- In the DAC, we assume that renewable H2 reaches cost parity with fossil fuel H2 by 2040. The share of DRI produced with electrolytic H2 and powered by renewable energy reaches nearly one-third—31%—by 2050. The share of electric furnaces powered by renewable energy also reaches the same share by 2050.


The steel industry gross output projection is the same across all three cases—the Reference case, EAC, and DAC (Figure 3). In Japan, South Korea, and OECD Europe, we kept the relative amounts of virgin steel and recycled steel produced nearly the same (in other words, within 5%) as their latest (2019) historical values through 2050 to preserve the overall crude steel (virgin versus recycled) composition throughout the projection period. In China, because both the historical proportion of virgin steel is high and the country’s industrial economy is expected to continue maturing, thus increasing the supply of scrap steel—we assumed the virgin steel share would lower considerably through 2050 in all three cases.
Figure 3.
Regions
This paper examines four regions from our International Energy Outlook 2021: China, Japan, South Korea, and OECD Europe. We selected these regions either because of the size of their steel industries, the composition of their steel industries, or announced decarbonization plans for steel production.
China
China produces half the world’s steel and will be a key player in any effort to transform the way the world produces steel. As of 2019, China’s steel production relied heavily on coal-fired technologies, primarily using integrated steel mills with BFs and BOFs for almost 90% of its production.3 China’s BF-BOF fleet is also relatively new—15 years old on average; steelmaking capital has a useful lifespan of over 40 years. However, that lifespan is achieved only if producers make an additional investment decision after about 25 years to replace the refractory lining in the BFs. This process costs about half of what a new BF costs and requires taking the BF offline for a significant period of time. If steel producers in China decide to stop using BFs instead of replacing their refractory lining, the transition to alternative technologies might be faster.
China’s rapid buildout of its steel industry began around 2000. The industry quickly gained momentum, helping to build up urban areas with new infrastructure and skyscrapers, all of which require large quantities of steel. Steel products have a long life span, which means most of the steel China has produced since its industrial period began is still in use in the heavy equipment, bridges, and buildings it was used to create, leaving very little end-of-life scrap to be recycled. In the coming years, however, we expect China to have more and more scrap available to recycle, which will aid in reducing its share of coal-fired steelmaking. Additionally, decarbonization of heavy industry in China—including the steel industry—would contribute to China’s announced net zero carbon goals.
In the cases examined for this analysis, the share of steel production in China produced by the country’s fleet of electric furnaces increases from about 13% in 2020 to 50% in 2050. A shift of this magnitude in China would be challenging and would require retiring a large number of basic oxygen furnaces well before their typical end-of-life retirement. Another challenge would be the financial investment required to both expand the electric furnace fleet and to add the very large amounts of solar and wind capacity required to produce electrolytic hydrogen and to power the electric furnaces. Nonetheless, the impact of these cases sheds light on the broader energy landscape given China’s outsized importance in the global steel industry.
Japan and South Korea
Japan and South Korea both have mature steel industries that rely primarily on BF-BOF production. As a result, in this analysis, energy consumption can meaningfully shift in these countries with more EAF-produced steel. Additionally, these countries are both formally committed to long-term decarbonization goals in their industrial sectors.4 Japan has committed to move its energy economy to rely on fossil-fuel H2 with carbon capture and storage (CCS) and renewable-based hydrogen, making electrolytic hydrogen-based DRI a likely component within their overall hydrogen goals. Companies in Japan have committed to investing in a robust hydrogen economy, which would also involve the industrial sector.5 Similarly, South Korea has outlined a hydrogen economy roadmap in its effort to curb greenhouse gas emissions.6 Important to the current analysis, South Korea’s steel industry, led by POSCO,7 has announced plans to build hydrogen production capacity as part of this effort.
In 2019, Japan primarily used efficient blast furnaces to produce its coal-fired steel products—76% of crude steel in Japan was produced with the BF-BOF process. However, Japan is a mature economy with infrastructure that will need to retire during the projection period, meaning that steel scrap availability should remain high which could support progress toward producing low-carbon steel. South Korea is similar to Japan in terms of sharing similar profiles in steelmaking technologies and resource availability. Like Japan, South Korea primarily uses efficient blast furnaces to produce high levels of coal-fired steel products—68% of crude steel made in South Korea came from the BF-BOF process in 2019.8
Japan faces challenges in reaching the electrolyzed hydrogen levels assumed in these cases. Japan has the highest industrial electricity prices of the four regions featured in this analysis, followed by South Korea. As a geographically small island nation, Japan may encounter land resource constraints for building large-scale wind and solar farms needed to meet the required renewable generation levels under the case assumptions. Instead, it may require large offshore wind projects or imported intermediate products such as hot briquetted iron or hydrogen. Like Japan, South Korea may not have enough land readily available to set up utility-scale renewable power generation.
OECD Europe
OECD Europe was included in this analysis because member countries, such as Germany, have put government funding into pilot projects for green steel—steel with a low carbon footprint. International steel manufacturing company Arcelor-Mittal has committed to producing green steel through DRI from renewable hydrogen in a plant in Hamburg, Germany; the Swedish company Hybrit has already made a delivery of this lower-carbon steel to a customer.
OECD Europe is well positioned for a transition to low-carbon steelmaking with:
- Sufficient land resources for wind and solar projects
- A high level of scrap steel availability
- Existing natural gas pipelines that can move hydrogen to industrial users
- Stringent carbon dioxide emission policies
The German government has committed funding to decarbonize its steel industry, with H2 use as a key component.7 As of 2019, the OECD Europe region also had the smallest share of BF-BOF produced steel among the regions analyzed in this paper, at 52%.
Even with those starting advantages, the region will still require major investment in the expansion of renewable energy capacity to satisfy the assumed demands for the greater share of renewables-powered EAFs and production of electrolytic H2 in these scenarios.
Results and Discussion
Industrial energy consumption
In all regions, in both the EAC and DAC, coal use generally declines, and electric power use increases in the steel industry between 2020 and 2050—the projection period in the IEO2021 (Figures 4–7). These changes in coal and power consumption occur because of the assumed increase in EAF production in the two alternative cases. Natural gas consumption increases in these cases over Reference case levels because the increased EAF production needs to be supplemented with DRI to compensate for much lower (carbon-intensive) BF-BOF virgin steel production. Further, under the more aggressive assumption regarding cost parity of renewable H2 with fossil fuel-based H2 earlier (by 2030) in the EAC, natural gas consumption trends slightly lower and power consumption slightly higher than in the DAC. This change occurs because we assume that renewable H2 reaches fossil fuel cost parity earlier, which increases H2 production and renewable power generation and leads to less DRI made from natural gas reformation.
Overall energy intensity in China’s steel industry declines in the alternative cases, driven by a shift toward the less energy-intensive EAF production. This decline is limited, however, by the growth in natural gas required for DRI production to grow. The relative change in overall energy intensity is greater for Japan, South Korea, and OECD Europe than for China because of the more significant change in the share of EAF and BOF.
Figure 4.
Figure 5.

Figure 6.

Figure 7.

Electricity Market
Across the cases and regions, the electricity market response varies. In the EAC, we assume renewable-based H2 reaches cost parity with fossil fuel-based H2 by 2030 and that EAF production grows substantially. These two changes lead to more overall renewables generation compared with the DAC, which assumes cost parity occurs 10 years later. Renewable electricity is required for the clean electricity to produce both electrolytic H2 and higher renewable-powered EAF. Note that in all cases, despite the growth of renewable power, the electricity price was not appreciably affected because the renewable generation increases were small compared with total generation and, as such, had a limited impact on both the marginal and average cost of electricity across regions (Figure 8).
Figure 8.
China
In the EAC, the additional renewable power generation in China reaches 385 billion kilowatthours (BkWh) in 2050, an 8.7% increase over the Reference case level. For the DAC, an additional 314 BkWh of renewable electricity generation is needed by 2050, a 7.1% increase over the Reference case level.
In the Reference case, we project that China will see significant battery storage capacity growth, coupled with solar capacity growth, thus maximizing the combined economic and operational advantages of battery storage and solar energy over wind energy, as well as the abundant availability of high quality solar resources. Because of these advantages, the additional renewable power demand from China’s industrial sector in the EAC and DAC will mostly be met by growth in solar and battery storage combined (Figure 9), as battery storage overcomes the time-of-day limitation of solar power. Increases in renewable electricity generation only result in marginal power cost increases in the industrial sector in 2030 in the EAC; power prices in the other end-use sectors are only slightly affected or not affected at all. By 2050, battery storage capacity grows 45 gigawatts (GW) more in the EAC and 36 GW more in the DAC than the 291 GW in the Reference case. The growth in both solar and battery capacity and generation displaces natural gas capacity and generation, relative to levels in the Reference case. We expect the growth in solar generation in both the EAC and DAC to incur a small amount of reliability cost, but the difference is not significant enough to cause a noticeable rise in power prices across all four end-use sectors.
Figure 9.
Japan
In the EAC, the additional renewable power needed compared to the Reference case totals 424 BkWh in 2050 in Japan, a 10.0% increase . For the DAC, the additional electricity from renewable sources reaches 419 BkWh in 2050, an 8.7% increase over the Reference case level.
In both the EAC and DAC, additional renewable-powered electricity demand from Japan’s industrial sector is met by growth in solid waste and wind, along with additional generation support from coal-fired and natural gas-fired generation to address grid reliability and transmission and distribution requirements (Figure 10). Wind generation is preferred over solar in Japan because of its cheaper generation costs, its ability to meet demand in non-daytime periods, and the availability of higher quality wind resources. Meeting the additional renewable generation requirements results in minimal increases in marginal power prices for most years in the DAC. Electricity consumption in other end-use sectors changes minimally. The resulting power price impacts in Japan are relatively insignificant because the marginal price increase is relatively small compared with the country’s already high base power prices (among the highest of OECD countries).
Figure 10.
South Korea
In the EAC, the additional renewable power generation in South Korea grows to 58 BkWh in 2050, a 27% increase over the Reference case level. In the DAC, the additional renewable power generation reaches 52 BkWh by 2050, a 24% increase over the Reference case.
After 2030, South Korea runs out of additional high-quality solar resources and, consequently, wind resources start to become more economically favorable. As a result, we expect South Korea’s additional renewable electricity demand in the industrial sector to be met by both solar and wind generation in both the EAC and DAC (Figure 11). In both the EAC and DAC, the growth in solar (which ranges from 16%–19% of total renewable generation additions by 2050) meets increased daytime demand, while the growth in wind generation (which ranges from 79%–83% of total renewable generation additions by 2050) meets the additional demand during the night and peak time-of-day periods. Natural gas provides additional generation support for grid reliability and transmission and distribution considerations.
Marginal prices for electricity generation are relatively high in South Korea before 2030 in both the EAC and DAC, indicating that meeting these minimum generation targets is not necessarily economic, but rather is policy driven before 2030. After 2030, meeting these requirements becomes economically driven. Relatively high increases in marginal power prices before 2030 cause some declines in electricity consumption across end-use sectors, except for the industrial sector, which indicates that the cost impact on power prices in South Korea is significant compared with the other three regions in this study. The need for additional generation from natural gas-fired generation (which peaks in 2035 in the EAC and DAC) also indicates that growth in solar and wind generation alone cannot meet the increased electricity requirement from renewable sources in South Korea without additional baseload generation to offset grid reliability risks.
Figure 11.
OECD Europe
In OECD Europe, additional electricity generation from renewable sources reaches 135 BkWh in 2050 in the EAC, a 4.5% increase over the Reference case level. For the DAC, the additional demand for renewable-powered electricity reaches 98 BkWh by 2050, a 3.3% increase over the Reference case.
Because high-quality wind resources are economically competitive and readily available in OECD Europe across all seasons and hours of the day, we expect growth in wind generation to be the predominant source of additional renewable-powered electricity, meeting 91% to 100% of additional renewable-powered electricity in OECD Europe by 2050 in the EAC and DAC. Between the EAC and the DAC, solar power serves a maximum of 6% of the additional renewable generation by 2050 (Figure 12). Hydropower and coal offer additional generation support to address grid reliability and transmission and distribution requirements.
The marginal power prices in OECD Europe increase slightly, and only in 2050, indicating that meeting these minimum generation targets are economically driven in most years rather than policy driven. However, the relatively high marginal costs associated with grid reliability, a result of the rising level of generation from intermittent resources, risk the ability to lower carbon dioxide emissions in both the EAC and DAC and contribute to a small decline in electricity consumption in some projection years by the residential and commercial sectors. This decline implies that grid reliability costs that are associated with additional renewable electricity generation could increase prices for the residential and commercial sectors in OECD Europe in both the EAC and DAC. The need for a small amount of additional hydropower generation (peaking at 52 BkWh in 2050 in EAC and 54 BkWh in 2050 in DAC) throughout the projection period and additional coal generation (peaking at 16 BkWh in 2025 in EAC and 17 BkWh in 2030 in DAC) in the near term in the EAC and DAC indicates that the growth in solar and wind generation alone is not feasible in OECD Europe without additional baseload generation support to stem grid reliability risks.
Figure 12.
Energy-related CO2 emissions
Both the EAC and DAC project reduced steel industry CO2 emissions (including indirect power generation emissions) compared with the Reference case (Figure 13). Generally speaking, in all four regions the EAC and DAC differ little from each other in the amounts of regional CO2 emissions. The two cases are very similar because they differ only in the timing of when electrolytic hydrogen (H2) reaches cost parity with H2 produced from fossil fuels. This 10-year difference affects the balance of natural gas and the renewable power employed to make hydrogen. This difference between the DAC and EAC is relatively small compared with overall steel industry CO2 emissions, which are dominated by coal for blast furnace production and, to a smaller degree, power drawn from the grid for running EAFs.
The decrease in CO2 emissions from the Reference case varies by region. This variability is caused by two factors. One, the assumed shift from BOF to EAF production dictates how much steel production moves away from the coal- and energy-intensive blast furnace process to the less energy-intensive EAF process. The increase in EAF production percentages in both scenarios relative to the Reference case is 12% for China, 24% for Japan, 34% for South Korea, and 23% for OECD Europe. Intuitively, the smaller 12% increase in EAF production in China relative to the Reference case affects its relative decrease in CO2emissions compared with the other three regions, which we assumed to have higher EAF growth.
The other important factor is the power generation profile of the region. We assume South Korea has a greater increase (34%) in EAF production than OECD Europe (23%) by 2050. Yet, OECD Europe’s decrease in CO2 emissions in the steel industry by 2050 (28% for the DAC and 31% for the EAC) relative to the Reference case is far greater than the corresponding decrease in South Korea’s CO2 emissions (19% for the DAC and 22% for the EAC). Renewable generation’s larger share in Europe’s power sector is the main reason for the larger CO2 emissions decrease in OECD Europe. Beyond the renewable power assumed to be used for the electrolytic H2 production and a portion of the EAF capacity growth, the alternative scenarios in this analysis still require growing power consumption from the grid, given their assumed increase in EAF production. Overall, regional power generation sources play a significant role in reducing CO2 emissions in these cases.
Figure 13.
The decarbonization of the steel industry in the four regions is reflected in the carbon intensities of their respective, evolving steel industries. The assumed rate of BOF-to-EAF conversion and the evolving overall generation mix of the region combine to produce the regional variations of carbon intensity (tons CO2 per ton of crude steel produced) of the alternative cases relative to the Reference case. In addition, as discussed previously, the timing for the onset of electrolytic H2 does to a lesser degree affect the final carbon intensity slightly.
Table 1. Carbon intensity of steel industry, select countries and regions
|
2020 | Reference case (2050) | Early Adoption case (2050) | Delayed Adoption case (2050) | |
|---|---|---|---|---|---|
| China | 2.07 | 1.43 | 1.23 | 1.27 | |
| Japan | 1.59 | 1.5 | 1.14 | 1.17 | |
| South Korea | 1.48 | 1.32 | 1.03 | 1.07 | |
| OECD Europe | 1.11 | 0.98 | 0.68 | 0.71 | |
Source: Created by the U.S. Energy Information Administration (EIA), based on data from EIA’s International Energy Outlook 2021 and from the World Steel Association’s 2021 World Steel in Figures |
|||||
Conclusion
The steel industry is a very carbon-intensive industry as a whole, but the recycled pathway employing EAFs is much less carbon- and energy-intensive than the primary production pathway (BF-BOF). Steel is already the most recycled material in the world, and efforts to reduce carbon intensity further in the steel industry will have to include even more recycling. But recycling has limits. Limitations of scrap availability and purity concerns for steel made from repeatedly recycled steel make other options necessary for producing high purity crude steel with low carbon-intensive processes.
To achieve these goals, in this analysis, we focused on increasing EAF production with renewable power and supplementing scrap steel feedstock with DRI made from electrolytic hydrogen powered by renewable sources. We quantified varying CO2 emissions reduction potentials in the steel industry for four regions by:
- Increasing the share of DRI used in the EAF feed (to reasonably compensate for the growing replacement of iron ore-based BF-BOF virgin steel with scrap-based EAF recycled steel)
- Increasing the renewable hydrogen (H2) employed in DRI production
- Increasing the renewable power used for EAFs
For example, we discovered that a resulting decrease in emissions intensity in the EAC of 22% requires 27% more renewable power generation by 2050 compared with the Reference case in one region (South Korea), while a decrease in carbon intensity of over 30% in OECD Europe requires only a 5% increase in renewable power generation compared with the Reference case. Such variability in required additional renewable power for the steel industry is the result of the broader generation mix of the respective regions.
Although we did not go into the details regarding H2 production, transportation, storage, or distribution, we have illustrated that a partial decarbonization of the steel industry—which resulted in a 14% (China), 24% (Japan), 22% (South Korea), and 31% (OECD Europe) reduction of carbon intensity for crude steel production from 2050 Reference case levels—requires investments in both the steel production process itself as well as in renewable power generation. In the future, we will examine the hydrogen economy more broadly and will include H2 production as an integrated part of the industrial sector and overall energy economy.
Footnotes
- International Energy Outlook 2021 regional definitions
- The Future of Hydrogen, IEA, June 2019.
- Steel Statistical Yearbook 2020 Concise Version. World Steel Association. November 2020.
- 2050 Carbon Neutral Strategy of the Republic of Korea, Government of the Republic of Korea, December 2020. Achieving Net Zero GHG Emissions by 2050 in Japan, Ministry of the Environment, Japan, February 2021.
- For example, Japan’s Nippon Steel recently committed to expanding hydrogen capability toward decarbonizing steel production. https://www.argusmedia.com/en/news/2201033-japans-nippon-steel-eyes-eaf-hydrogen-to-decarbonise
- https://www.iea.org/policies/6566-korea-hydrogen-economy-roadmap-2040
- https://ihsmarkit.com/research-analysis/south-korean-conglomerates-to-invest-38-billion-to-boost-hydro.html
- Steel Statistical Yearbook 2020 Concise Version. World Steel Association. November 2020.
- https://www.cleanenergywire.org/news/germany-spend-additional-5-bln-euros-decarbonising-steel-industry