Global oil markets
Global oil prices
The Brent crude oil spot price increased to an average of $91 per barrel (b) in August, $7/b higher than in July. Global crude oil prices rose in August as total exports out of the Middle East remained constrained, leading to more oil production shut-ins in the region. This is due, in part, to the renewal of the U.S. blockade on Iran’s oil exports following Iran’s attacks on tankers in the Strait of Hormuz, as well as because of a new rounds of sanctions from the Treasury Department’s Office of Foreign Assets Control against Iranian economic and oil interests. We expect these policies to restrict Iran’s oil exports and reduce its oil production.
In addition, attacks on Saudi Arabia’s oil exports through the Bab el-Mandeb strait, a major world oil transit chokepoint, reduced oil exports departing from Saudi Arabia’s Yanbu port on the Red Sea, a route which bypasses the Strait of Hormuz. In August, exports out of Yanbu were down by about half from July, according to estimates from Vortexa. In response, Saudi Arabia has increased oil shipments through the Suez Canal at the north end of the Red Sea, a longer and costlier route for customers in Asia. Although Saudi Arabia has also reportedly begun to use a series of ship-to-ship transfers outside of the Persian Gulf, we expect that the constrained Red Sea shipping channel will limit Saudi Arabia’s supply in the near term until global shipping flows adjust.
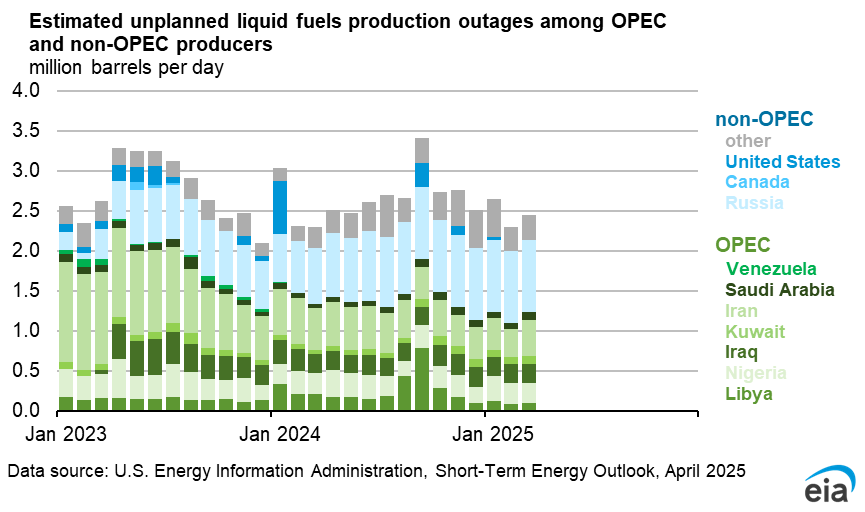
As flows through the Strait of Hormuz and the Bab el-Mandeb strait remain constrained and variable, crude oil production shut-ins rose over the past month. We assess that crude oil production shut-ins averaged 6.7 million barrels per day (b/d) in August, up from 5.0 million b/d in July. We assume that oil flows from the Middle East remain constrained through the fourth quarter of 2026 (4Q26), leading to shut-in production volumes averaging 5.7 million b/d during that quarter.
Although we raised our forecast for production disruptions in coming months, we expect oil flows out of the Middle East will gradually increase as shippers continue to find workarounds that allow them to export oil from the Middle East: using pipeline and overland bypass routes, increasing ship-to-ship transfers, and using new bypass pipeline capacity in the United Arab Emirates, expected to come online in mid-2027. If these assumptions hold, we expect it will take until 2Q27 for most production and trade flows to return to pre-conflict averages. We anticipate, however, that some producers around the Persian Gulf will not be able to bring oil output back to pre-conflict averages during the forecast period.
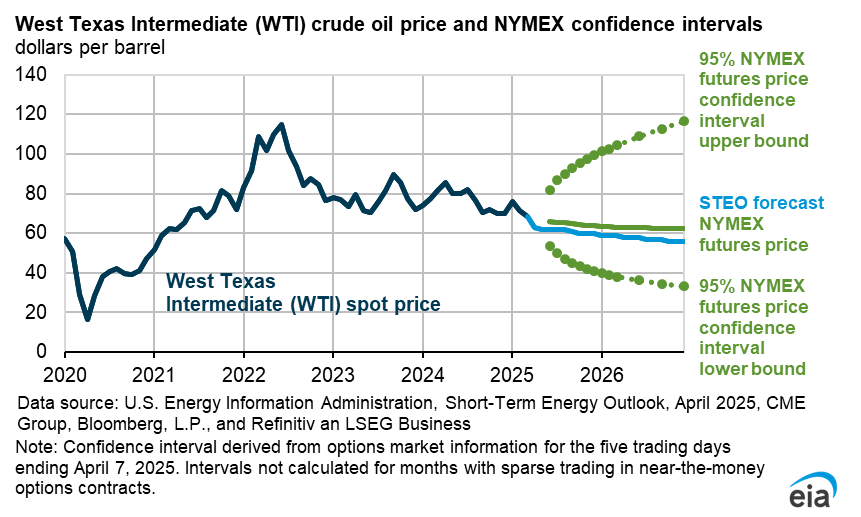
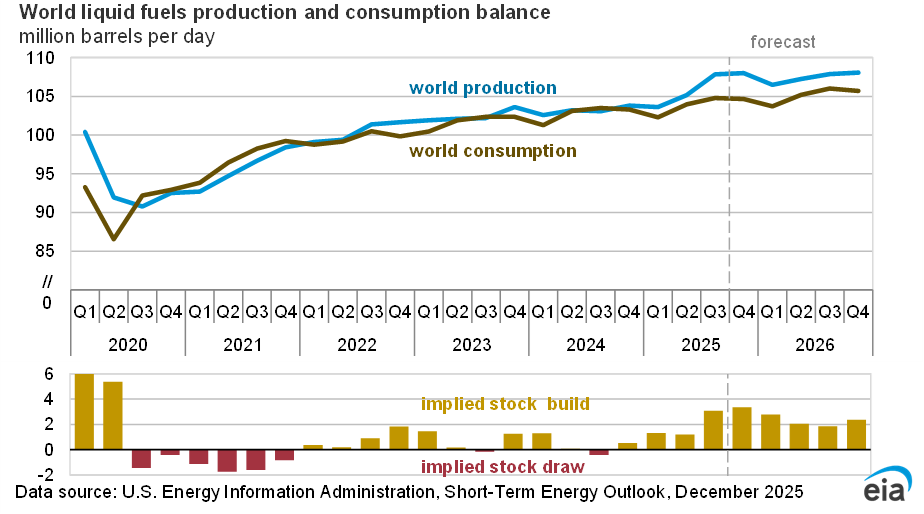
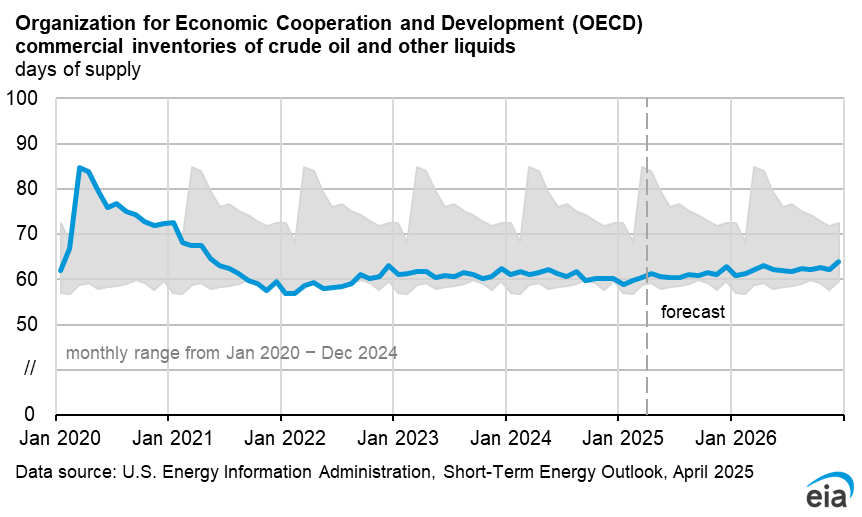
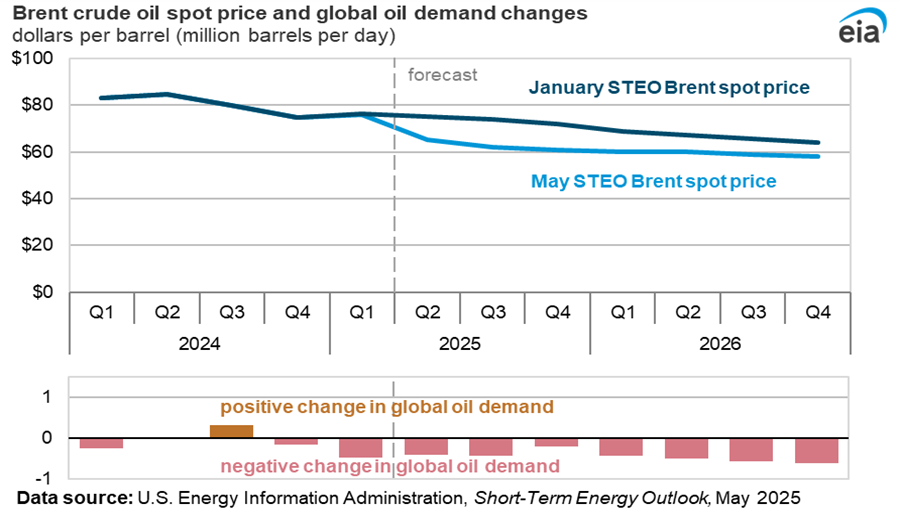
Because of the large drawdown in global inventories driven by continued disruptions of crude oil production, we forecast that oil prices will remain elevated until global oil flows return to normal and oil inventories can be replenished. We estimate that global oil inventories fell by an average of 3.9 million b/d in 2Q26 and that they will fall by an additional 3.0 million b/d on average in 3Q26 and 1.7 million b/d on average in 4Q26. As a result, we forecast the Brent crude oil spot price will average around $90/b in the second half of 2026 (2H26), $8/b higher than in last month’s STEO.
As exports from the Middle East gradually increase and shut-in oil production restarts, we forecast oil prices will begin to fall, decreasing to an average of $77/b by 2Q27. We assess that most shut-in oil production will be largely restored in 2H27 and that global oil inventories will again start building, gradually lowering oil prices to an average of $67/b in 2H27, similar to last month’s STEO. However, we expect continued volatility in flows both through the Strait of Hormuz and through alternative routes based on changing conditions in the conflict, which will likely lead to more volatility in short-term price movements than our forecast indicates.