Global oil markets
Global oil prices and inventories
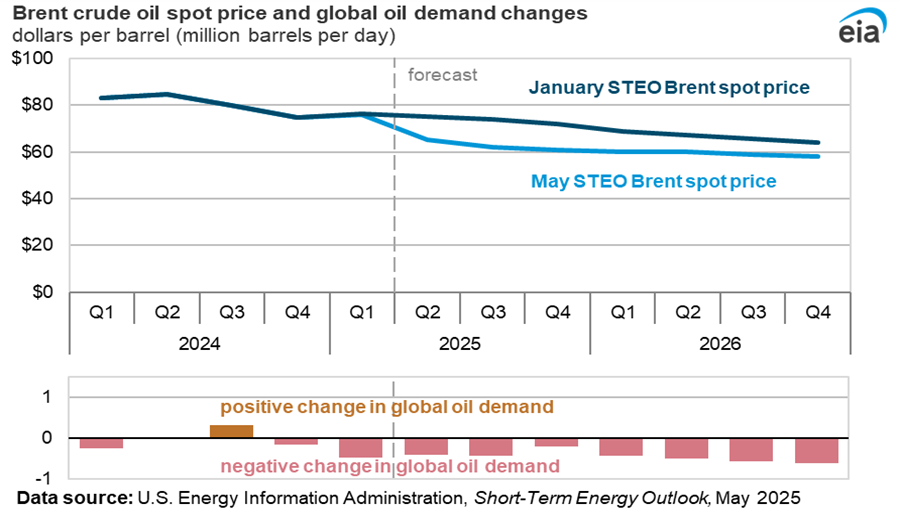
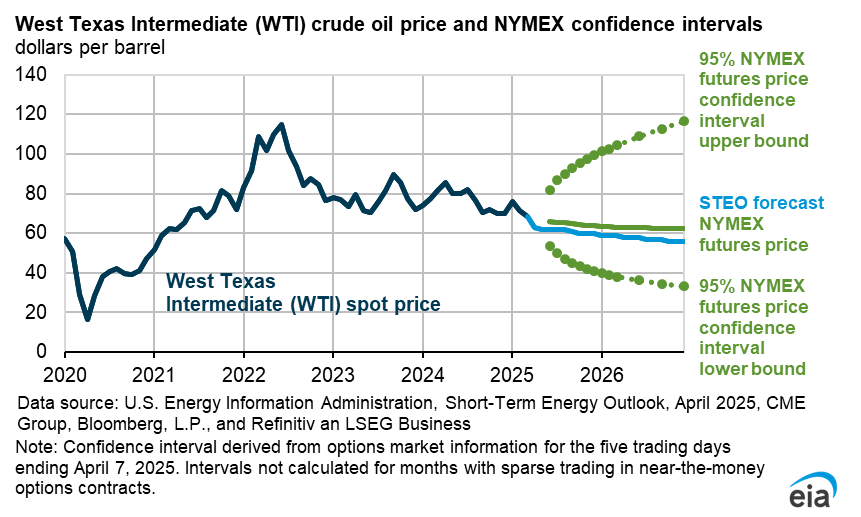
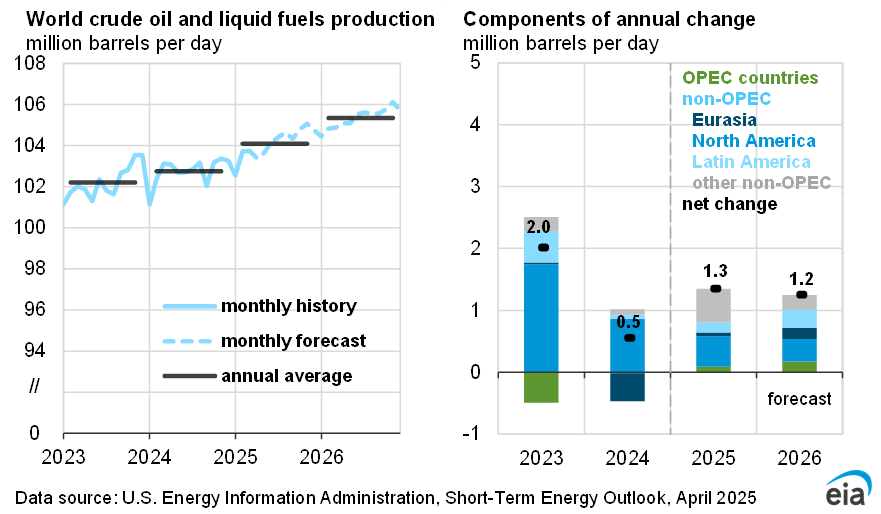
Global oil markets remain in a period of heightened volatility and uncertainty as the de facto closure of the Strait of Hormuz, a major world oil transit chokepoint, has now surpassed three months. Shipping traffic through the strait has been extremely limited since military action began on February 28. The Brent crude oil spot price averaged $107 per barrel (b) in May, $10/b lower than the average in April, the first monthly average decline in prices since December 2025. Although oil price volatility remains elevated, prices fell in May as numerous reports surfaced that the United States and Iran were nearing an agreement to extend the existing ceasefire and re-open the Strait of Hormuz pending future negotiations. As of this writing, the agreement has not been finalized. Most oil production in the region remains shut-in, and global oil inventories have continued to fall to meet demand.
Although ships have occasionally transited the strait over the past month, for the purposes of this forecast, we assume that the Strait of Hormuz will remain effectively closed into early summer, with flows slowly starting to resume in the third quarter of 2026 (3Q26). If flows resume within this timeframe, we expect it will take until early 2027 for production and trade patterns to generally return to pre-conflict status, and we anticipate that some producers around the Persian Gulf will not be able to bring oil output back to pre-conflict levels during the STEO forecast period.
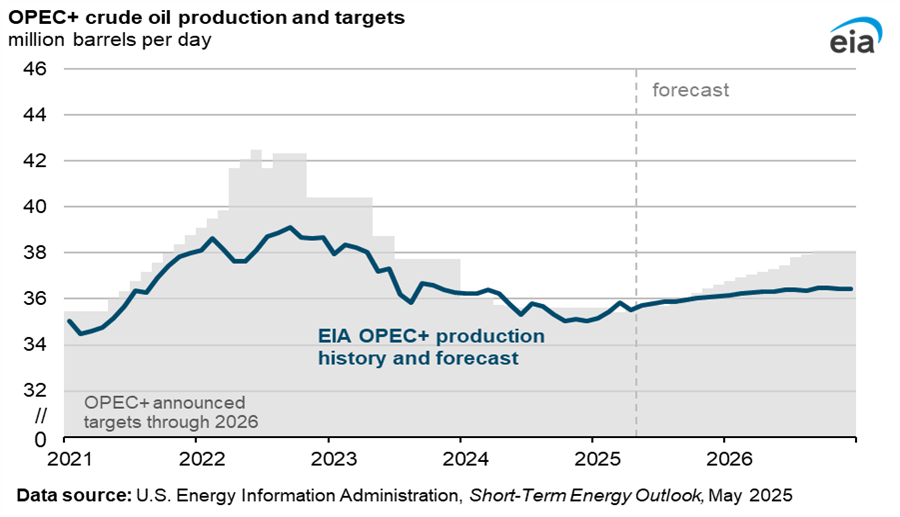
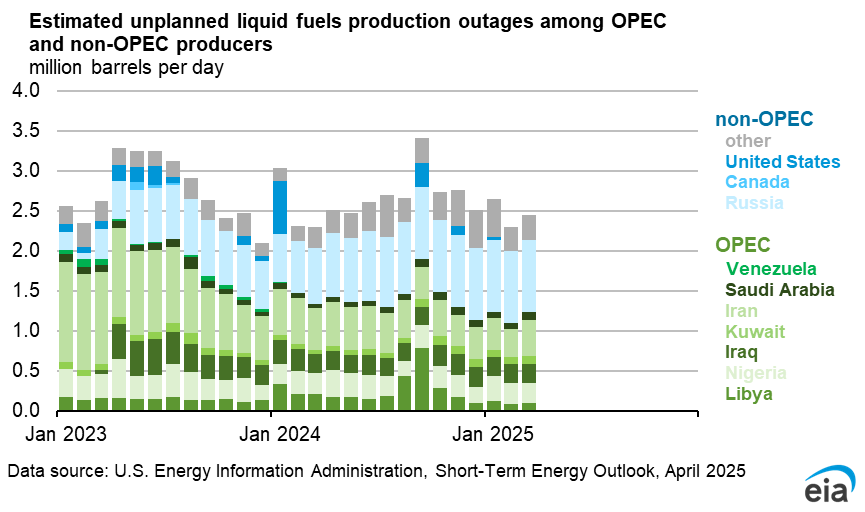
Disrupted crude oil production volumes in the Middle East increased last month. We assess that production shut-ins averaged 11.3 million barrels per day (b/d) in May, and we expect they will continue to rise through 2Q26 as storage levels, particularly in Iran, reach maximum limits, requiring producers to shut in additional volumes as the closure of the strait persists.
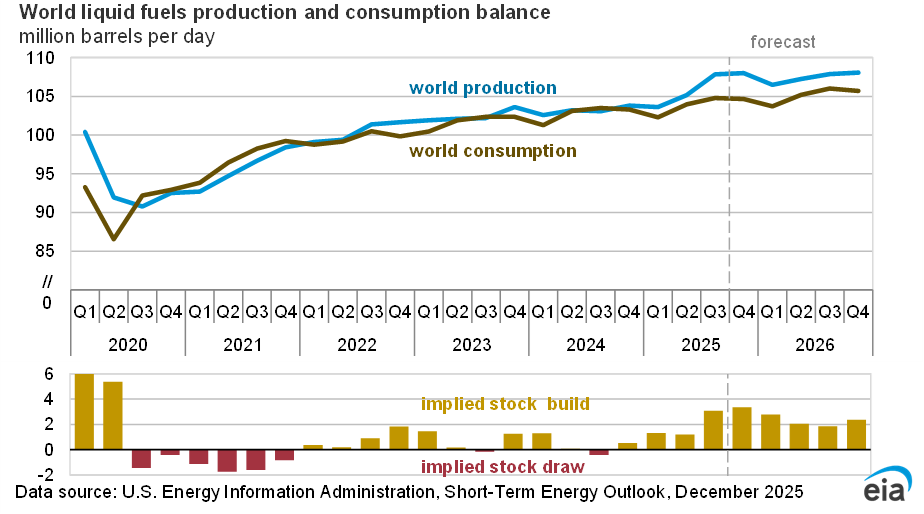
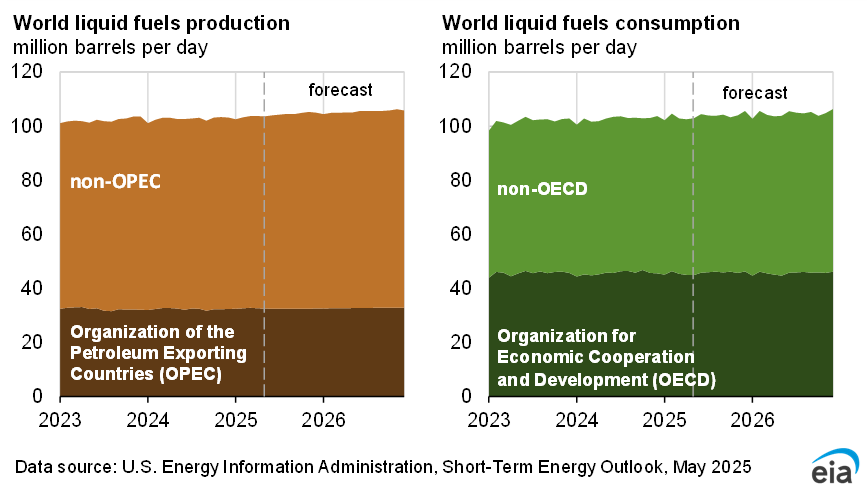
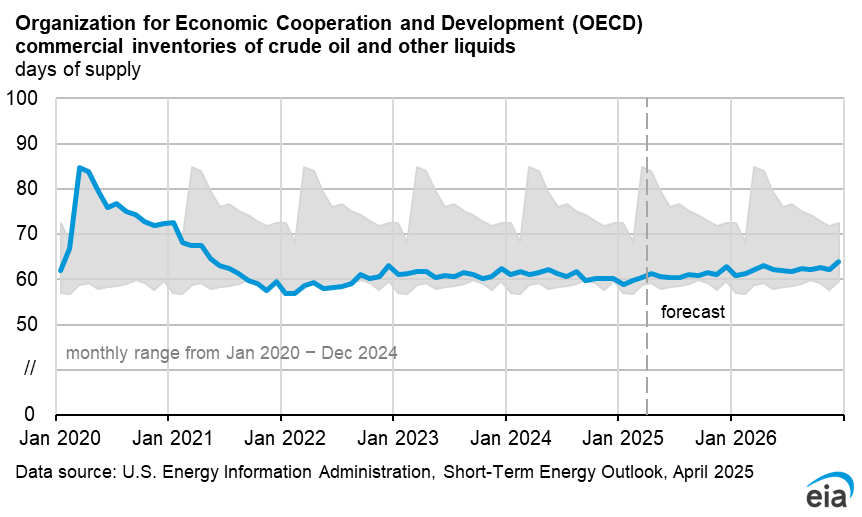
Prior to the conflict, we assessed the market was well positioned to weather a short-term disruption to oil flows as a result of months of global oversupply and global oil inventory builds in on-land and floating storage. As the conflict and disruption to oil supplies have persisted, global oil inventories have increasingly met demand. Based on our assumptions around the reopening of the Strait of Hormuz and the gradual resumption of oil trade flows, we now forecast total liquid fuels inventories in the Organization for Economic Cooperation and Development (OECD) will fall to just under 2.3 billion barrels by December 2026, which would be the lowest level since 2003, when our dataset begins, and well below the previous five-year average (2021‒2025) of 2.8 billion barrels.
On a days-of-supply basis, which considers how many days of future demand current inventory levels can meet, we now expect OECD inventories to fall to a low of 50 days by the end of 2026, which would be the fewest days of future demand cover since January 2003, when our dataset begins. Furthermore, we do not expect OECD inventories will return to pre-conflict levels during the STEO forecast period. Prior to the onset of the conflict, in our February STEO, we expected that OECD oil inventories would continue to build over the forecast, reaching some of their highest levels since the recovery from the COVID-19 pandemic in early 2021, at more than 70 days of future demand cover.
Because of the size of the drawdown in global inventories, we forecast that oil prices will remain elevated until global oil flows return to normal levels and oil inventories are replenished. We estimate that global oil inventories will fall by an average of 6.3 million b/d in 2Q26, and we forecast the Brent crude oil spot price will average around $105/b in June and July. Once the traffic through the Strait of Hormuz gradually begins to resume and shut-in oil production increasingly restarts, we assume oil prices will begin to fall, decreasing to an average of $89/b by 4Q26. We assess that most shut-in oil production will be fully restored in 1Q27 and that global oil inventories will again start building, gradually lowering oil prices to an average of $79/b in 2027.
Global oil consumption
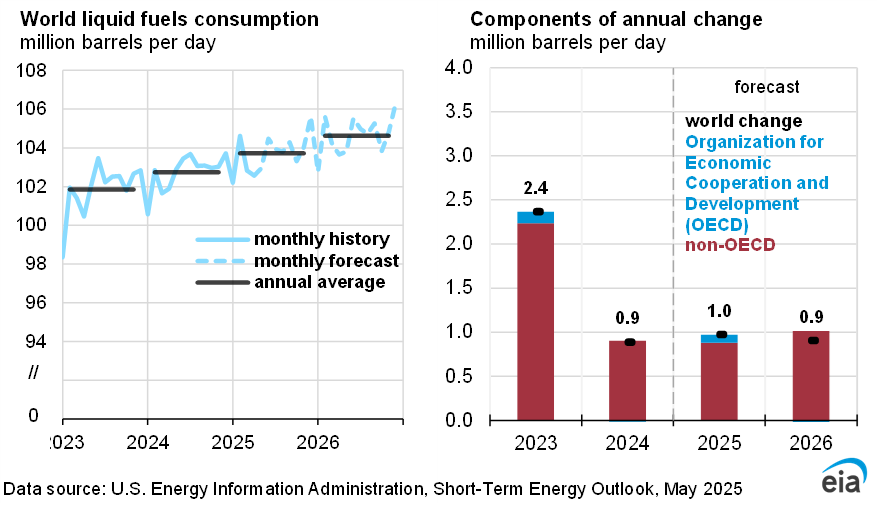
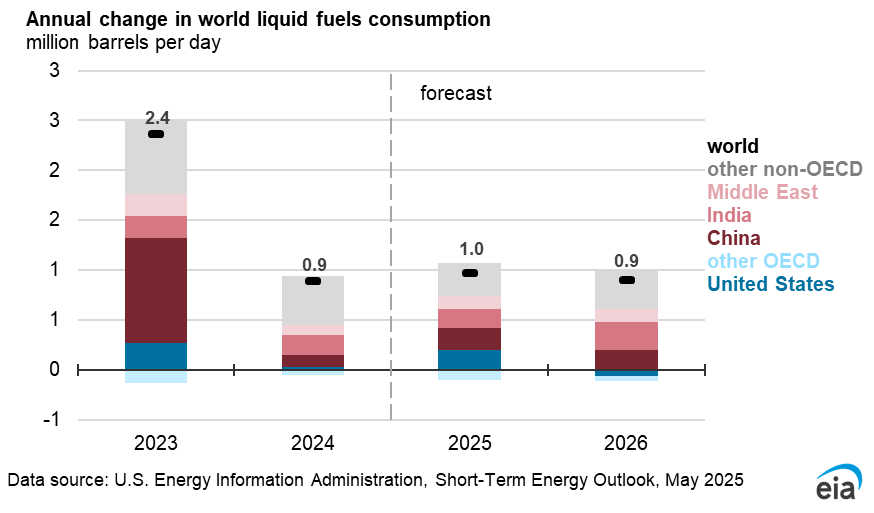
We expect high fuel prices, a reduction in fuel availability, and government initiatives have reduced oil demand. The reduction in demand has helped limit global oil inventory draws despite the loss in supply. We have reduced our expectations around global oil demand growth, based on reports of government initiatives to reduce fuel use, fuel shortages, and the curtailing of refined oil product exports.
Most of the reduction in demand is in Asia, which receives more crude oil supplies from the Middle East. Although timely data on demand is limited, particularly for countries in Asia that have been the most affected by the closure of the Strait of Hormuz, what data are available suggest demand has fallen by more than we previously thought. As a result, we now forecast that global oil demand will decrease by an average of 1.1 million b/d in 2026, compared with our expectation last month for 0.2 million b/d growth in oil demand and our February forecast for growth of 1.2 million b/d. We assume oil demand will rebound next year once prices drop and supply flows return later in 2026, with oil demand growing by 2.5 million b/d in 2027 to 105.3 million b/d.
We assess oil demand is likely to fall further the longer the conflict persists. If the drop in oil demand continues to outpace our expectations, it could further limit oil price increases.
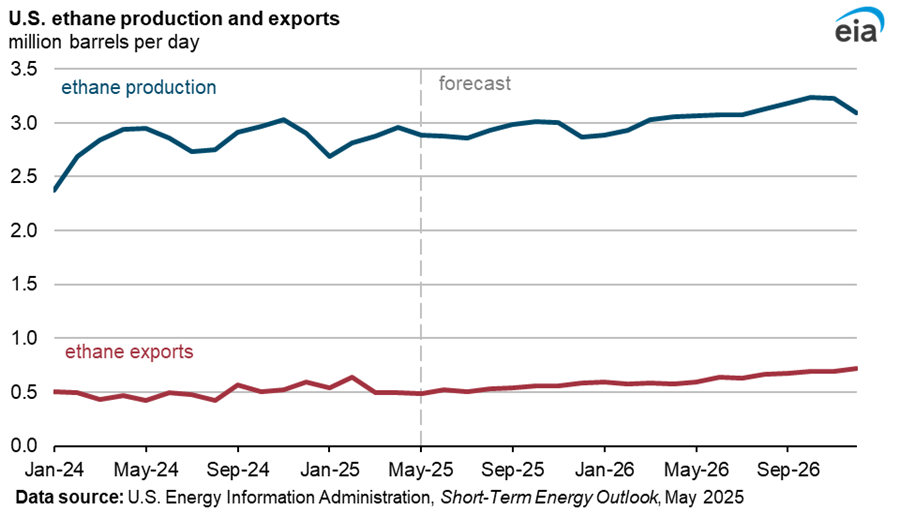
In addition, some Asian countries are among the largest consumers of hydrocarbon gas liquids (HGL) for petrochemical feedstocks, which could be a significant source of lost oil demand but is not as visible or reported as transportation fuel demand. As we continue to gather the latest global oil demand data and trends, our future forecasts and assumptions around global oil balances are subject to change.