Release Date: June 6, 2023
STEO Between the Lines:Uncoupling diesel consumption and economic growth
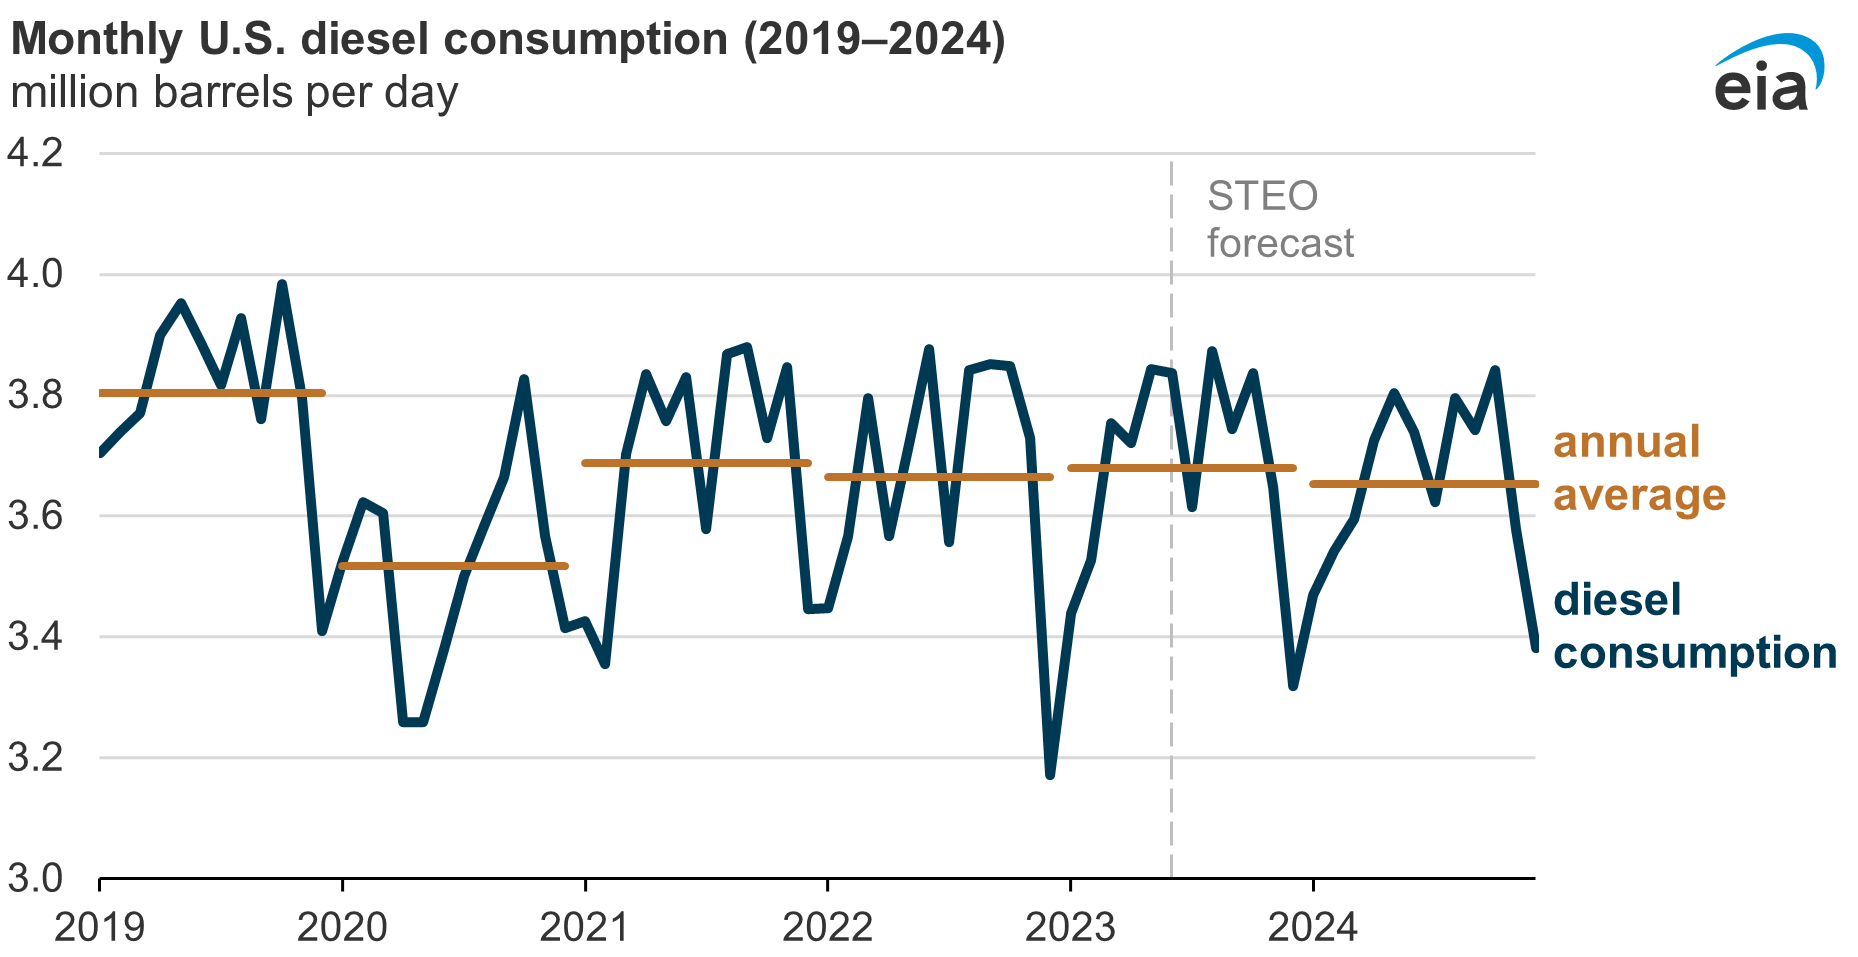
The historical relationship between U.S. diesel consumption and economic growth appears to be shifting. U.S. diesel consumption declined in the first quarter of 2023 (1Q23) compared with the same time last year, a period of economic growth. Historically, GDP and manufacturing production are positively correlated, along with diesel demand, which is associated with trucking manufactured goods throughout the country. Recently, service sector production has been the primary driver of GDP growth, which requires less diesel consumption. We expect this trend to continue; we forecast in our STEO that U.S. diesel consumption in the second half of 2023 will be below the 2015−2019 average before a slight further decline in 2024 despite an expected increase in GDP over the same periods.
Data values: Distillate fuel oil consumption
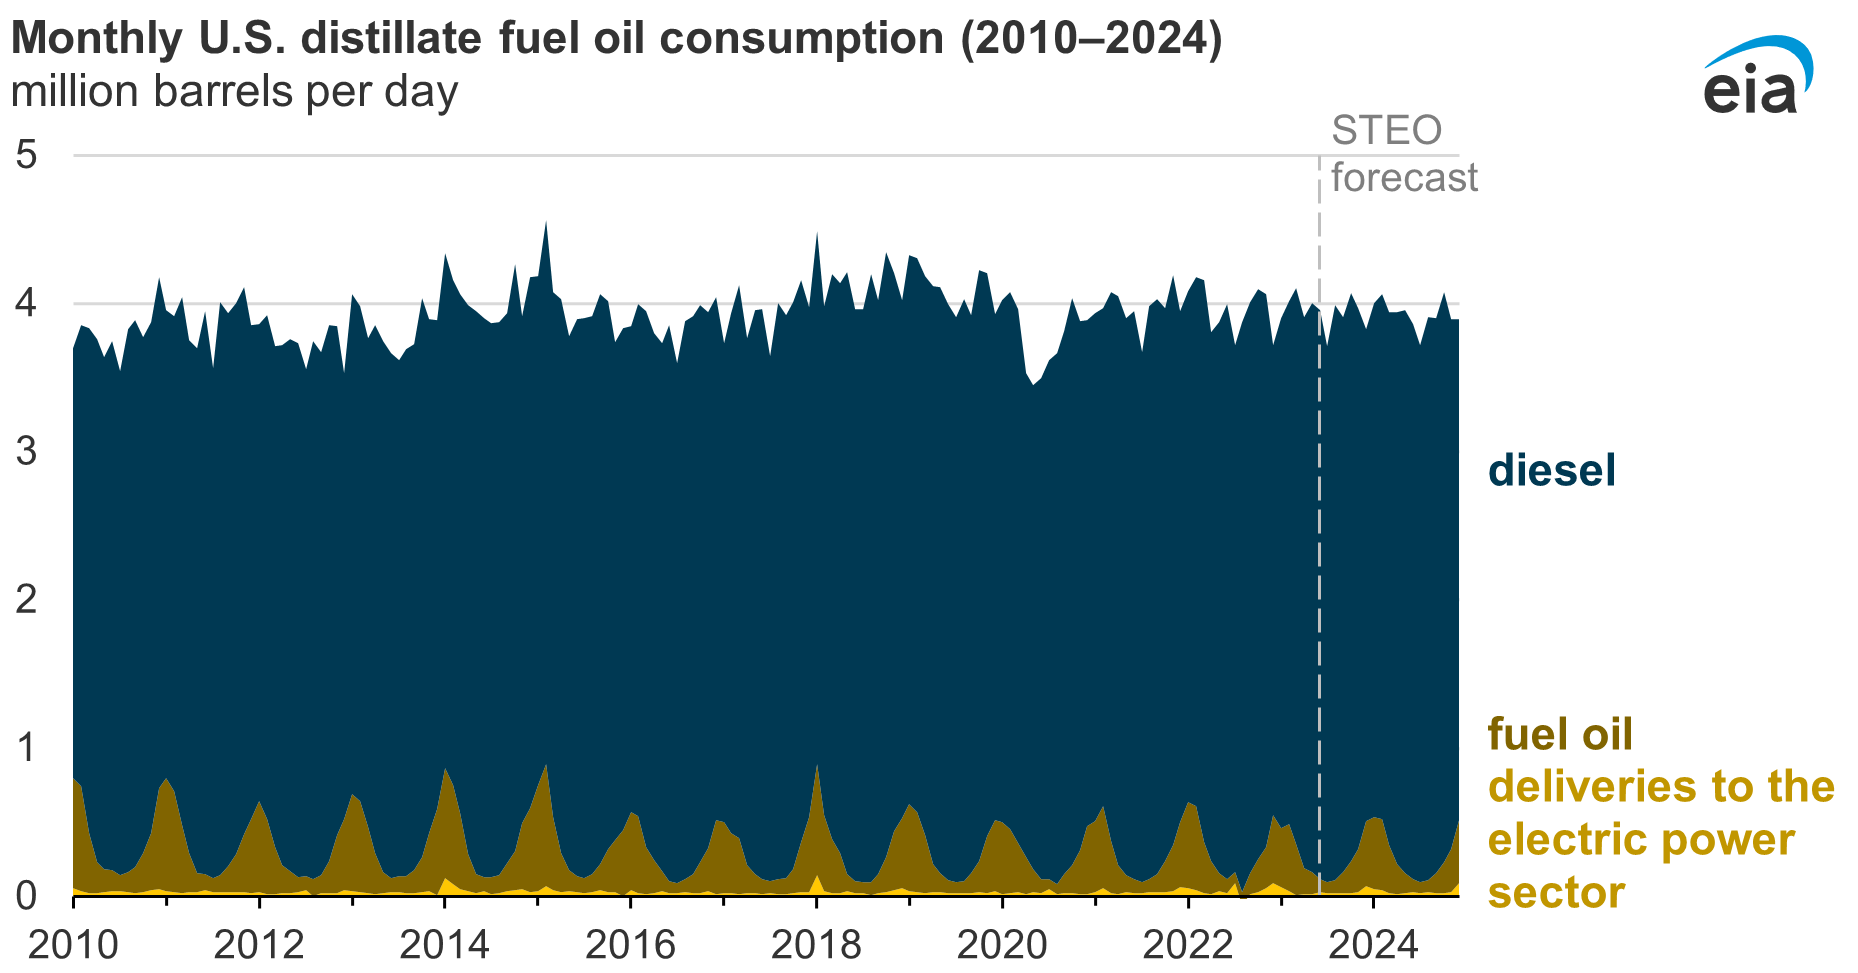
In the United States, diesel fuel makes up the largest share of the broader category of distillate fuel oil consumption. Between 2015 and 2020, (the most recent year for end-use estimates of U.S. distillate consumption), on-highway diesel accounted for about two-thirds of distillate consumption in the United States, and trucking makes up the largest share of on-highway consumption. The next most-common use of distillate fuel is as fuel oil (also known as heating oil) for heating residential and commercial buildings. U.S. fuel oil consumption is largely driven by weather patterns rather than economic activity, so we exclude it from this analysis.
Data values: Distillate fuel oil consumption
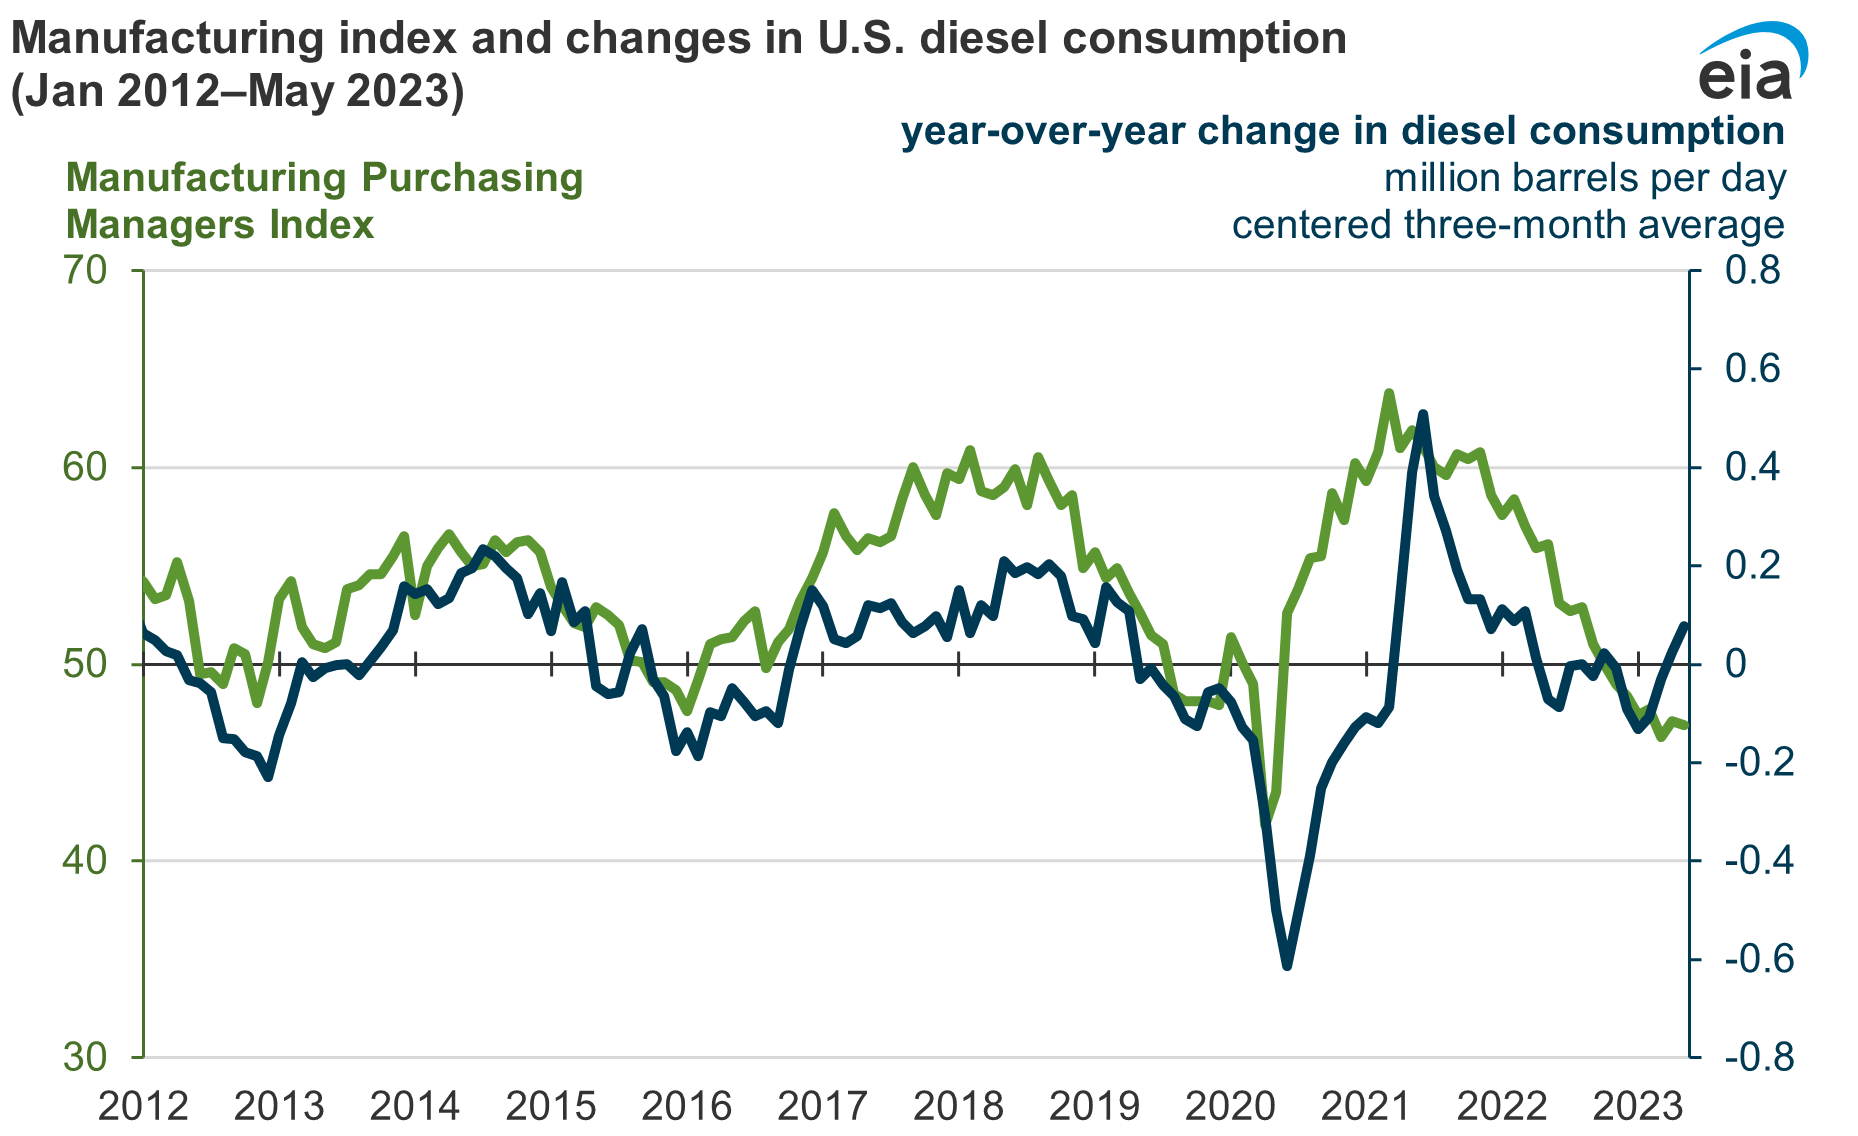
Our STEO model uses GDP and a distillate-weighted manufacturing index as the primary inputs for the U.S. diesel fuel consumption forecast. We also look at more specific indicators of manufacturing activity, purchases of physical goods, and freight transportation to validate our modeling results. When manufacturing activity expands, diesel is consumed to transport those physical goods from producers to consumers. The Institute for Supply Management’s Manufacturing Purchasing Managers Index (PMI), a survey of U.S. purchasing and supply executives, has slowed from an index value of 63.8 in March 2021 to less than 50 since November 2022 (index values below 50 represent declining manufacturing activity). Changes in U.S. diesel consumption tend to follow changes in this index’s measure of manufacturing activity.
Data values: Distillate fuel oil consumption
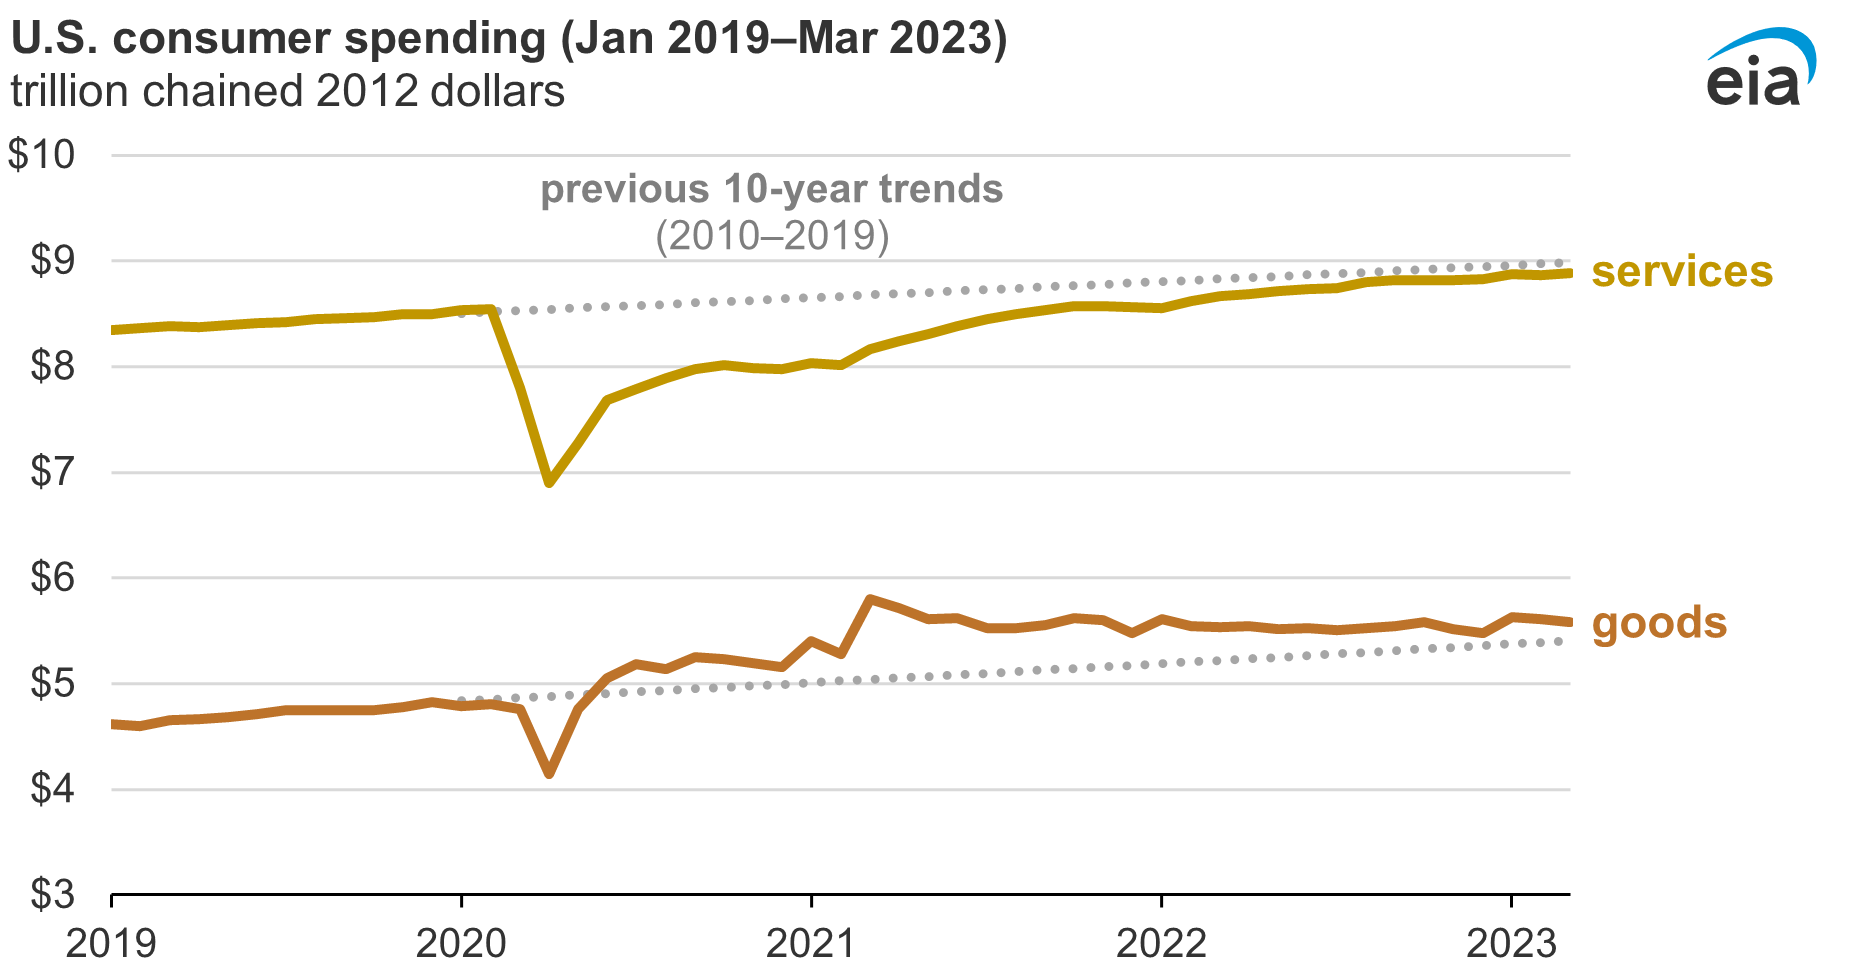
From mid-2020, during the most restrictive pandemic-related measures, through late 2022, U.S. GDP grew at an average annualized rate of 6.1% per quarter. From mid-2020 to 1Q21, growth was partially driven by increases in consumer spending, particularly on goods. During this period, spending on services, such as retail trade or accommodation and food services, was lessened due to behaviors and policies aimed at reducing the spread of COVID-19. As a result, the share of consumer spending on manufactured goods increased, which supported trucking activity and diesel consumption.
Since 2Q21, this trend has reversed. Spending on services in 1Q23 increased 10% compared to 1Q21 while spending on goods increased only 2% over the same period. This shift supported growth in U.S. GDP even as manufacturing activity started to decline. Going forward, we expect this trend to continue and GDP to increase by 1.3% in 2023, while the distillate-weighted manufacturing index declines by 1.1%.
Data values: U.S. real personal consumption expenditures by type of product
Less consumer spending on goods has reduced new orders and increased business inventories. The U.S. Census Bureau’s inventory-to-sales ratio, a measure of how fast retailers can sell their merchandise, grew over the last year, suggesting retailers are holding more inventories. As a result, manufacturing activity and overseas goods imports have declined because retailers have enough inventory to satisfy demand. In addition, manufacturers’ new orders have been declining since June 2022, an indication that reduced demand may continue for the next several months.
Fewer orders for goods reduce the need for freight transport. The American Trucking Associations’ Truck Tonnage Index, a survey measuring the total tonnage transported by contract freight carriers for a given month, recently reached its lowest level since September 2021. Similarly, rail traffic data from the Association of American Railroads shows 11% less intermodal rail activity (the long-haul movement of shipping containers and truck trailers by rail) in 2023 than in 2022.
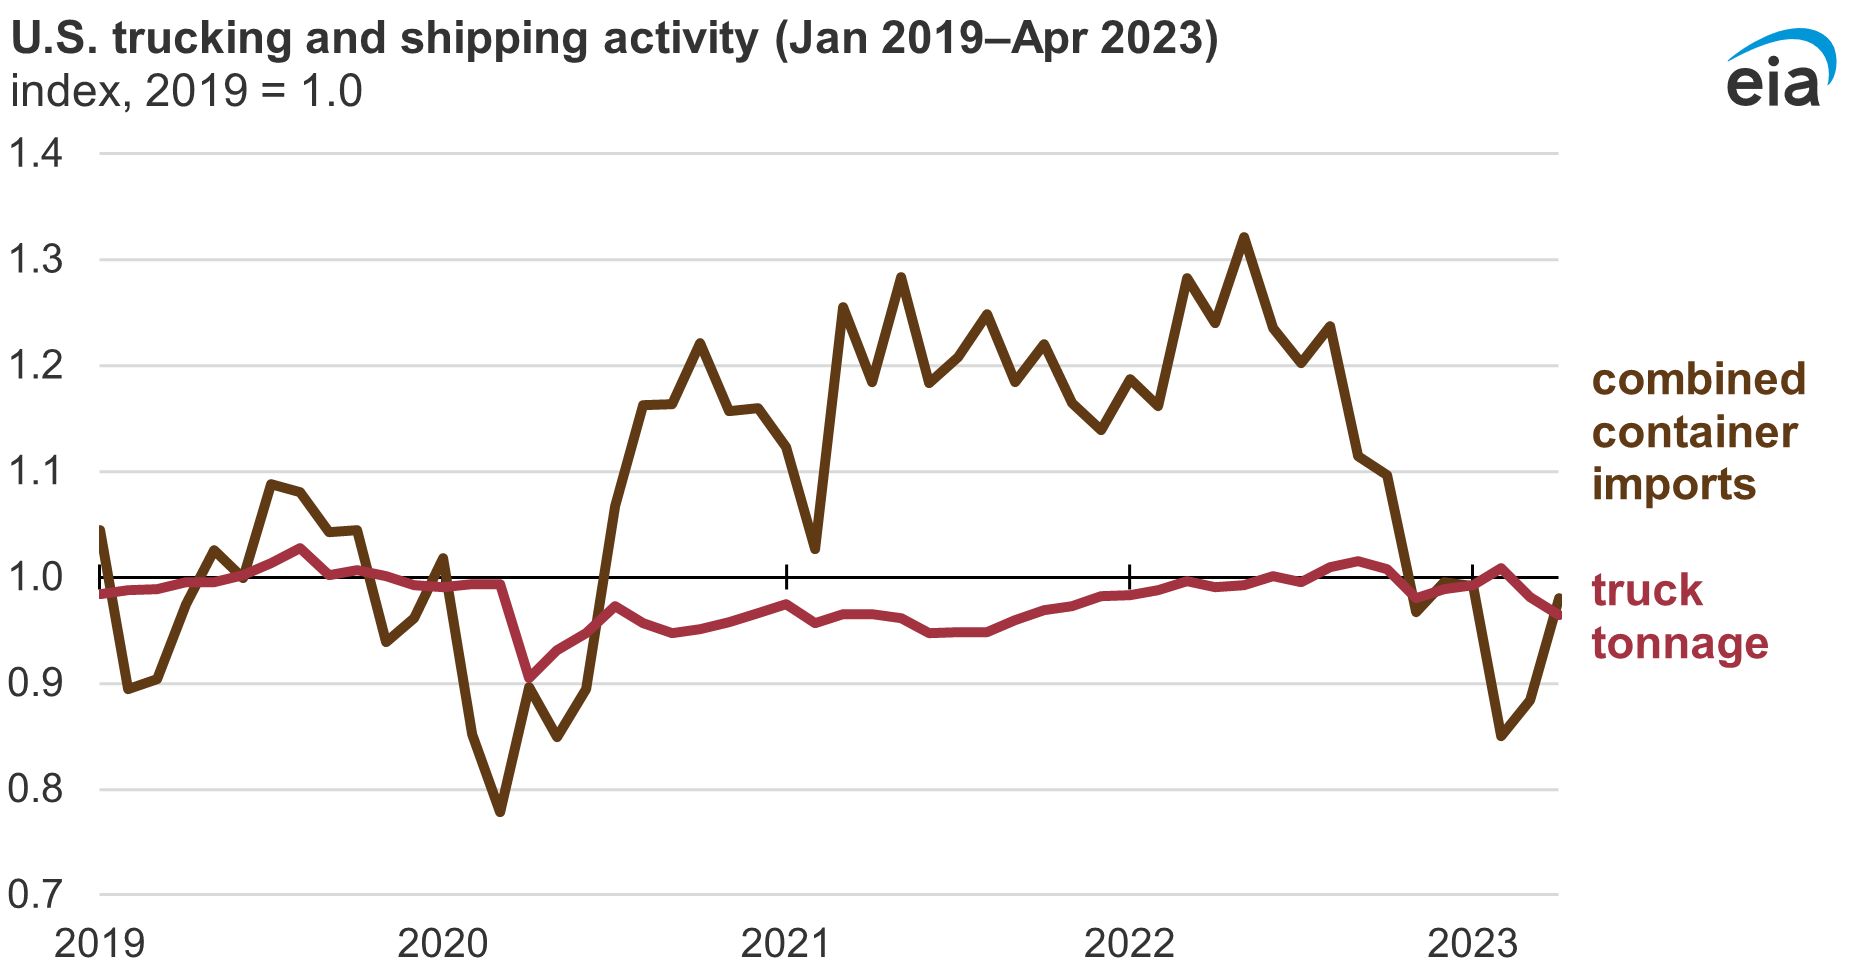
Data values: Truck Tonnage Index
Note: Combined container imports are 20-foot equivalent units at Los Angeles, Long Beach, Oakland, Seattle, Houston, Savannah, Charleston, Virginia, New York, and New Jersey. The trucking index is seasonally adjusted.
Although we expect U.S. GDP to grow over the next 18 months, downward trends in transportation and manufacturing indicators contribute to our lower U.S. diesel consumption forecast relative to 2022. We are uncertain about several factors in our forecast including future GDP growth and employment. Our forecast assumes that the Federal Reserve’s interest rate increases will slow inflation without causing major disruptions to U.S. employment or economic activity. If GDP growth does decline, we could see a further slowdown in U.S. diesel consumption. On the other hand, if the outlook for the manufacturing sector improves, our diesel consumption forecast could be adjusted upward, even in the event of a deteriorating GDP forecast.