Natural gas prices in 2017 and 2018 are expected to be higher than last year
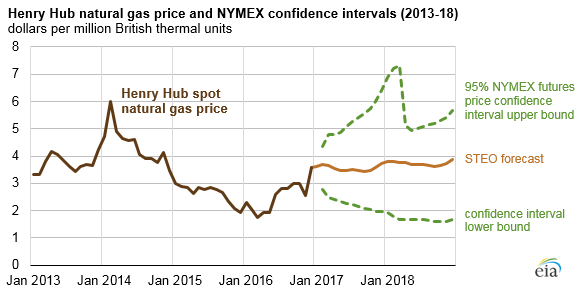
Note: Confidence intervals derived from options market information for the five trading days ending Jan 5, 2017. Intervals were not calculated for months with sparse trading in near-the-money options contracts.
In its January 2017 Short-Term Energy Outlook (STEO), EIA expects the Henry Hub natural gas spot price to average $3.55 per million British thermal units (MMBtu) in 2017 and $3.73/MMBtu in 2018, both higher than the 2016 average of $2.51/MMBtu. Higher prices in 2017 and 2018 reflect natural gas consumption and exports exceeding supply and imports, leading to lower average inventory levels.
The confidence interval range for natural gas prices is a market-derived range that reflects trading in New York Mercantile Exchange (NYMEX) futures markets and is not directly based on EIA's supply and demand estimates. The values for the upper confidence interval increase during the winter months compared with the rest of the year, which reflects the higher probability of an increase in natural gas consumption for space heating use as a result of colder weather. By February 2018, the 95% confidence interval ranges from $1.78/MMBtu to $7.22/MMBtu.
In 2016, the annual average Henry Hub natural gas price was the lowest since 1999 as a result of a very mild winter that left natural gas inventories at a record high for the end of March. However, high natural gas use for electricity generation during the summer and declining production contributed to Henry Hub natural gas prices rising from an average of $2.00/MMBtu in the first quarter of 2016 to an average of $2.88/MMBtu in the third quarter of 2016. Cold weather across much of the northern United States in mid-December led to an increase in demand for space heating (much of which is provided by natural gas), contributing to natural gas inventories ending the month below the five-year average. As a result, Henry Hub spot prices increased to a monthly average of $3.59/MMBtu in December, the first month in which prices averaged above $3.00/MMBtu since December 2014.
In 2017, Henry Hub prices are expected to remain near the levels in December 2016, leaving annual average prices in 2017 higher than those in 2016. Prices are expected to be higher again in 2018. The higher prices are the result of forecasted consumption and exports exceeding forecasted production and imports, which implies that the difference will be supplied from inventories. Because natural gas use for space heating in the residential and commercial sectors depends significantly on winter weather, any significant discrepancy between weather assumptions used in the forecast and actual weather could significantly affect both consumption and prices.
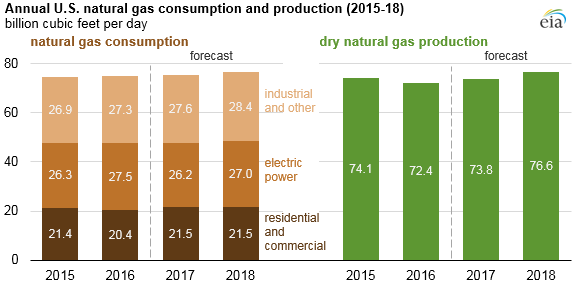
EIA expects natural gas consumption to be higher in 2017 and 2018 than in 2016, based on a return to more typical winter temperatures. In 2017, use of natural gas for electric power generation is expected to decline from the record level in 2016 because of higher natural gas prices. Natural gas-fired power generation is forecast to rise in 2018 because of overall growth in electricity generation, but it is expected to remain below the 2016 level.
After declining in 2016 for the first time since 2005, dry natural gas production is forecast to increase in both 2017 and 2018. The return to increasing production reflects a forecast of higher Henry Hub natural gas spot prices as well as pipeline infrastructure buildout, particularly in the Marcellus and Utica natural gas producing regions in and around Ohio and Pennsylvania.
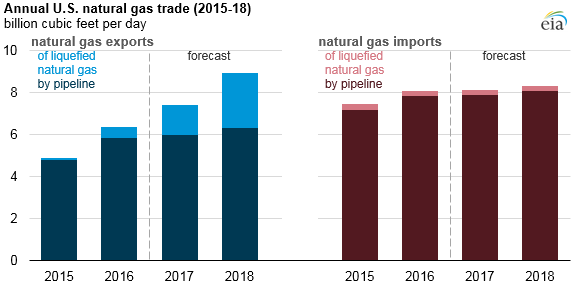
Natural gas exports are also expected to increase. Export growth in 2017 largely reflects additional capacity coming online at Cheniere’s Sabine Pass liquefied natural gas (LNG) liquefaction plant in Louisiana. The 2018 growth is driven by the expected start of Cove Point LNG in Maryland in December 2017 and new projects at Cameron LNG and Freeport LNG on the U.S. Gulf Coast during the second half of 2018. A small increase in pipeline exports to Mexico is expected in both years.
Imports of natural gas are expected to remain relatively stable over the forecast period at slightly more than 8 Bcf/d. With expected growth in exports and stable import levels, the United States is expected to become a net exporter of natural gas on an annual basis in 2018.
Principal contributor: Tim Hess