Natural gas-fired electricity generation expected to reach record level in 2016
Republished August 15, 2016, 10:30 a.m. to correct the projected date when natural gas-fired electricity generation surpasses coal-fired generation.
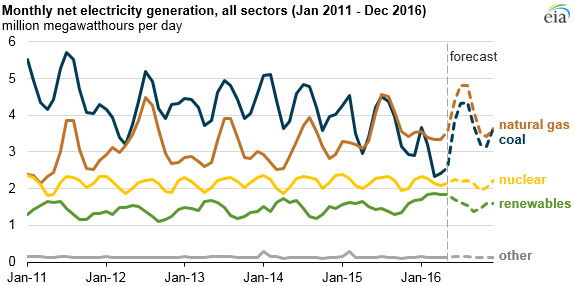
Natural gas-fired electricity generation in the United States is expected to reach a record level this year, providing an average of 3.8 million megawatthours per day in 2016, or 4% higher than in 2015. Based on EIA's latest Short-Term Energy Outlook (STEO), monthly natural gas-fired generation is expected to reach record highs in July and August, when weather-related demand for air conditioning increases electricity demand.
Natural gas had long been the second-most prevalent fuel for electricity generation behind coal. Natural gas-fired generation first surpassed coal generation on a monthly basis in April 2015. Natural gas-fired generation has surpassed coal-fired generation in most months since then and is expected to continue to exceed coal generation through the remainder of the year, ultimately providing 34% of the United States's electricity generated this year. Coal's share of the 2016 U.S. electricity generating mix is expected to be 30%, nuclear, 19%, and renewables, 15%.
Notably, the natural gas share of power generation is expected to decline for several years after 2016 as it competes with renewables and as natural gas prices rise. In EIA's Annual Energy Outlook 2016 Reference case, the natural gas generation share falls until about 2020, then climbs steadily over the next two decades. Natural gas is projected to regain the largest share in the electricity mix by 2024 and maintain that position through 2040.
Forecasted electricity demand is sensitive to weather predictions. The National Oceanic and Atmospheric Administration (NOAA) expects that the summer of 2016 (April through September) will have about as many cooling degree days as the summer of 2015. Cooling degree days reflect the population-weighted temperature difference from a base temperature of 65 degrees Fahrenheit. Nationally, the number of cooling degree days is expected to reach a high of about 360 in July 2016, or about 10% lower than the monthly record of 404 cooling degree days set in July 2011.
As temperatures increase, demand for air conditioning increases. Much of that increase in electricity demand is met by natural gas-fired generation. On a monthly average basis, each increase of 1 degree Fahrenheit above 65 degrees translates to about 30 additional cooling degree days. Based on historical cooling degree days and natural gas-fired electricity generation for the summer months of each year since 2011, for every additional 30 cooling degree days, another 140,000 megawatthours per day of natural gas-fired electricity and an additional 1.4 billion cubic feet per day of natural gas is consumed.
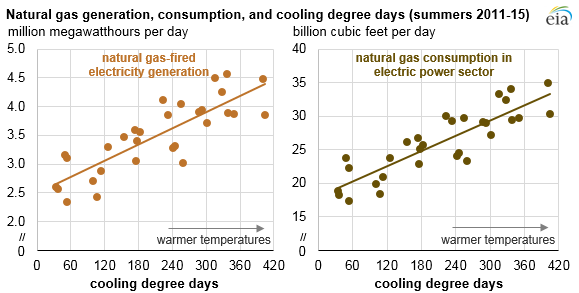
Note: Summer months are April through September.
Even though natural gas-fired generation has increased in recent years, it is expected to decline slightly in 2017 as natural gas prices increase. Spot prices at the benchmark Henry Hub have increased recently, from a monthly average of $1.92 per million British thermal units (MMBtu) in May to $2.59/MMBtu in June, the highest monthly Henry Hub spot price since September 2015. Based on the latest STEO forecast, EIA expects natural gas spot prices to remain low enough to support record-high natural gas-fired generation in 2016. In 2017, as spot natural gas prices continue to increase, natural gas-fired generation is expected to decrease by about 2%.
Principal contributor: Owen Comstock