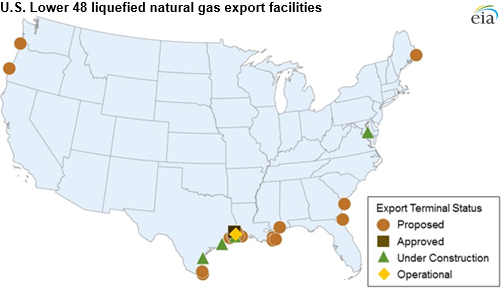
Growth in domestic natural gas production leads to development of LNG export terminals
The first export shipment of liquefied natural gas (LNG) produced in the Lower 48 states on February 24 is a milestone reflecting a decade of natural gas production growth that has put the United States in a new position in worldwide energy trade.
With the rapid growth of supply from shale gas resources over the past decade, U.S. natural gas production has grown each year since 2006. The resulting decline in domestic natural gas prices has led to rising natural gas exports, both via pipeline to Mexico and, since last week, to overseas markets via LNG tankers.
The United States is currently a net importer of natural gas, and gross imports represented nearly 10% of total supply in 2015, based on data through November. The United States imported 7.5 billion cubic feet per day (Bcf/d) of natural gas, mostly from Canada by pipeline, and exported 4.8 Bcf/d, mostly to Mexico by pipeline. For years, Alaska has exported LNG, mostly to Pacific Rim countries, but these volumes have been small. In addition to the Sabine Pass terminal that was the source of last week's LNG shipment, four other LNG export terminals are currently under construction.
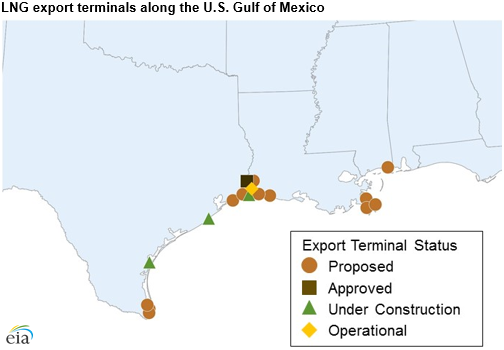
When natural gas is cooled to -260 degrees Fahrenheit, it becomes a liquid that is 1/600th of its gaseous volume, making it easier to transport via vessel. The U.S. Gulf Coast has a large existing pipeline network, which makes the area attractive for developing export terminals. Many of the LNG export terminals now under construction or proposed are at sites that have functioned, and may continue to function, as LNG import terminals. Several LNG import terminals were built in the 1970s, and a new wave of terminals was constructed in the mid- to late-2000s. As domestic production increased, LNG imports declined, as many new terminals were barely used and the utilization rates of older terminals declined.
The Federal Energy Regulatory Commission (FERC) is responsible for authorizing siting and construction of LNG export terminals (as well as import terminals) that are onshore or that are close to the shore. FERC prepares environmental impact statements to assess the environmental consequences of the terminals under its jurisdiction. Although most of the LNG terminals fall under FERC jurisdiction, the U.S. Maritime Administration regulates deepwater terminals. Only one deepwater export terminal has been proposed, and if approved, it would be located about 50 miles south of the Texas-Louisiana border in the Gulf of Mexico. In addition to approval for construction from FERC or the Maritime Administration, the U.S. Department of Energy's Office of Fossil Energy issues separate authorizations to export to countries based on whether they have a free trade agreement with the United States.
Cheniere Energy's Sabine Pass Liquefaction Project in Sabine Pass, Louisiana, consists of six different liquefaction units, or trains, the first of which began service in February after many delays. The other trains are in various stages of development and permitting. Total permitted capacity by FERC is 4.16 Bcf/d.
Four LNG export terminals are currently under construction:
- Dominion Energy's Cove Point LNG facility in Cove Point, Maryland, is scheduled to bring one train totaling 0.82 Bcf/d online near the end of 2017.
- Corpus Christi LNG, another Cheniere project, is under construction in Corpus Christi, Texas. The terminal is scheduled to begin service in 2018, with total permitted capacity at 2.14 Bcf/d.
- Sempra Energy's Cameron LNG terminal, located in Hackberry, Louisiana, is under construction and is scheduled to bring three trains online in 2018. A total of 1.7 Bcf/d has been permitted.
- Freeport LNG's terminal planned for Freeport, Texas, has three trains under construction totaling 1.8 Bcf/d. The first two are scheduled to begin service in 2019, and the third in 2020.
Another terminal, Southern Union's Lake Charles (Louisiana) LNG facility, has been approved by FERC but is not yet under construction. Lake Charles also has an LNG import terminal. Several more LNG export terminals, mostly on the Gulf Coast, have been proposed or have pending applications with FERC.
The new terminals are expected to take advantage of natural gas produced in the Appalachian Basin, particularly the Marcellus and Utica regions, the source of much of the nation's production growth over the past several years. The Sabine Pass Liquefaction project has secured 300 million cubic feet per day (MMcf/d) of natural gas from the Texas Gas Transmission Ohio-Louisiana Access Project, which facilitates additional flows of Marcellus and Utica natural gas to the southern United States. Additionally, Cheniere's Corpus Christi Liquefaction project will receive 385 MMcf/d from the Natural Gas Pipeline Company of America's Gulf Coast mainline pipeline system. Dominion's Cove Point (which began operating as an import terminal in 1978) already has a dedicated pipeline with a link to three interstate pipelines that operate in the Marcellus area.
Market conditions have changed since many LNG export projects in the United States were initially proposed. Proposed LNG terminals in the United States face not only increased competition from other domestic and foreign terminals that have been completed, but they also face uncertainty in global LNG demand. Australia, already a major LNG exporter, plans to expand its LNG export capacity in the coming years. In late 2015, two terminals began service in Australia, Gladstone LNG and Australia Pacific LNG, both located on Australia's East Coast. At the same time, LNG imports by countries in Asia declined slightly in 2015.
Principal contributor: John Krohn, Nicholas Skarzynski, Katie Teller