U.S. natural gas production resilient to market changes in 2015, but has fallen in 2016
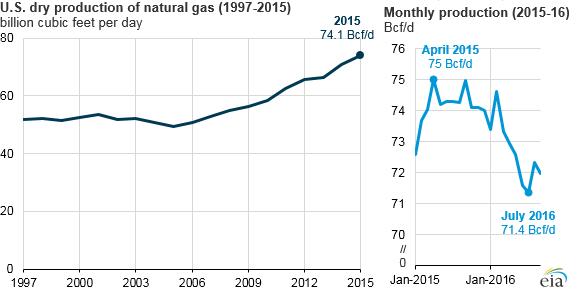
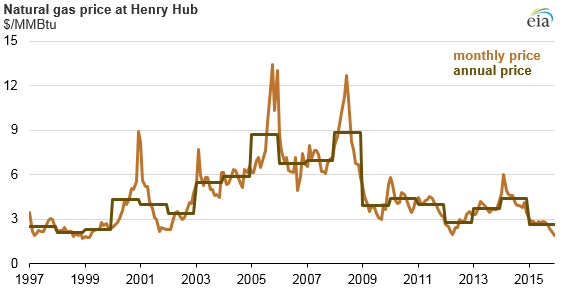
U.S. dry natural gas production continued to increase in 2015, reaching 74.1 billion cubic feet per day (Bcf/d). This record-high level was a 4.5% (3.2 Bcf/d) increase over 2014, according to EIA’s Natural Gas Annual, which provides final production data for 2015. The increase in 2015 production levels marked the tenth straight annual increase, with the most recent increase occurring despite natural gas prices at the Louisiana Henry Hub declining more than 40% from an average of $4.55 per million British thermal unit (MMBtu) in 2014 to $2.62/MMBtu in 2015.
Production gains were highest in Pennsylvania, Ohio, and West Virginia, due in large part to production from the Marcellus and Utica/Point Pleasant shales. These three states accounted for most of the total increase in 2015. Although annual production in 2015 grew, monthly U.S. natural gas production has since declined in 2016, falling to 71.4 Bcf/d in July 2016 after reaching a peak of 75 Bcf/d in April 2015.
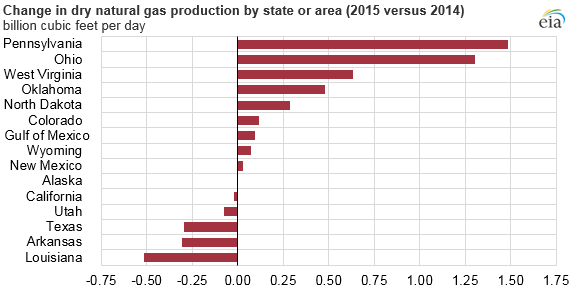
Texas remains the largest natural gas producing state, producing 19.4 Bcf/d in 2015. For the third consecutive year, Pennsylvania saw the largest total gain in annual production, increasing to 13 Bcf/d in 2015, up 11.4% from 11.6 Bcf/d in 2014. Ohio saw the largest percentage increase in natural gas production, increasing 49.9%, from 1.3 Bcf/d in 2014 to 2.6 Bcf/d in 2015. Louisiana production declined by the largest amount, falling to 4.8 Bcf/d in 2015, a decrease of 0.5 Bcf/d, or 10.8%, compared to 2014.
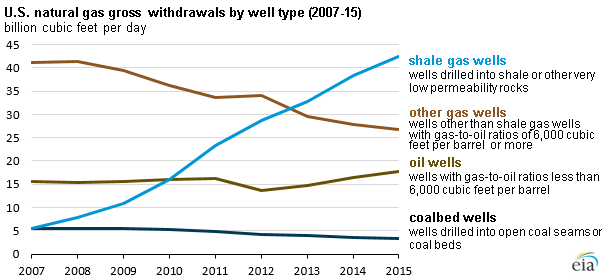
Shale gas wells continue to be the largest source of total natural gas production. According to the Natural Gas Annual, gross withdrawals from shale gas wells—which, unlike dry natural gas production, include all compounds extracted at the wellhead—increased from 38.3 Bcf/d in 2014 to 42.4 Bcf/d in 2015, representing 47% of total natural gas production. This increase in production occurred despite declines in natural gas prices.
Principal contributor: Emily Geary
Tags: natural gas, prices, production/supply, shale, states