| Overview |
| 1 |
Summary Statistics for Natural Gas in the United States, 2018-2022 |
PDF |
|
| 2 |
Natural Gas Production, Transmission, and Consumption by State, 2022 |
PDF |
|
| Supplies |
| 3 |
Gross Withdrawals and Marketed Production of Natural Gas by State and the Gulf of Mexico, 2018-2022 |
PDF |
|
| 4 |
Offshore Gross Withdrawals of Natural Gas by State and the Gulf of Mexico, 2018-2022 |
PDF |
|
| 5 |
Natural Gas Processed, Liquid Fuels Extracted, and Natural Gas Plant Liquids Production by State, 2022 |
PDF |
|
| 6 |
Supplemental Gas Supplies by State, 2022 |
PDF |
|
| Imports and Exports |
| 7 |
Summary of U.S. Natural Gas Imports, 2018-2022 |
PDF |
|
| 8 |
Summary of U.S. Natural Gas Imports by Point of Entry, 2018-2022 |
PDF |
|
| 9 |
Summary of U.S. Natural Gas Exports, 2018-2022 |
PDF |
|
| 10 |
Summary of U.S. Natural Gas Exports by Point of Exit, 2018-2022 |
PDF |
|
| Movements and Storage |
| 11 |
Interstate Movements and Movements Across U.S. Borders of Natural Gas by State, 2022 |
PDF |
|
| 12 |
Additions to and Withdrawals from Gas Storage by State, 2022 |
PDF |
|
| 13 |
Underground Natural Gas Storage Capacity by State, December 31, 2022 |
PDF |
|
| Consumption |
| 14 |
Consumption of Natural Gas by State, 2018-2022 |
PDF |
|
| 15 |
Natural Gas Delivered to Consumers by Sector, 2018-2022, and by State and Sector, 2022 |
PDF |
|
| 16 |
Natural Gas Delivered to Residential Consumers on Behalf of Other Companies by State, 2018-2022 |
PDF |
|
| 17 |
Natural Gas Delivered to Commercial Consumers on Behalf of Other Companies by State, 2018-2022 |
PDF |
|
| 18 |
Natural Gas Delivered to Industrial Consumers on Behalf of Other Companies by State, 2018-2022 |
PDF |
|
| 19 |
Number of Natural Gas Residential Consumers by Type of Service and State, 2021-2022 |
PDF |
|
| 20 |
Number of Natural Gas Commercial Consumers by Type of Service and State, 2021-2022 |
PDF |
|
| 21 |
Number of Natural Gas Industrial Consumers by Type of Service and State, 2021-2022 |
PDF |
|
| Consumer Prices |
| 22 |
Average Citygate Price of Natural Gas in the United States, 2018-2022 |
PDF |
|
| 23 |
Average Price of Natural Gas Delivered to Consumers by State, 2022 |
PDF |
|
| 24 |
Average Price of Natural Gas Delivered to Residential and Commercial Sector Consumers by Local Distribution and Marketers in Selected States, 2021-2022 |
PDF |
|
| 25 |
Number of Consumers Eligible and Participating in a Customer Choice Program in the Residential Sector, 2022 |
PDF |
|
| 26 |
Percent Distribution of Natural Gas Supply and Disposition by State, 2022 |
PDF |
|
| 27 |
Percent Distribution of Natural Gas Delivered to Consumers by State, 2022 |
PDF |
|
| State Summaries |
| S1 |
Summary Statistics for Natural Gas - Alabama, 2018-2022 |
PDF |
|
| S2 |
Summary Statistics for Natural Gas - Alaska, 2018-2022 |
PDF |
|
| S3 |
Summary Statistics for Natural Gas - Arizona, 2018-2022 |
PDF |
|
| S4 |
Summary Statistics for Natural Gas - Arkansas, 2018-2022 |
PDF |
|
| S5 |
Summary Statistics for Natural Gas - California, 2018-2022 |
PDF |
|
| S6 |
Summary Statistics for Natural Gas - Colorado, 2018-2022 |
PDF |
|
| S7 |
Summary Statistics for Natural Gas - Connecticut, 2018-2022 |
PDF |
|
| S8 |
Summary Statistics for Natural Gas - Delaware, 2018-2022 |
PDF |
|
| S9 |
Summary Statistics for Natural Gas - District of Columbia, 2018-2022 |
PDF |
|
| S10 |
Summary Statistics for Natural Gas - Florida, 2018-2022 |
PDF |
|
| S11 |
Summary Statistics for Natural Gas - Georgia, 2018-2022 |
PDF |
|
| S12 |
Summary Statistics for Natural Gas - Gulf of Mexico, 2018-2022 |
PDF |
|
| S13 |
Summary Statistics for Natural Gas - Hawaii, 2018-2022 |
PDF |
|
| S14 |
Summary Statistics for Natural Gas - Idaho, 2018-2022 |
PDF |
|
| S15 |
Summary Statistics for Natural Gas - Illinois, 2018-2022 |
PDF |
|
| S16 |
Summary Statistics for Natural Gas - Indiana, 2018-2022 |
PDF |
|
| S17 |
Summary Statistics for Natural Gas - Iowa, 2018-2022 |
PDF |
|
| S18 |
Summary Statistics for Natural Gas - Kansas, 2018-2022 |
PDF |
|
| S19 |
Summary Statistics for Natural Gas - Kentucky, 2018-2022 |
PDF |
|
| S20 |
Summary Statistics for Natural Gas - Louisiana, 2018-2022 |
PDF |
|
| S21 |
Summary Statistics for Natural Gas - Maine, 2018-2022 |
PDF |
|
| S22 |
Summary Statistics for Natural Gas - Maryland, 2018-2022 |
PDF |
|
| S23 |
Summary Statistics for Natural Gas - Massachusetts, 2018-2022 |
PDF |
|
| S24 |
Summary Statistics for Natural Gas - Michigan, 2018-2022 |
PDF |
|
| S25 |
Summary Statistics for Natural Gas - Minnesota, 2018-2022 |
PDF |
|
| S26 |
Summary Statistics for Natural Gas - Mississippi, 2018-2022 |
PDF |
|
| S27 |
Summary Statistics for Natural Gas - Missouri, 2018-2022 |
PDF |
|
| S28 |
Summary Statistics for Natural Gas - Montana, 2018-2022 |
PDF |
|
| S29 |
Summary Statistics for Natural Gas - Nebraska, 2018-2022 |
PDF |
|
| S30 |
Summary Statistics for Natural Gas - Nevada, 2018-2022 |
PDF |
|
| S31 |
Summary Statistics for Natural Gas - New Hampshire, 2018-2022 |
PDF |
|
| S32 |
Summary Statistics for Natural Gas - New Jersey, 2018-2022 |
PDF |
|
| S33 |
Summary Statistics for Natural Gas - New Mexico, 2018-2022 |
PDF |
|
| S34 |
Summary Statistics for Natural Gas - New York, 2018-2022 |
PDF |
|
| S35 |
Summary Statistics for Natural Gas - North Carolina, 2018-2022 |
PDF |
|
| S36 |
Summary Statistics for Natural Gas - North Dakota, 2018-2022 |
PDF |
|
| S37 |
Summary Statistics for Natural Gas - Ohio, 2018-2022 |
PDF |
|
| S38 |
Summary Statistics for Natural Gas - Oklahoma, 2018-2022 |
PDF |
|
| S39 |
Summary Statistics for Natural Gas - Oregon, 2018-2022 |
PDF |
|
| S40 |
Summary Statistics for Natural Gas - Pennsylvania, 2018-2022 |
PDF |
|
| S41 |
Summary Statistics for Natural Gas - Rhode Island, 2018-2022 |
PDF |
|
| S42 |
Summary Statistics for Natural Gas - South Carolina, 2018-2022 |
PDF |
|
| S43 |
Summary Statistics for Natural Gas - South Dakota, 2018-2022 |
PDF |
|
| S44 |
Summary Statistics for Natural Gas - Tennessee, 2018-2022 |
PDF |
|
| S45 |
Summary Statistics for Natural Gas - Texas, 2018-2022 |
PDF |
|
| S46 |
Summary Statistics for Natural Gas - Utah, 2018-2022 |
PDF |
|
| S47 |
Summary Statistics for Natural Gas - Vermont, 2018-2022 |
PDF |
|
| S48 |
Summary Statistics for Natural Gas - Virginia, 2018-2022 |
PDF |
|
| S49 |
Summary Statistics for Natural Gas - Washington, 2018-2022 |
PDF |
|
| S50 |
Summary Statistics for Natural Gas - West Virginia, 2018-2022 |
PDF |
|
| S51 |
Summary Statistics for Natural Gas - Wisconsin, 2018-2022 |
PDF |
|
| S52 |
Summary Statistics for Natural Gas - Wyoming, 2018-2022 |
PDF |
|
| Figures |
| Overview |
| 1 |
Natural Gas Flow in the United States, 2022 |
PDF |
|
| 2 |
Natural Gas Supply and Disposition in the United States, 2022 |
PDF |
|
| Supplies |
| 3 |
Marketed Production of Natural Gas in the United States and the Gulf of Mexico, 2022 |
PDF |
|
| 4 |
Marketed Production of Natural Gas in Selected States and the Gulf of Mexico, 2021-2022 |
PDF |
|
| 5 |
Gross Withdrawals of Natural Gas in the United States, by Type of Well, 2018-2022 |
PDF |
|
| 6 |
Natural Gas Processing by Point of Origin in the United States and the Gulf of Mexico, 2022 |
PDF |
|
| Imports and Exports |
| 7 |
U.S. Natural Gas Trade Summary, 2018-2022 |
PDF | |
| 8 |
Flow of Natural Gas Imports, 2022 |
PDF |
|
| 9 |
Flow of Natural Gas Exports by Pipeline, 2022 |
PDF |
|
| 10 |
Flow of Liquefied Natural Gas (LNG) Exports, 2022 |
PDF |
|
| 11 |
Natural Gas Flow Capacity Summary, by Region, 2022 |
PDF |
|
| 12 |
Net Interstate Movements, Imports, and Exports of Natural Gas in the United States, 2022 |
PDF |
|
| Movements and Storage |
| 13 |
Locations of Existing Natural Gas Underground Storage Fields in the United States, 2022 |
PDF |
|
| 14 |
Natural Gas Delivered to Consumers in the United States, 2018-2022 |
PDF |
|
| 15 |
Natural Gas Delivered to Consumers in the United States, 2022 |
PDF |
|
| Consumption |
| 16 |
Percent of Natural Gas Deliveries in the United States Representing Deliveries on Behalf of Other Companies, by Consumer Sector, 2018-2022 |
PDF |
|
| 17 |
Average Price of Natural Gas Delivered to Consumers in the United States, 2018-2022 |
PDF |
|
| 18 |
Average Price of Natural Gas Delivered to Residential Consumers, 1980-2022 |
PDF |
|
| Consumer Prices |
| 19 |
Average Citygate Price of Natural Gas in the United States, 2022 |
PDF |
|
| 20 |
Average Price of Natural Gas Delivered to U.S. Residential Consumers, 2022 |
PDF |
|
| 21 |
Average Price of Natural Gas Delivered to U.S. Commercial Consumers, 2022 |
PDF |
|
| 22 |
Average Price of Natural Gas Delivered to U.S. Industrial Consumers, 2022 |
PDF |
|
| 23 |
Average Price of Natural Gas Delivered to U.S. Electric Power Consumers, 2022 |
PDF |
|
| 24 |
Top Five States with Participants in a Residential Customer Choice Program, 2022 |
PDF |
|
| Appendices |
| A |
Summary of Data Collection Operations and Report Methodology, 2018-2022 |
PDF |
|
| |
Form EIA-176 |
PDF |
|
| |
Form EIA-895 |
PDF |
|
| |
Form EIA-910 |
PDF |
|
| B |
Metric and Thermal Conversion Tables |
PDF |
|
| Appendix Tables |
| A1 |
Natural Gas Losses and Unaccounted for by State, 2022 |
PDF |
|
| B1 |
Summary Statistics for Natural Gas in the United States, Metric Equivalents, 2018-2022 |
PDF |
|
| B2 |
Thermal Conversion Factors and Data, 2018-2022 |
PDF |
|
| Glossary |
| |
Natural Gas Annual Glossary |
PDF |
|
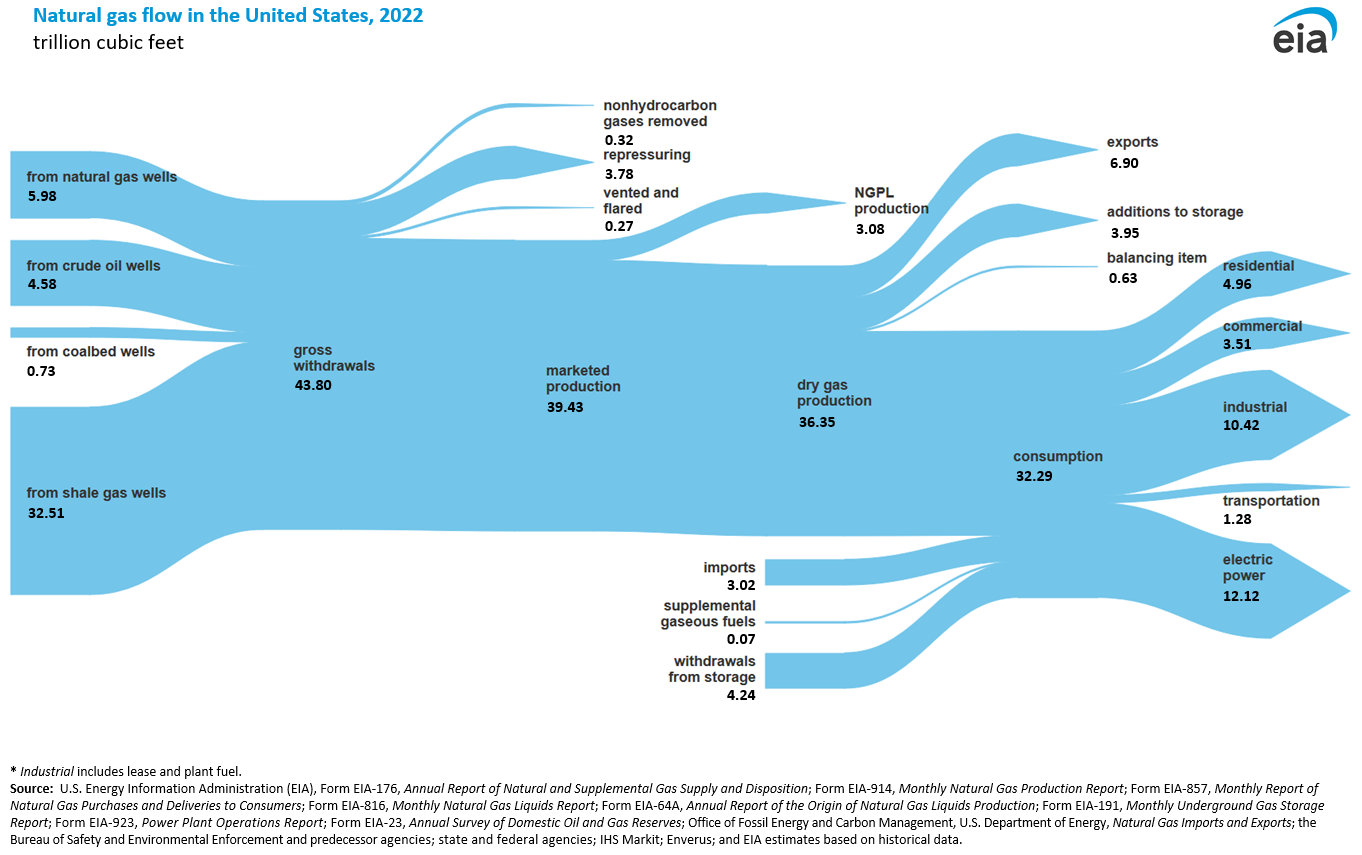 figure data